Dahe
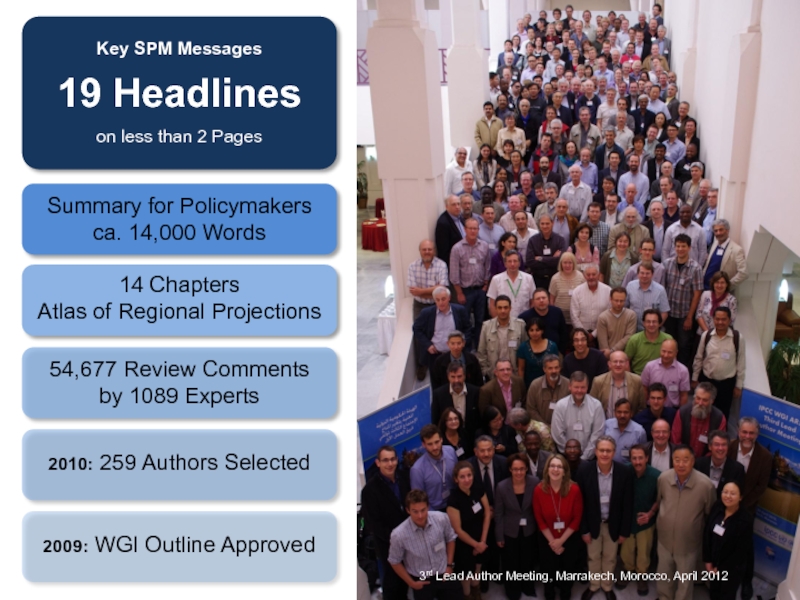
259 Authors from 39 Countries
WGI Technical Support Unit Team
- Главная
- Разное
- Дизайн
- Бизнес и предпринимательство
- Аналитика
- Образование
- Развлечения
- Красота и здоровье
- Финансы
- Государство
- Путешествия
- Спорт
- Недвижимость
- Армия
- Графика
- Культурология
- Еда и кулинария
- Лингвистика
- Английский язык
- Астрономия
- Алгебра
- Биология
- География
- Детские презентации
- Информатика
- История
- Литература
- Маркетинг
- Математика
- Медицина
- Менеджмент
- Музыка
- МХК
- Немецкий язык
- ОБЖ
- Обществознание
- Окружающий мир
- Педагогика
- Русский язык
- Технология
- Физика
- Философия
- Химия
- Шаблоны, картинки для презентаций
- Экология
- Экономика
- Юриспруденция
The WGI Contribution to the IPCC 5th Assessment Report презентация
Содержание
- 1. The WGI Contribution to the IPCC 5th Assessment Report
- 4. IPCC Assessment Reports since 1990: WGI Contribution 1990 1995 2001 2007 2013
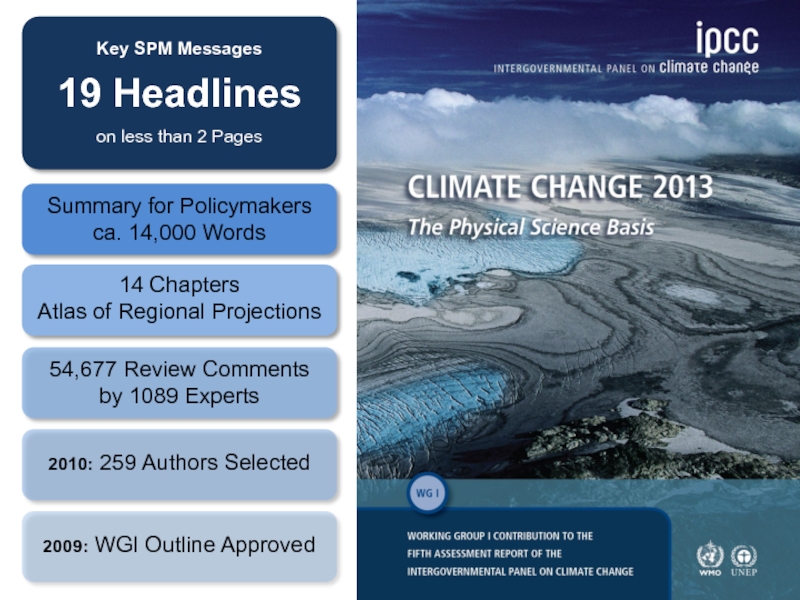
- 5. Development Process of the WGI Contribution to the IPCC 5th Assessment Report
- 6. WGI Summary for Policymakers Figures
- 7. Figure SPM.1a Observed globally averaged combined land
- 8. Figure SPM.1b Observed change in surface temperature 1901-2012 All Figures © IPCC 2013
- 9. Figure SPM.2 Observed change in annual precipitation over land All Figures © IPCC 2013
- 10. Figure SPM.3 Multiple observed indicators of a changing global climate All Figures © IPCC 2013
- 11. Figure SPM.4 Multiple observed indicators of a
- 12. Figure SPM.5 Radiative forcing estimates in 2011 relative to 1750 All Figures © IPCC 2013
- 13. Figure SPM.6 Comparison of observed and simulated climate change All Figures © IPCC 2013
- 14. Figure SPM.7a Global average surface temperature change All Figures © IPCC 2013
- 15. Figure SPM.7b Northern Hemisphere September sea ice extent All Figures © IPCC 2013
- 16. Figure SPM.7c Global ocean surface pH All Figures © IPCC 2013
- 17. Figure SPM.8a,b Maps of CMIP5 multi-model mean results All Figures © IPCC 2013
- 18. Figure SPM.8c Maps of CMIP5 multi-model mean
- 19. Figure SPM.8d Maps of CMIP5 multi-model mean results All Figures © IPCC 2013
- 20. Figure SPM.9 Global mean sea level rise All Figures © IPCC 2013
- 21. Figure SPM.10 Temperature increase and cumulative carbon emissions All Figures © IPCC 2013
- 22. WGI Summary for Policymakers Headline Statements
- 23. Observed Changes in the Climate System (1/2)
- 24. Observed Changes in the Climate System (2/2)
- 25. Drivers of Climate Change (1/1) Total radiative
- 26. Understanding the Climate System and its Recent
- 27. Future Global and Regional Climate Change (1/2)
- 28. Future Global and Regional Climate Change (2/2)


Слайд 7Figure SPM.1a Observed globally averaged combined land and ocean surface temperature anomaly
1850-2012
All Figures © IPCC 2013


Слайд 10Figure SPM.3
Multiple observed indicators of a changing global climate
All Figures ©
IPCC 2013

Слайд 11Figure SPM.4
Multiple observed indicators of a changing global carbon cycle
All Figures
© IPCC 2013


Слайд 23Observed Changes in the Climate System (1/2)
Warming of the climate system
is unequivocal, and since the 1950s, many of the observed changes are unprecedented over decades to millennia. The atmosphere and ocean have warmed, the amounts of snow and ice have diminished, sea level has risen, and the concentrations of greenhouse gases have increased.
Each of the last three decades has been successively warmer at the Earth’s surface than any preceding decade since 1850. In the Northern Hemisphere, 1983–2012 was likely the warmest 30-year period of the last 1400 years (medium confidence).
Ocean warming dominates the increase in energy stored in the climate system, accounting for more than 90% of the energy accumulated between 1971 and 2010 (high confidence). It is virtually certain that the upper ocean (0–700 m) warmed from 1971 to 2010, and it likely warmed between the 1870s and 1971.
Over the last two decades, the Greenland and Antarctic ice sheets have been losing mass, glaciers have continued to shrink almost worldwide, and Arctic sea ice and Northern Hemisphere spring snow cover have continued to decrease in extent (high confidence).
Warming of the climate system is unequivocal, and since")
Слайд 24Observed Changes in the Climate System (2/2)
The rate of sea level
rise since the mid-19th century has been larger than the mean rate during the previous two millennia (high confidence). Over the period 1901 to 2010, global mean sea level rose by 0.19 [0.17 to 0.21] m.
The atmospheric concentrations of carbon dioxide, methane, and nitrous oxide have increased to levels unprecedented in at least the last 800,000 years. Carbon dioxide concentrations have increased by 40% since pre-industrial times, primarily from fossil fuel emissions and secondarily from net land use change emissions. The ocean has absorbed about 30% of the emitted anthropogenic carbon dioxide, causing ocean acidification.
The rate of sea level rise since the mid-19th")
Слайд 25Drivers of Climate Change (1/1)
Total radiative forcing is positive, and has
led to an uptake of energy by the climate system. The largest contribution to total radiative forcing is caused by the increase in the atmospheric concentration of CO2 since 1750.
Total radiative forcing is positive, and has led to an uptake")
Слайд 26Understanding the Climate System and its Recent Changes (1/1)
Human influence on
the climate system is clear. This is evident from the increasing greenhouse gas concentrations in the atmosphere, positive radiative forcing, observed warming, and understanding of the climate system.
Climate models have improved since the AR4. Models reproduce observed continental-scale surface temperature patterns and trends over many decades, including the more rapid warming since the mid-20th century and the cooling immediately following large volcanic eruptions (very high confidence).
Observational and model studies of temperature change, climate feedbacks and changes in the Earth’s energy budget together provide confidence in the magnitude of global warming in response to past and future forcing.
Human influence has been detected in warming of the atmosphere and the ocean, in changes in the global water cycle, in reductions in snow and ice, in global mean sea level rise, and in changes in some climate extremes. This evidence for human influence has grown since AR4. It is extremely likely that human influence has been the dominant cause of the observed warming since the mid-20th century.
Human influence on the climate system is")
Слайд 27Future Global and Regional Climate Change (1/2)
Continued emissions of greenhouse gases
will cause further warming and changes in all components of the climate system. Limiting climate change will require substantial and sustained reductions of greenhouse gas emissions.
Global surface temperature change for the end of the 21st century is likely to exceed 1.5°C relative to 1850 to 1900 for all RCP scenarios except RCP2.6. It is likely to exceed 2°C for RCP6.0 and RCP8.5, and more likely than not to exceed 2°C for RCP4.5. Warming will continue beyond 2100 under all RCP scenarios except RCP2.6. Warming will continue to exhibit interannual-to-decadal variability and will not be regionally uniform.
Changes in the global water cycle in response to the warming over the 21st century will not be uniform. The contrast in precipitation between wet and dry regions and between wet and dry seasons will increase, although there may be regional exceptions.
The global ocean will continue to warm during the 21st century. Heat will penetrate from the surface to the deep ocean and affect ocean circulation.
Continued emissions of greenhouse gases will cause further warming")
Слайд 28Future Global and Regional Climate Change (2/2)
It is very likely that
the Arctic sea ice cover will continue to shrink and thin and that Northern Hemisphere spring snow cover will decrease during the 21st century as global mean surface temperature rises. Global glacier volume will further decrease.
Global mean sea level will continue to rise during the 21st century. Under all RCP scenarios, the rate of sea level rise will very likely exceed that observed during 1971 to 2010 due to increased ocean warming and increased loss of mass from glaciers and ice sheets.
Climate change will affect carbon cycle processes in a way that will exacerbate the increase of CO2 in the atmosphere (high confidence). Further uptake of carbon by the ocean will increase ocean acidification.
Cumulative emissions of CO2 largely determine global mean surface warming by the late 21st century and beyond. Most aspects of climate change will persist for many centuries even if emissions of CO2 are stopped. This represents a substantial multi-century climate change commitment created by past, present and future emissions of CO2.
It is very likely that the Arctic sea ice")