- Главная
- Разное
- Дизайн
- Бизнес и предпринимательство
- Аналитика
- Образование
- Развлечения
- Красота и здоровье
- Финансы
- Государство
- Путешествия
- Спорт
- Недвижимость
- Армия
- Графика
- Культурология
- Еда и кулинария
- Лингвистика
- Английский язык
- Астрономия
- Алгебра
- Биология
- География
- Детские презентации
- Информатика
- История
- Литература
- Маркетинг
- Математика
- Медицина
- Менеджмент
- Музыка
- МХК
- Немецкий язык
- ОБЖ
- Обществознание
- Окружающий мир
- Педагогика
- Русский язык
- Технология
- Физика
- Философия
- Химия
- Шаблоны, картинки для презентаций
- Экология
- Экономика
- Юриспруденция
The Simple Secret to America’s Shale Revolution презентация
Содержание
- 1. The Simple Secret to America’s Shale Revolution
- 2. The Spectacular Success of Shale Drilling In
- 3. The Spectacular Success of Shale Drilling Production
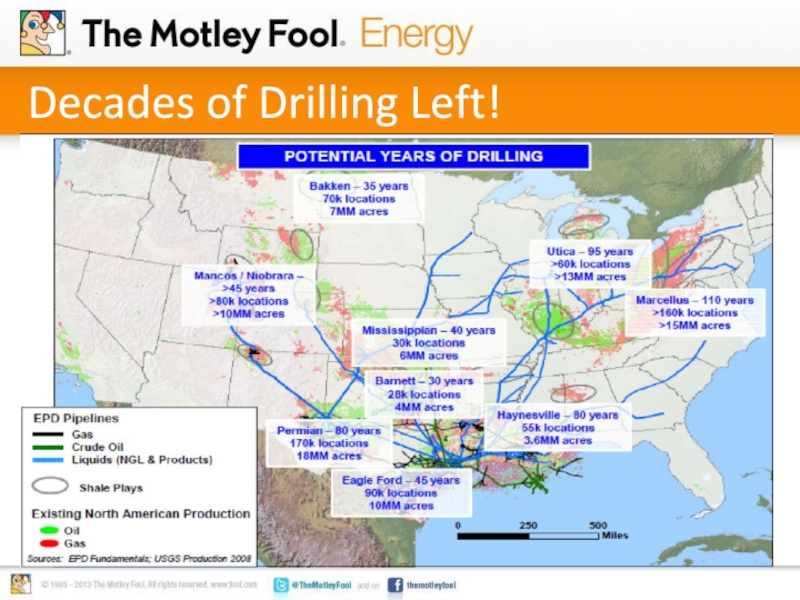
- 4. Photo Source: NASA Decades of Drilling Left!
- 5. What Has Made it So Successful? Photo
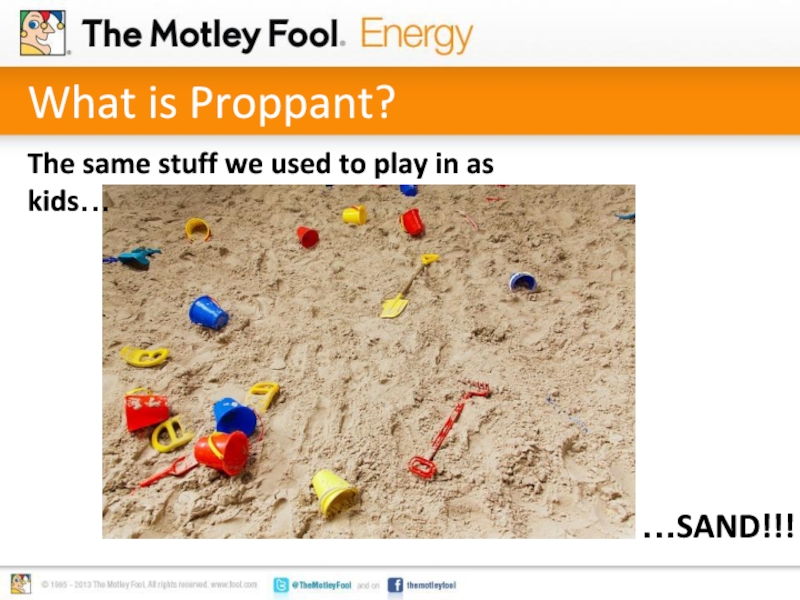
- 6. What is Proppant? …SAND!!! The same stuff we used to play in as kids…
- 7. Factors Influencing Proppant Use Photo Source: NASA
- 8. Proppant Demand Forecast Compounded annual growth
- 9. Who Are the Big Players? Photo Source: NASA
- 10. US Silica Holdings (NYSE: SLCA) Photo Source: NASA
- 11. US Silica Holdings Photo Source: NASA Photo
- 12. Hi-Crush Partners LP (NYSE: HCLP) Photo Source: NASA
- 13. Hi-Crush Partners LP Photo Source: NASA Photo
- 14. Emergy Energy Services (NYSE: EMES) Photo Source: NASA
- 15. Emerge Energy Services Photo Source: NASA Photo
- 16. Carbo Ceramics (NYSE: CRR) Photo Source: NASA
- 17. Why Ceramic? Photo Source: NASA Photo Credit:
- 18. Carbo Ceramics Photo Source: NASA Photo Credit:
- 19. What does this all mean to me?
- 20. OPEC’s Worst Nightmare…
Слайд 2The Spectacular Success of Shale Drilling
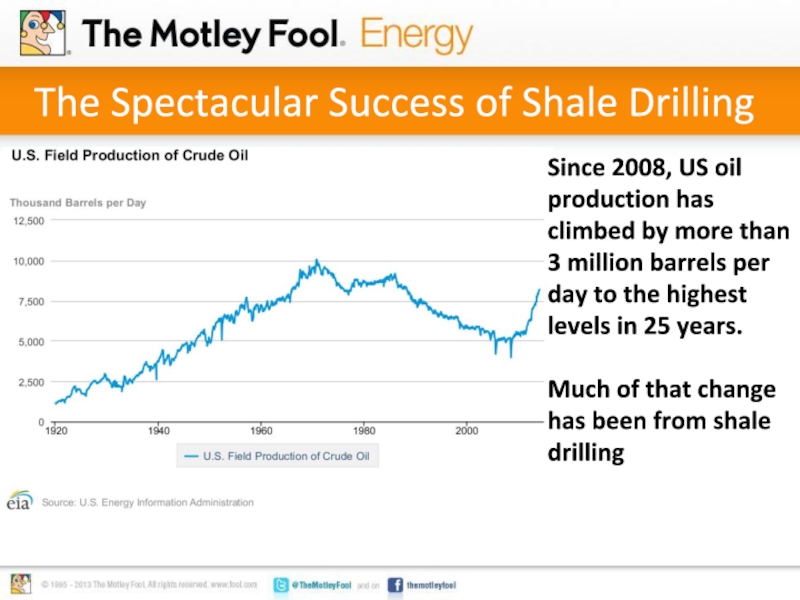
In
Since 2008, US oil production
Much of that change has been from shale drilling
Слайд 3The Spectacular Success of Shale Drilling
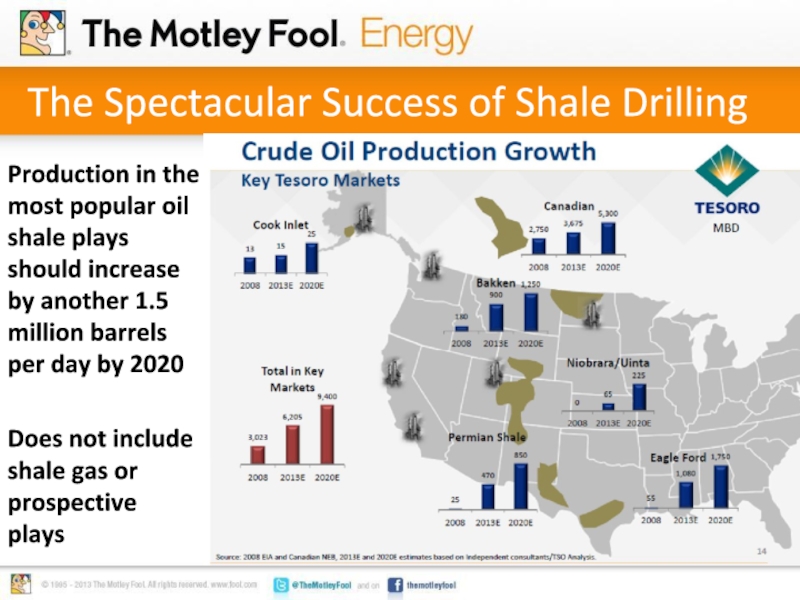
Production in the most popular oil
Does not include shale gas or prospective plays
Слайд 5What Has Made it So Successful?
Photo Source: NASA
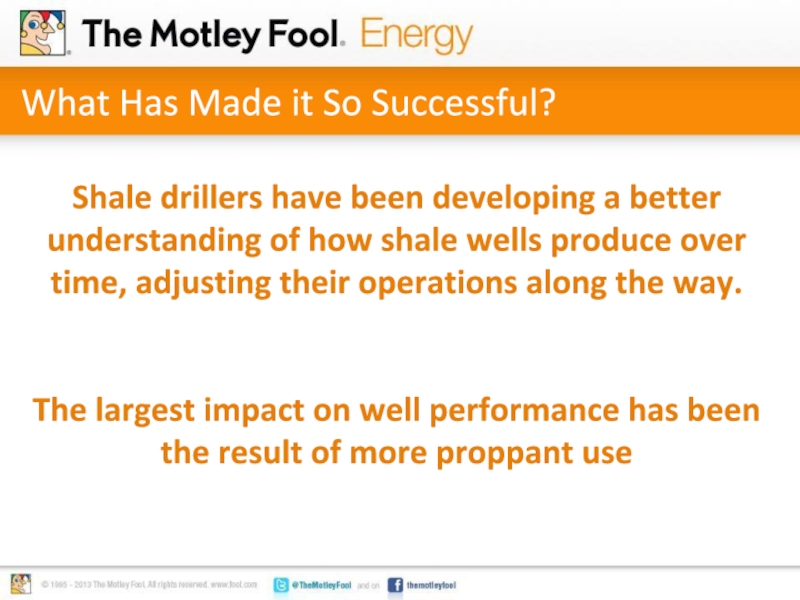
Shale drillers have been
The largest impact on well performance has been the result of more proppant use
Слайд 7Factors Influencing Proppant Use
Photo Source: NASA
Photo Credit: Wes Peck via Flickr.
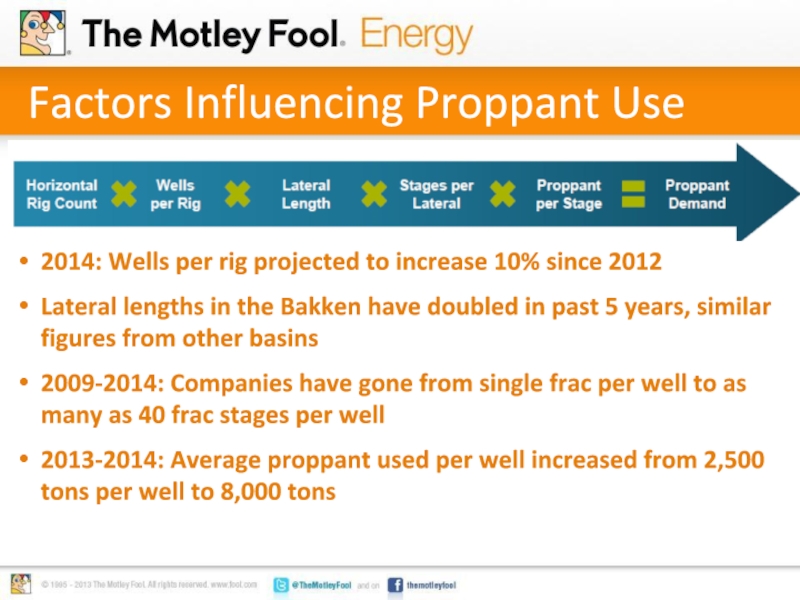
2014: Wells per rig projected to increase 10% since 2012
Lateral lengths in the Bakken have doubled in past 5 years, similar figures from other basins
2009-2014: Companies have gone from single frac per well to as many as 40 frac stages per well
2013-2014: Average proppant used per well increased from 2,500 tons per well to 8,000 tons
Слайд 8Proppant Demand Forecast
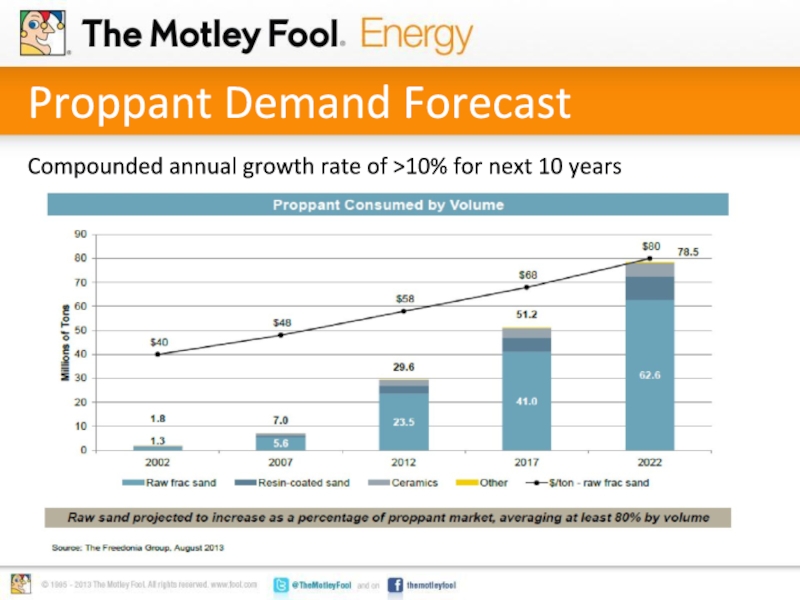
Compounded annual growth rate of >10% for next
Photo Source: NASA
Слайд 11US Silica Holdings
Photo Source: NASA
Photo Credit: Wes Peck via Flickr. com
What
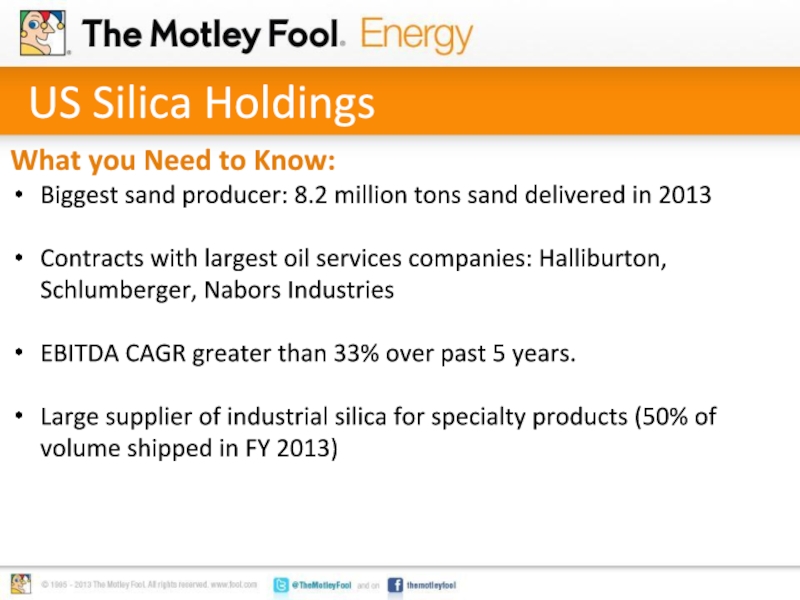
Biggest sand producer: 8.2 million tons sand delivered in 2013
Contracts with largest oil services companies: Halliburton, Schlumberger, Nabors Industries
EBITDA CAGR greater than 33% over past 5 years.
Large supplier of industrial silica for specialty products (50% of volume shipped in FY 2013)
Слайд 13Hi-Crush Partners LP
Photo Source: NASA
Photo Credit: Wes Peck via Flickr. com
What
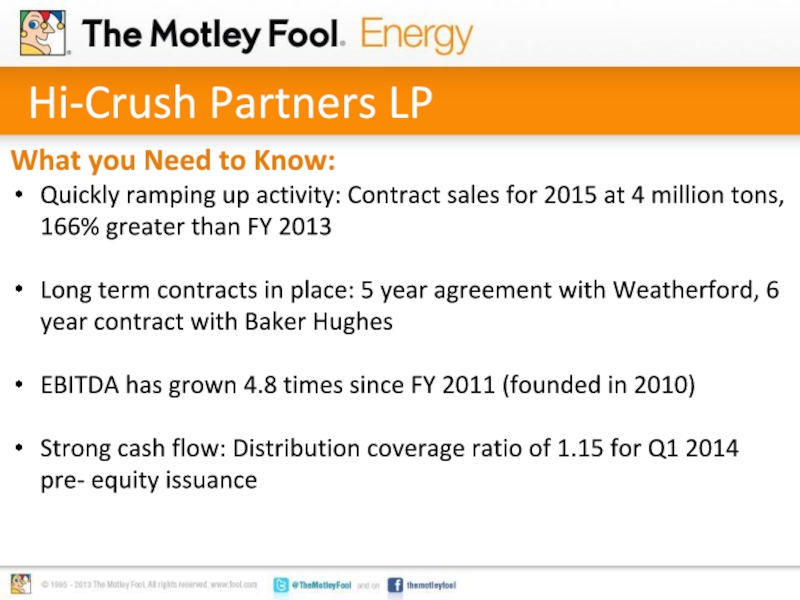
Quickly ramping up activity: Contract sales for 2015 at 4 million tons, 166% greater than FY 2013
Long term contracts in place: 5 year agreement with Weatherford, 6 year contract with Baker Hughes
EBITDA has grown 4.8 times since FY 2011 (founded in 2010)
Strong cash flow: Distribution coverage ratio of 1.15 for Q1 2014 pre- equity issuance
Слайд 15Emerge Energy Services
Photo Source: NASA
Photo Credit: Wes Peck via Flickr. com
What
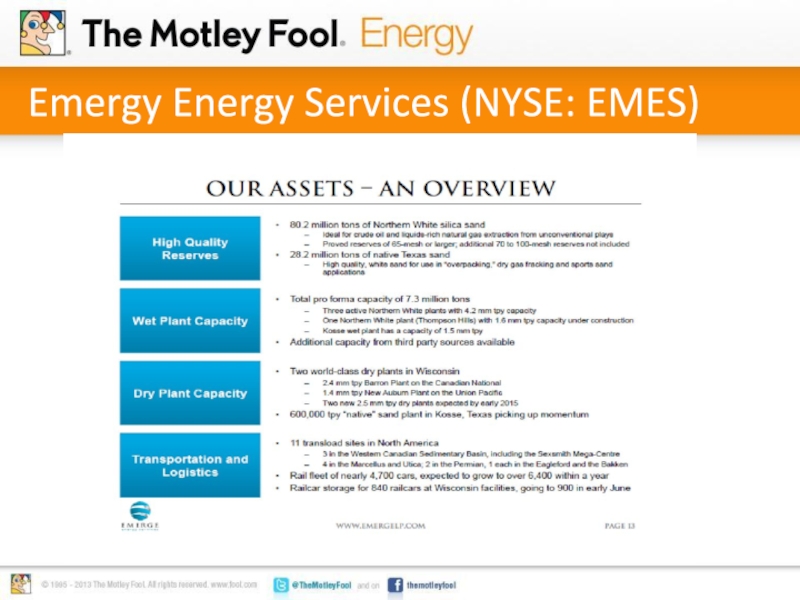
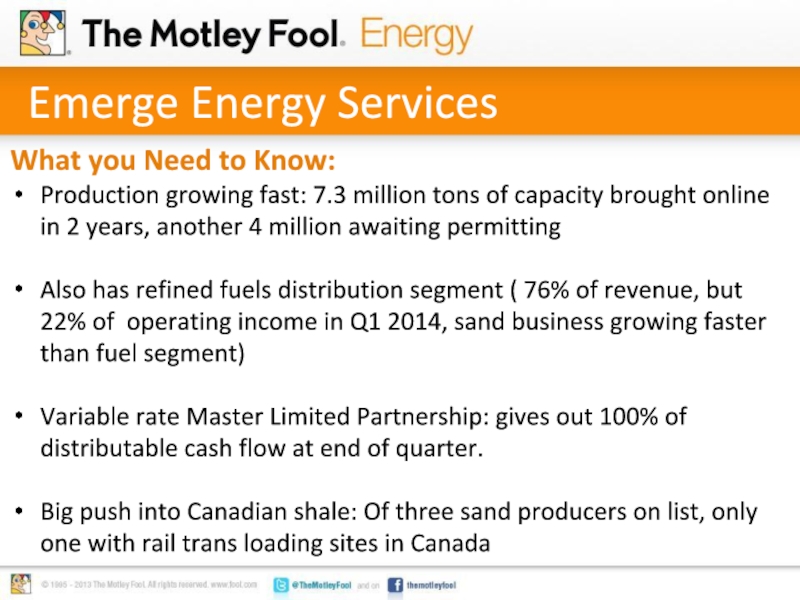
Production growing fast: 7.3 million tons of capacity brought online in 2 years, another 4 million awaiting permitting
Also has refined fuels distribution segment ( 76% of revenue, but 22% of operating income in Q1 2014, sand business growing faster than fuel segment)
Variable rate Master Limited Partnership: gives out 100% of distributable cash flow at end of quarter.
Big push into Canadian shale: Of three sand producers on list, only one with rail trans loading sites in Canada
Слайд 16Carbo Ceramics (NYSE: CRR)
Photo Source: NASA
Photo Credit: Wes Peck via Flickr.
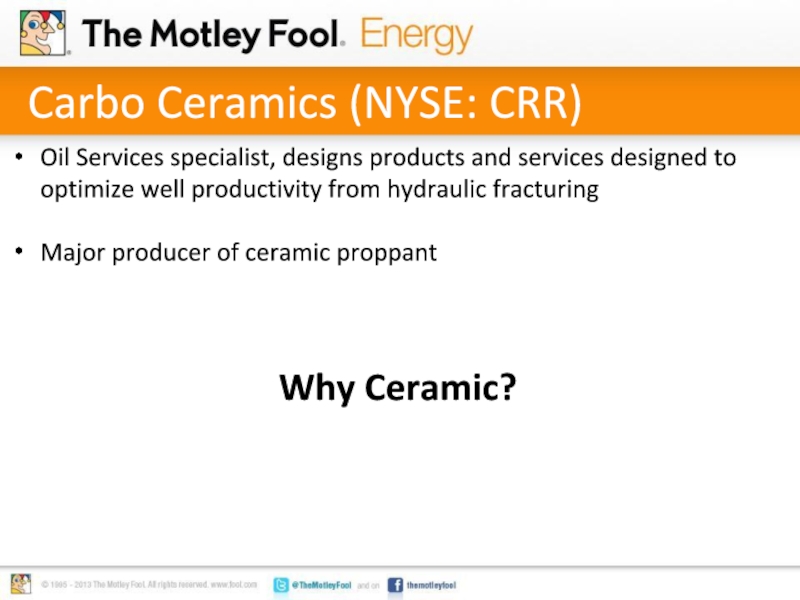
Oil Services specialist, designs products and services designed to optimize well productivity from hydraulic fracturing
Major producer of ceramic proppant
Why Ceramic?
Слайд 17Why Ceramic?
Photo Source: NASA
Photo Credit: Wes Peck via Flickr. com
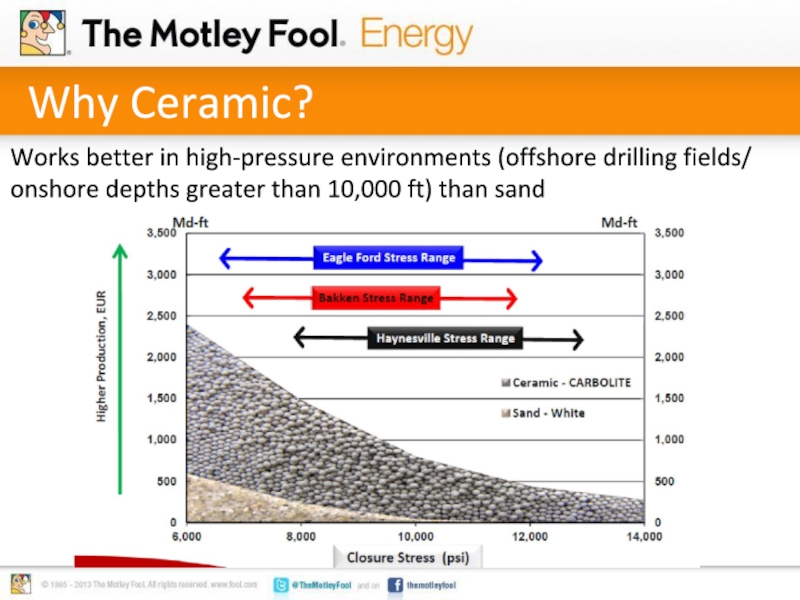
Works better
Слайд 18Carbo Ceramics
Photo Source: NASA
Photo Credit: Wes Peck via Flickr. com
What you
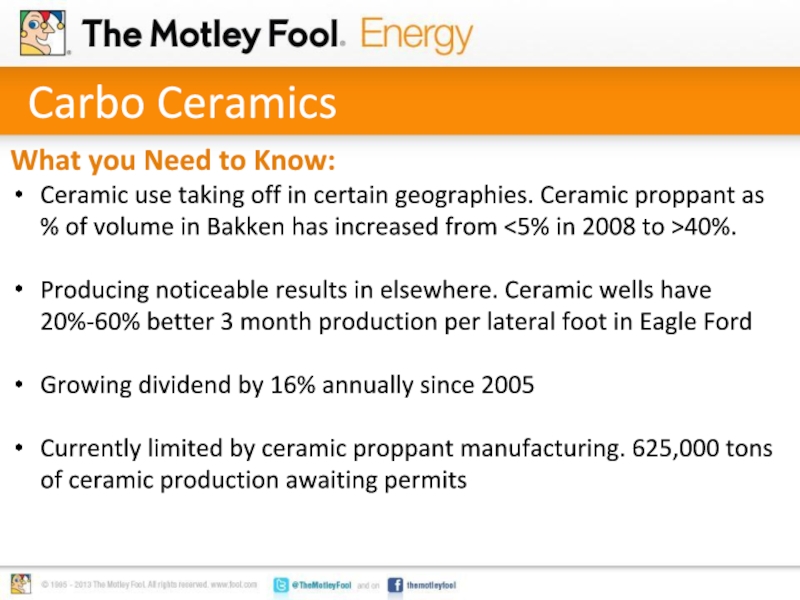
Ceramic use taking off in certain geographies. Ceramic proppant as % of volume in Bakken has increased from <5% in 2008 to >40%.
Producing noticeable results in elsewhere. Ceramic wells have 20%-60% better 3 month production per lateral foot in Eagle Ford
Growing dividend by 16% annually since 2005
Currently limited by ceramic proppant manufacturing. 625,000 tons of ceramic production awaiting permits
Слайд 19What does this all mean to me?
Better well results from increased
Photo Source: NASA
