- Главная
- Разное
- Дизайн
- Бизнес и предпринимательство
- Аналитика
- Образование
- Развлечения
- Красота и здоровье
- Финансы
- Государство
- Путешествия
- Спорт
- Недвижимость
- Армия
- Графика
- Культурология
- Еда и кулинария
- Лингвистика
- Английский язык
- Астрономия
- Алгебра
- Биология
- География
- Детские презентации
- Информатика
- История
- Литература
- Маркетинг
- Математика
- Медицина
- Менеджмент
- Музыка
- МХК
- Немецкий язык
- ОБЖ
- Обществознание
- Окружающий мир
- Педагогика
- Русский язык
- Технология
- Физика
- Философия
- Химия
- Шаблоны, картинки для презентаций
- Экология
- Экономика
- Юриспруденция
Describing graphs with trends. Tips and strategies презентация
Содержание
- 1. Describing graphs with trends. Tips and strategies
- 2. Academic Writing – formal writing Write in
- 3. Introduction. Paraphrasing the rubric The task: The
- 4. Introduction with uncountable nouns We, basically, just
- 5. Overview. Highlighting the key trends Describe
- 6. Some useful language There are two general
- 7. Main body paragraphs (1 or 2) First
- 8. Language to describe changes 1 Put the
- 9. Language to describe changes 1 Key NB
- 10. Language to describe changes 2 Which
- 11. Language to describe changes 3 Literally the
- 12. Practice. Adjective + Noun Rewrite these sentences,
- 13. Look at this task: The
- 14. Model Answer The provided graph highlights data
- 15. Language use. Linking expressions Linking phrases to
- 16. Language use. Prepositions Ss have a handout
- 17. Comment on data Make your essay more
- 18. More practice Look at he graph and
- 19. Same kind of data, different form
- 20. Same kind of data, different form 2
- 21. But what if… the diagram shows a
- 22. Now give it a try! 150 words
- 23. Feel like practicing? Burnaby Public Library –
- 24. Thanks for attention if you still do
Слайд 1IELTS Writing Task 1
Describing graphs with trends
TIPS AND STRATEGIES
Designed by Aleksandr
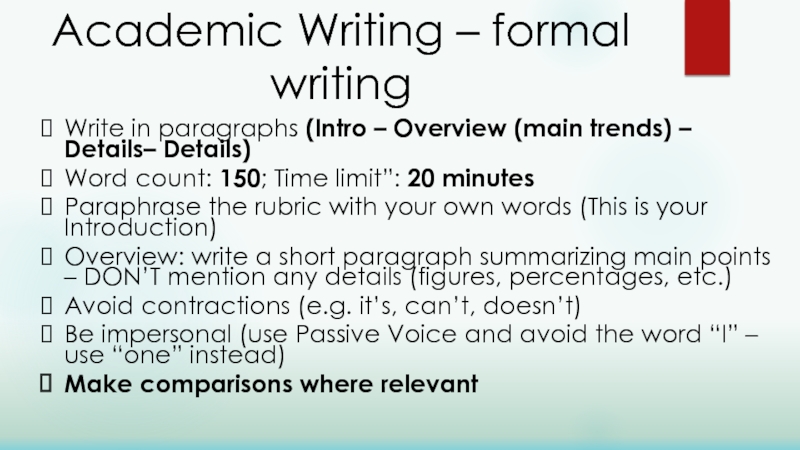
Слайд 2Academic Writing – formal writing
Write in paragraphs (Intro – Overview (main
Word count: 150; Time limit”: 20 minutes
Paraphrase the rubric with your own words (This is your Introduction)
Overview: write a short paragraph summarizing main points – DON’T mention any details (figures, percentages, etc.)
Avoid contractions (e.g. it’s, can’t, doesn’t)
Be impersonal (use Passive Voice and avoid the word “I” – use “one” instead)
Make comparisons where relevant
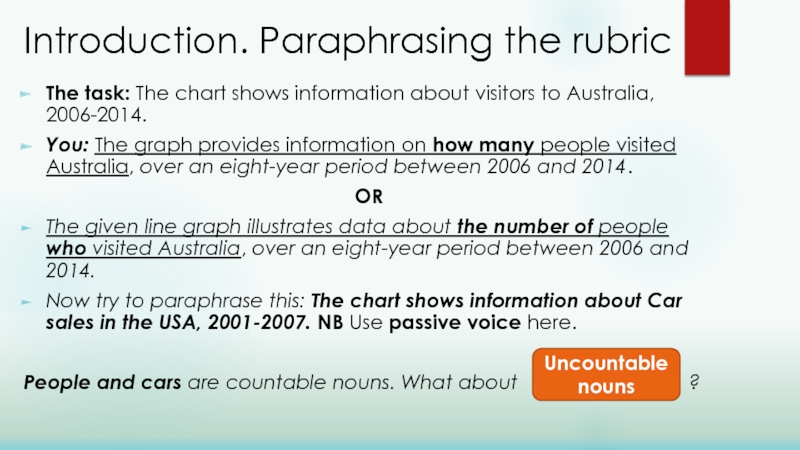
Слайд 3Introduction. Paraphrasing the rubric
The task: The chart shows information about visitors
You: The graph provides information on how many people visited Australia, over an eight-year period between 2006 and 2014.
OR
The given line graph illustrates data about the number of people who visited Australia, over an eight-year period between 2006 and 2014.
Now try to paraphrase this: The chart shows information about Car sales in the USA, 2001-2007. NB Use passive voice here.
People and cars are countable nouns. What about ?
Uncountable nouns
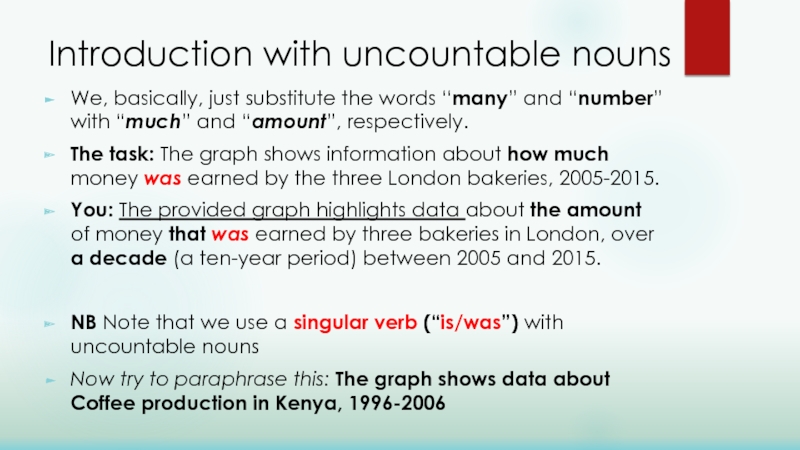
Слайд 4Introduction with uncountable nouns
We, basically, just substitute the words “many” and
The task: The graph shows information about how much money was earned by the three London bakeries, 2005-2015.
You: The provided graph highlights data about the amount of money that was earned by three bakeries in London, over a decade (a ten-year period) between 2005 and 2015.
NB Note that we use a singular verb (“is/was”) with uncountable nouns
Now try to paraphrase this: The graph shows data about Coffee production in Kenya, 1996-2006
Слайд 5Overview. Highlighting the key trends
Describe general trends (if they were
Start it with a Linking expression, e.g. “Overall, what stands out from the graph is that …” / “In general, it can be seen that …” and describe trends.
Add another sentence outlining a striking feature. Start by “Another remarkable/striking point is that …” or “In addition, …”.
2 sentences are absolutely enough for your overview.
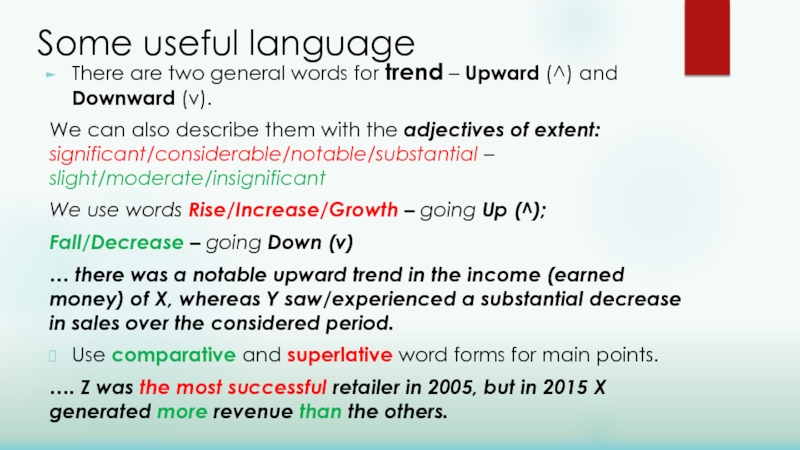
Слайд 6Some useful language
There are two general words for trend – Upward
We can also describe them with the adjectives of extent: significant/considerable/notable/substantial – slight/moderate/insignificant
We use words Rise/Increase/Growth – going Up (^);
Fall/Decrease – going Down (v)
… there was a notable upward trend in the income (earned money) of X, whereas Y saw/experienced a substantial decrease in sales over the considered period.
Use comparative and superlative word forms for main points.
…. Z was the most successful retailer in 2005, but in 2015 X generated more revenue than the others.
Слайд 7Main body paragraphs (1 or 2)
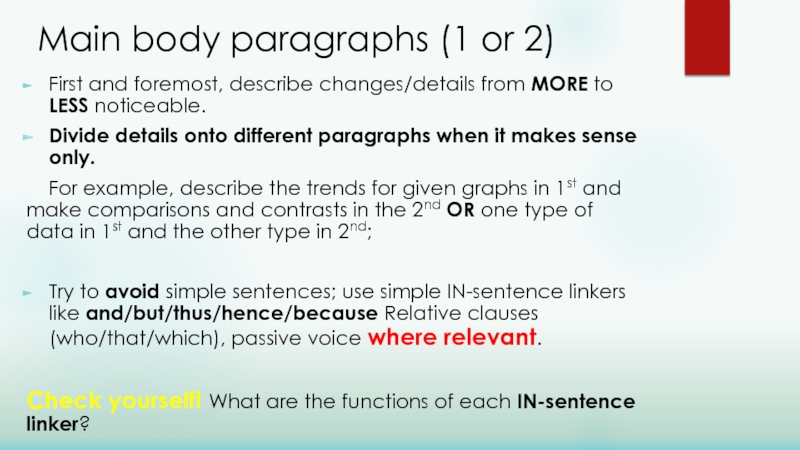
First and foremost, describe changes/details from
Divide details onto different paragraphs when it makes sense only.
For example, describe the trends for given graphs in 1st and make comparisons and contrasts in the 2nd OR one type of data in 1st and the other type in 2nd;
Try to avoid simple sentences; use simple IN-sentence linkers like and/but/thus/hence/because Relative clauses (who/that/which), passive voice where relevant.
Check yourself! What are the functions of each IN-sentence linker?
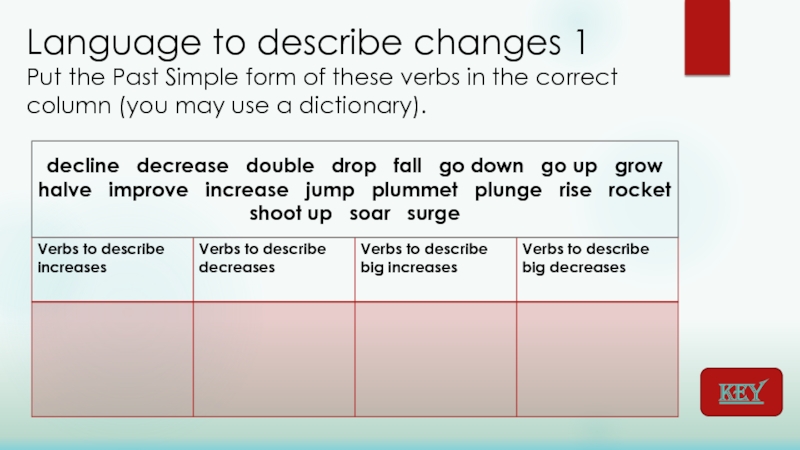
Слайд 8Language to describe changes 1 Put the Past Simple form of these
decline decrease double drop fall go down go up grow halve improve increase jump plummet plunge rise rocket shoot up soar surge
KEY
Слайд 9Language to describe changes 1
Key
NB it is more effective to memorize
Back
Слайд 10Language to describe changes 2
Which of these adverbs describe 1.a big
considerably dramatically gradually rapidly remarkably marginally sharply significantly slightly steadily
Other good expressions. Check their meaning!
Income fluctuated and then levelled off.
Income reached a peak (^) / hit the trough (v).
The figure remained stable in the first three years.
Income increased steadily year on year.
Earnings worsened in the last three years.
Слайд 11Language to describe changes 3
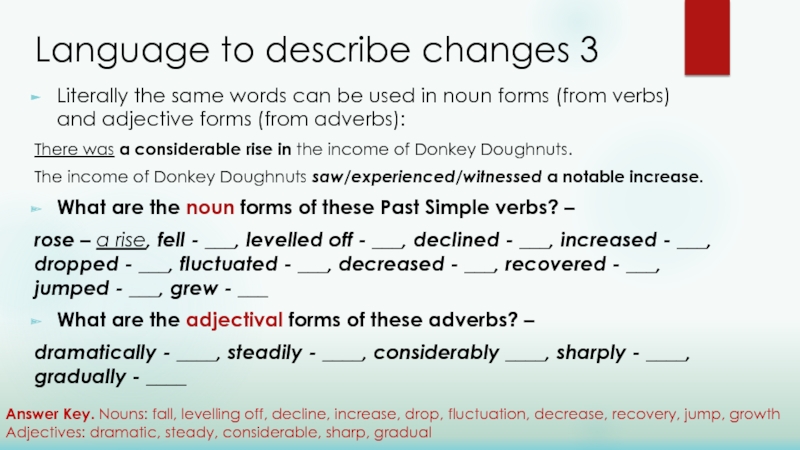
Literally the same words can be used
There was a considerable rise in the income of Donkey Doughnuts.
The income of Donkey Doughnuts saw/experienced/witnessed a notable increase.
What are the noun forms of these Past Simple verbs? –
rose – a rise, fell - ___, levelled off - ___, declined - ___, increased - ___, dropped - ___, fluctuated - ___, decreased - ___, recovered - ___, jumped - ___, grew - ___
What are the adjectival forms of these adverbs? –
dramatically - ____, steadily - ____, considerably ____, sharply - ____, gradually - ____
Answer Key. Nouns: fall, levelling off, decline, increase, drop, fluctuation, decrease, recovery, jump, growth
Adjectives: dramatic, steady, considerable, sharp, gradual
Слайд 12Practice. Adjective + Noun
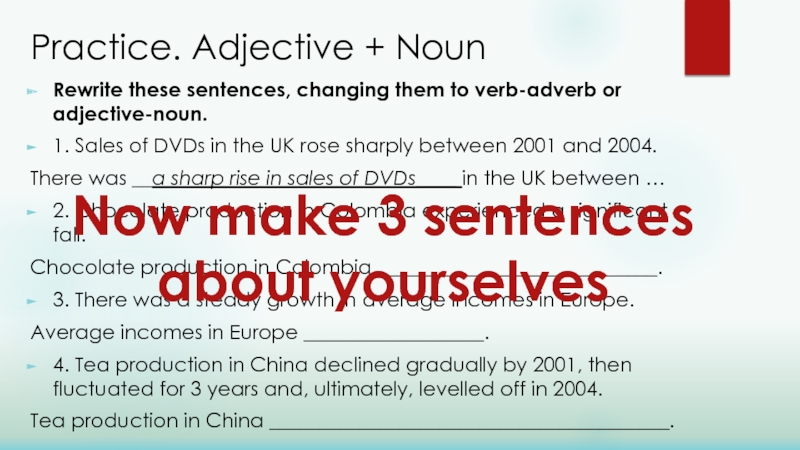
Rewrite these sentences, changing them to verb-adverb or
1. Sales of DVDs in the UK rose sharply between 2001 and 2004.
There was __a sharp rise in sales of DVDs____ in the UK between …
2. Chocolate production in Colombia experienced a significant fall.
Chocolate production in Colombia ____________________________.
3. There was a steady growth in average incomes in Europe.
Average incomes in Europe __________________.
4. Tea production in China declined gradually by 2001, then fluctuated for 3 years and, ultimately, levelled off in 2004.
Tea production in China ________________________________________.
Now make 3 sentences
about yourselves
Слайд 13Look at this task:
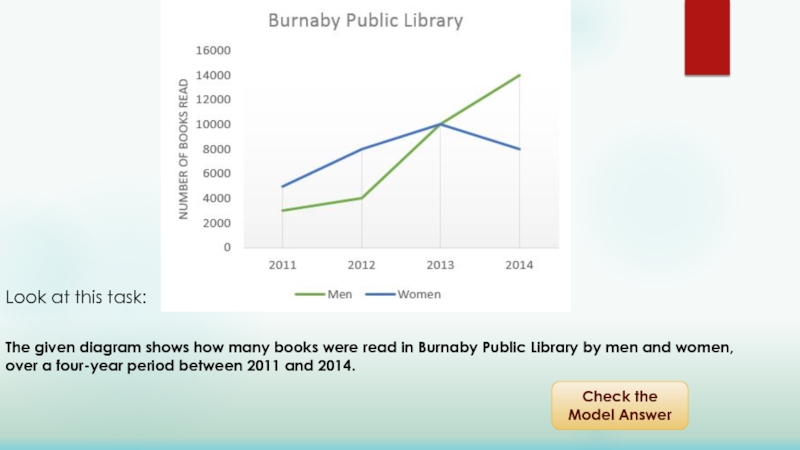
The given diagram shows how many books were
Check the Model Answer
Слайд 14Model Answer
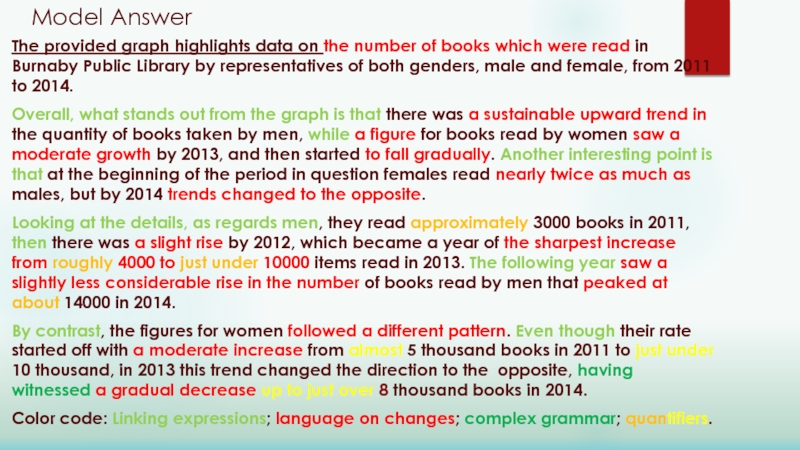
The provided graph highlights data on the number of books
Overall, what stands out from the graph is that there was a sustainable upward trend in the quantity of books taken by men, while a figure for books read by women saw a moderate growth by 2013, and then started to fall gradually. Another interesting point is that at the beginning of the period in question females read nearly twice as much as males, but by 2014 trends changed to the opposite.
Looking at the details, as regards men, they read approximately 3000 books in 2011, then there was a slight rise by 2012, which became a year of the sharpest increase from roughly 4000 to just under 10000 items read in 2013. The following year saw a slightly less considerable rise in the number of books read by men that peaked at about 14000 in 2014.
By contrast, the figures for women followed a different pattern. Even though their rate started off with a moderate increase from almost 5 thousand books in 2011 to just under 10 thousand, in 2013 this trend changed the direction to the opposite, having witnessed a gradual decrease up to just over 8 thousand books in 2014.
Color code: Linking expressions; language on changes; complex grammar; quantifiers.
Слайд 15Language use. Linking expressions
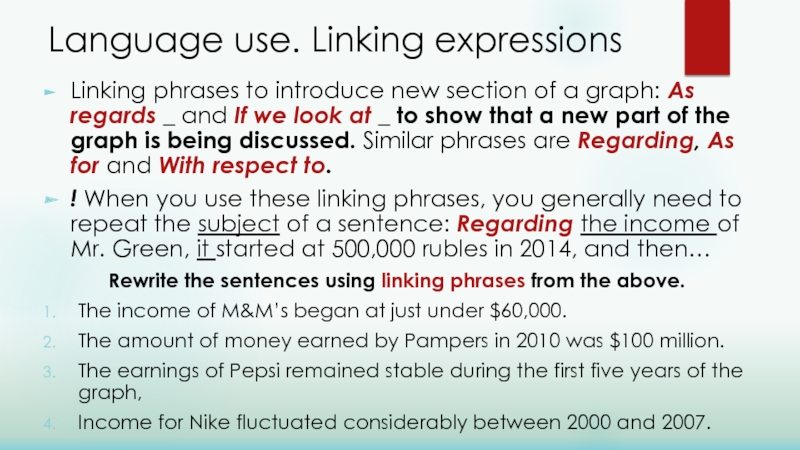
Linking phrases to introduce new section of a
! When you use these linking phrases, you generally need to repeat the subject of a sentence: Regarding the income of Mr. Green, it started at 500,000 rubles in 2014, and then…
Rewrite the sentences using linking phrases from the above.
The income of M&M’s began at just under $60,000.
The amount of money earned by Pampers in 2010 was $100 million.
The earnings of Pepsi remained stable during the first five years of the graph,
Income for Nike fluctuated considerably between 2000 and 2007.
Слайд 16Language use. Prepositions
Ss have a handout with the exercises (p. 86).
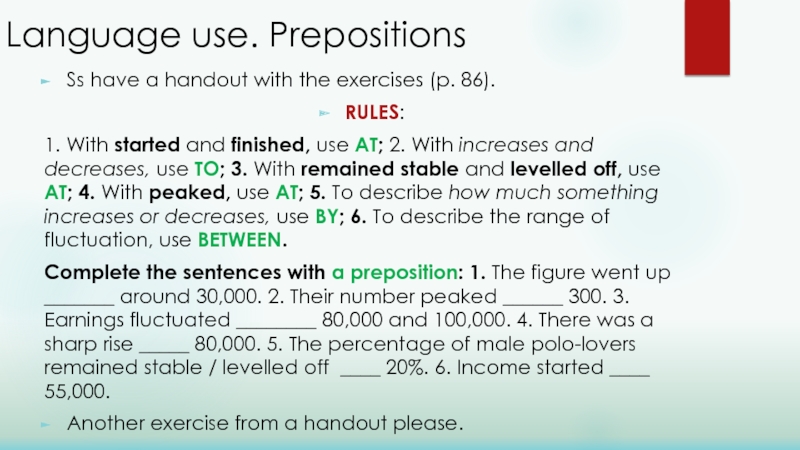
RULES:
1. With started and finished, use AT; 2. With increases and decreases, use TO; 3. With remained stable and levelled off, use AT; 4. With peaked, use AT; 5. To describe how much something increases or decreases, use BY; 6. To describe the range of fluctuation, use BETWEEN.
Complete the sentences with a preposition: 1. The figure went up _______ around 30,000. 2. Their number peaked ______ 300. 3. Earnings fluctuated ________ 80,000 and 100,000. 4. There was a sharp rise _____ 80,000. 5. The percentage of male polo-lovers remained stable / levelled off ____ 20%. 6. Income started ____ 55,000.
Another exercise from a handout please.
Слайд 17Comment on data
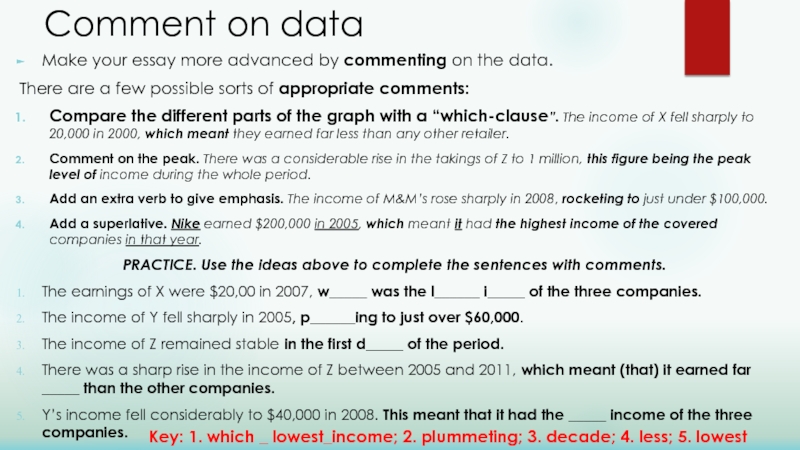
Make your essay more advanced by commenting on the
There are a few possible sorts of appropriate comments:
Compare the different parts of the graph with a “which-clause”. The income of X fell sharply to 20,000 in 2000, which meant they earned far less than any other retailer.
Comment on the peak. There was a considerable rise in the takings of Z to 1 million, this figure being the peak level of income during the whole period.
Add an extra verb to give emphasis. The income of M&M’s rose sharply in 2008, rocketing to just under $100,000.
Add a superlative. Nike earned $200,000 in 2005, which meant it had the highest income of the covered companies in that year.
PRACTICE. Use the ideas above to complete the sentences with comments.
The earnings of X were $20,00 in 2007, w_____ was the l______ i_____ of the three companies.
The income of Y fell sharply in 2005, p______ing to just over $60,000.
The income of Z remained stable in the first d_____ of the period.
There was a sharp rise in the income of Z between 2005 and 2011, which meant (that) it earned far _____ than the other companies.
Y’s income fell considerably to $40,000 in 2008. This meant that it had the _____ income of the three companies.
Key: 1. which _ lowest_income; 2. plummeting; 3. decade; 4. less; 5. lowest
Слайд 18More practice
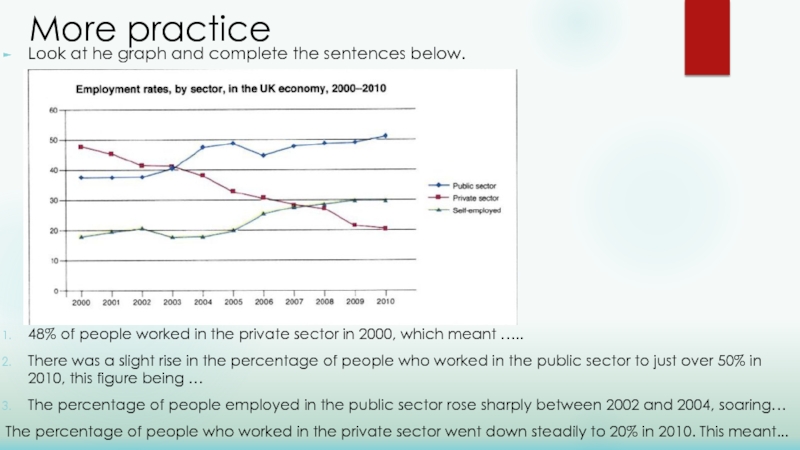
Look at he graph and complete the sentences below.
48% of
There was a slight rise in the percentage of people who worked in the public sector to just over 50% in 2010, this figure being …
The percentage of people employed in the public sector rose sharply between 2002 and 2004, soaring…
The percentage of people who worked in the private sector went down steadily to 20% in 2010. This meant...
Слайд 21But what if… the diagram shows a future trend?
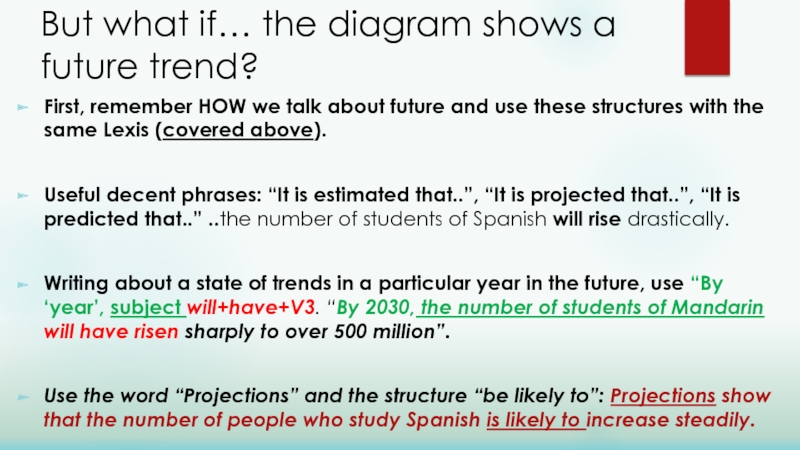
First, remember HOW
Useful decent phrases: “It is estimated that..”, “It is projected that..”, “It is predicted that..” ..the number of students of Spanish will rise drastically.
Writing about a state of trends in a particular year in the future, use “By ‘year’, subject will+have+V3. “By 2030, the number of students of Mandarin will have risen sharply to over 500 million”.
Use the word “Projections” and the structure “be likely to”: Projections show that the number of people who study Spanish is likely to increase steadily.
Слайд 23Feel like practicing?
Burnaby Public Library –
Employment rates in the UK
Travellers using British airports -
Visitors to museums –
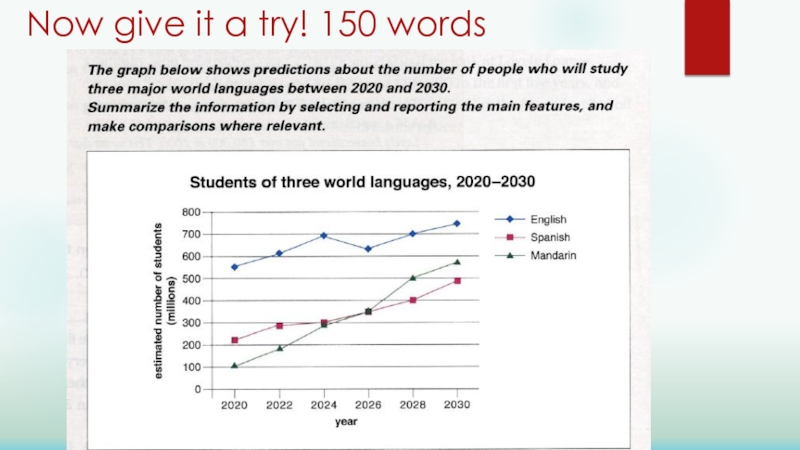
Studying languages in the future –
PRACTICE!
PRACTICE!
PRACTICE!
PRACTICE!
PRACTICE!
Слайд 24Thanks for attention if you still do have any questions left, approach
Resources:
“IELTS Advantage. Writing Skills” by R. Brown, L. Richards (https://drive.google.com/file/d/0B9bJPDOXJG9xSzZvSkJyZHJxYUU/view?usp=sharing)
Various Writing Tasks and exercises (http://www.ielts-exam.net/academic_writing_samples_task_1/)
More useful advice on describing Line Graphs: http://www.ielts-exam.net/ielts-preparation-tips/describe-a-line-graph.html

