- Главная
- Разное
- Дизайн
- Бизнес и предпринимательство
- Аналитика
- Образование
- Развлечения
- Красота и здоровье
- Финансы
- Государство
- Путешествия
- Спорт
- Недвижимость
- Армия
- Графика
- Культурология
- Еда и кулинария
- Лингвистика
- Английский язык
- Астрономия
- Алгебра
- Биология
- География
- Детские презентации
- Информатика
- История
- Литература
- Маркетинг
- Математика
- Медицина
- Менеджмент
- Музыка
- МХК
- Немецкий язык
- ОБЖ
- Обществознание
- Окружающий мир
- Педагогика
- Русский язык
- Технология
- Физика
- Философия
- Химия
- Шаблоны, картинки для презентаций
- Экология
- Экономика
- Юриспруденция
Data Science in the Real World: Making a Difference презентация
Содержание
- 1. Data Science in the Real World: Making a Difference
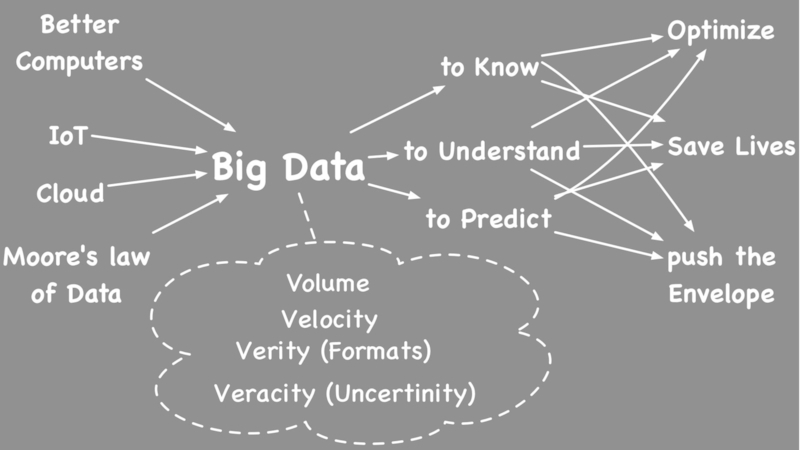
- 2. Outline Making sense of World’s Data
- 3. Michael Stonebraker “But then, out of nowhere,
- 4. Michael Stonebraker “But then, out of nowhere,
- 5. A Day in Your Life Think about
- 7. What can We do with Data? Optimize
- 8. Building Data Processing Systems
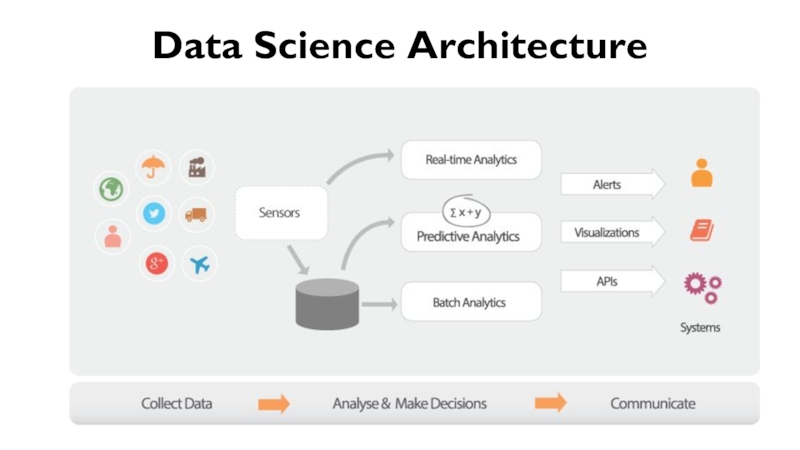
- 9. Data Science Architecture
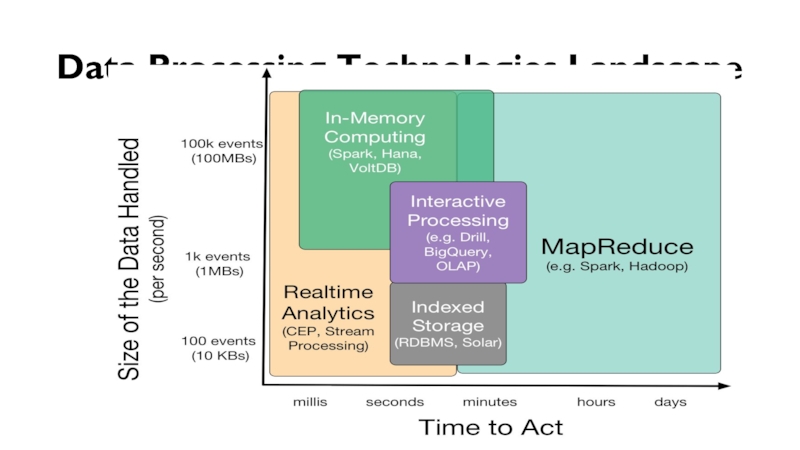
- 10. Data Processing Technologies Landscape
- 11. Batch Processing Store and process Slow
- 12. Usecase: Big Data for development Done using
- 13. Value of some Insights degrade Fast! For
- 14. Complex Event Processing
- 15. Predictive Analytics If we know how to
- 16. Usecase: Predictive Maintenance Idea is to fix
- 17. Communicate: Dashboards Idea is to given the
- 18. Communicate: Alerts and Triggers Detecting conditions can
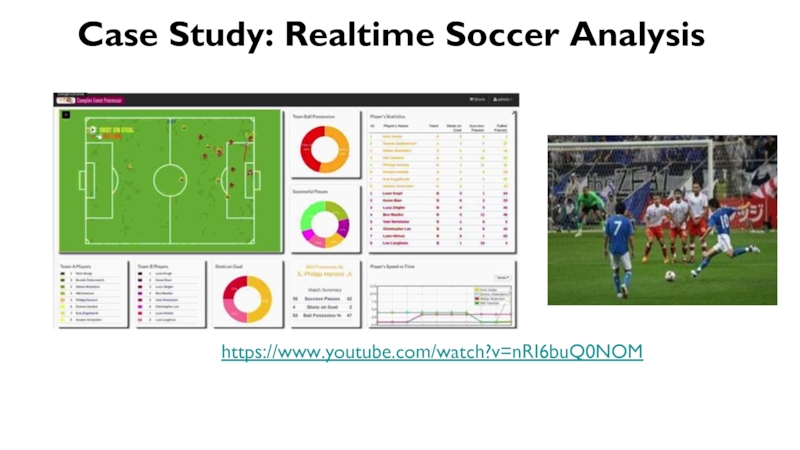
- 19. Case Study: Realtime Soccer Analysis Watch at: https://www.youtube.com/watch?v=nRI6buQ0NOM
- 20. Changing Dynamics
- 21. Large Observational Datasets Stats are easy with
- 22. “It is better to be roughly right
- 23. Challenges: Causality Correlation does not imply Causality!!
- 24. Curious Case of Missing Data http://www.fastcodesign.com/1671172/how-a-story-from-world-war-ii-shapes-facebook-today,
- 25. More Data Beat a Clever Algorithm Observed
- 26. Challenges: Feature Engineering In ML feature engineering
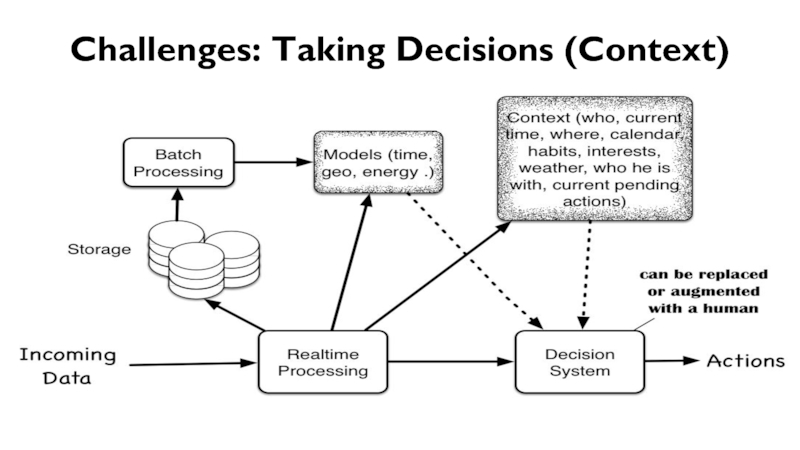
- 27. Challenges: Taking Decisions (Context)
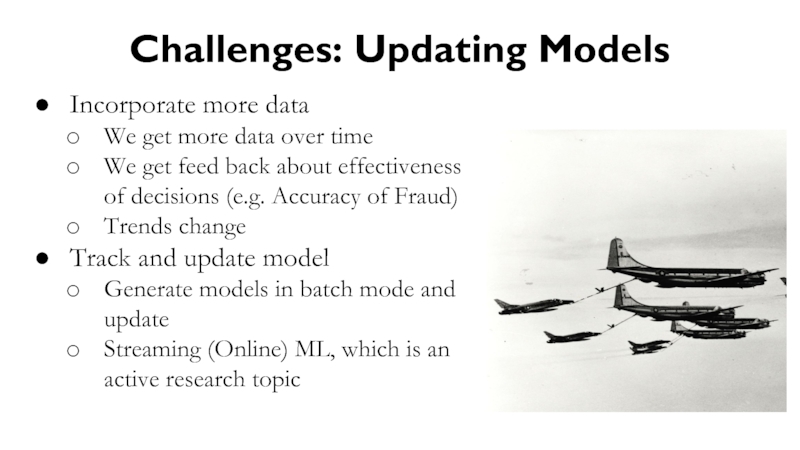
- 28. Challenges: Updating Models Incorporate more data
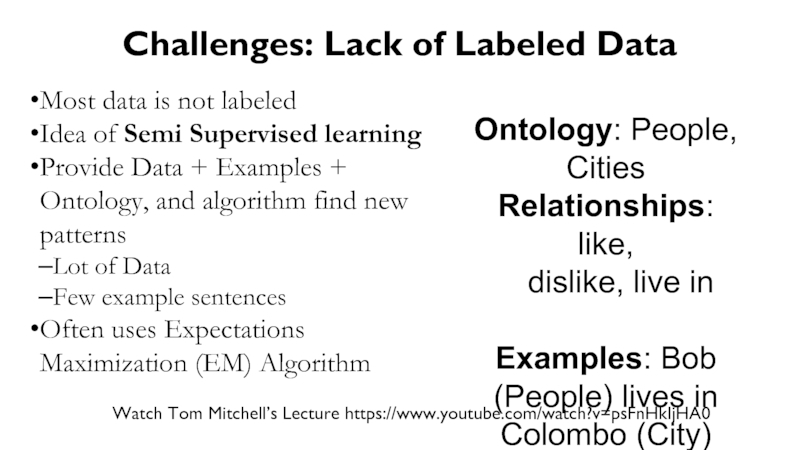
- 29. Challenges: Lack of Labeled Data Most data
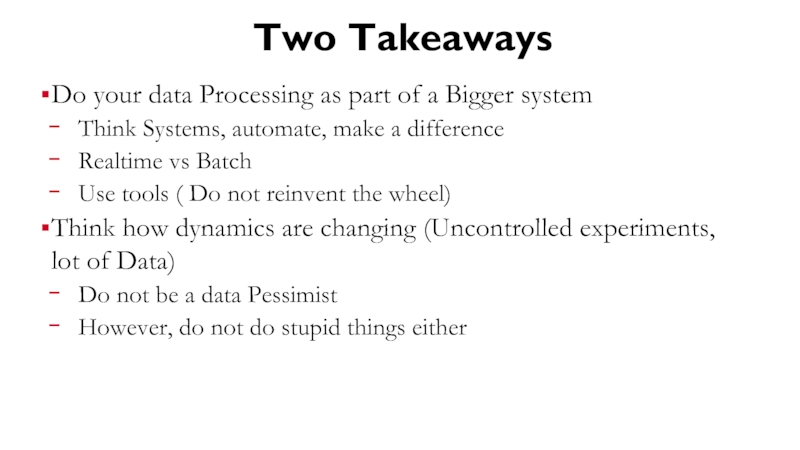
- 30. Two Takeaways Do your data Processing as
- 31. Questions?
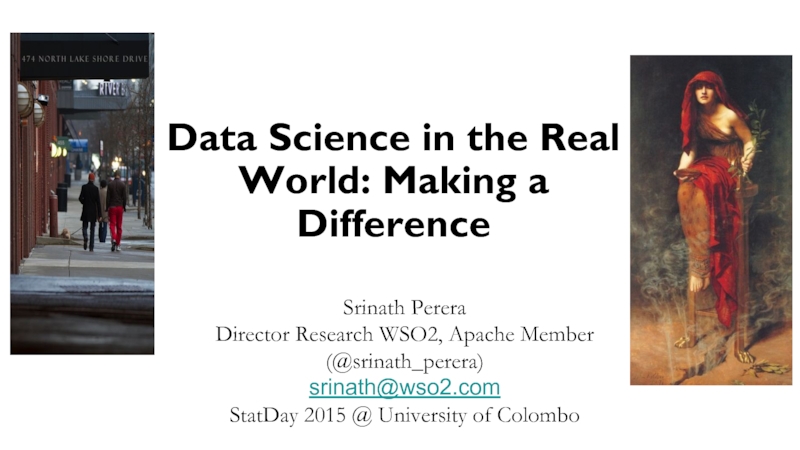
Слайд 1Data Science in the Real World: Making a Difference
Srinath Perera
Director
(@srinath_perera)
srinath@wso2.com
StatDay 2015 @ University of Colombo
Слайд 2Outline
Making sense of World’s Data
Building Data Systems
Changing Dynamics
Challenges and Open Problems
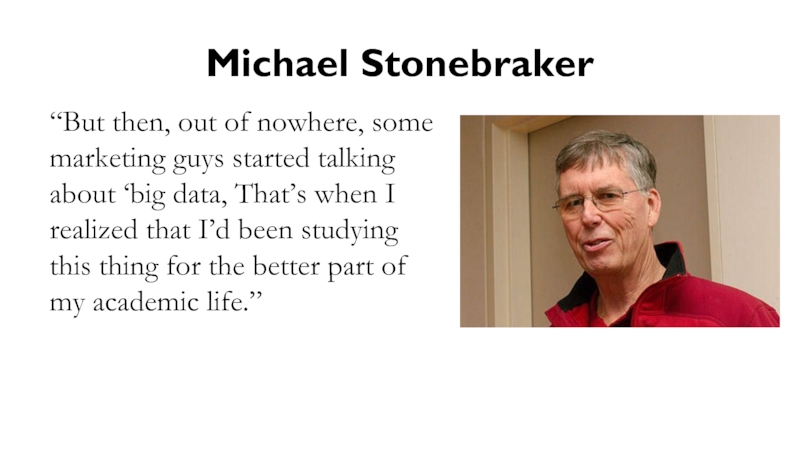
Слайд 3Michael Stonebraker
“But then, out of nowhere, some marketing guys started talking
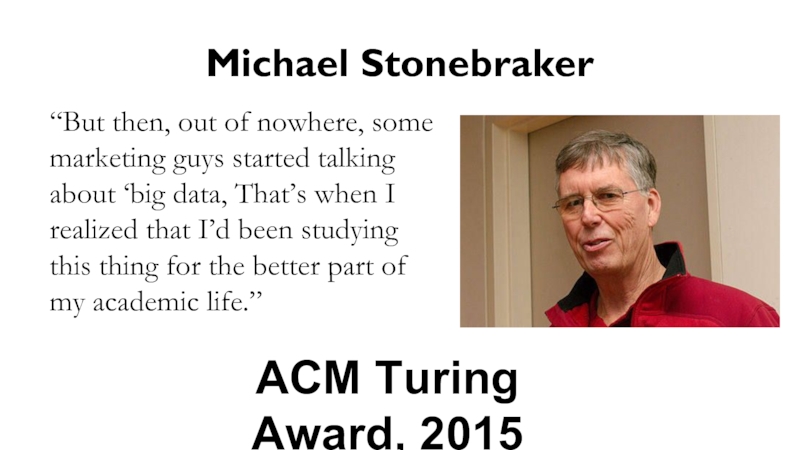
Слайд 4Michael Stonebraker
“But then, out of nowhere, some marketing guys started talking
ACM Turing Award, 2015
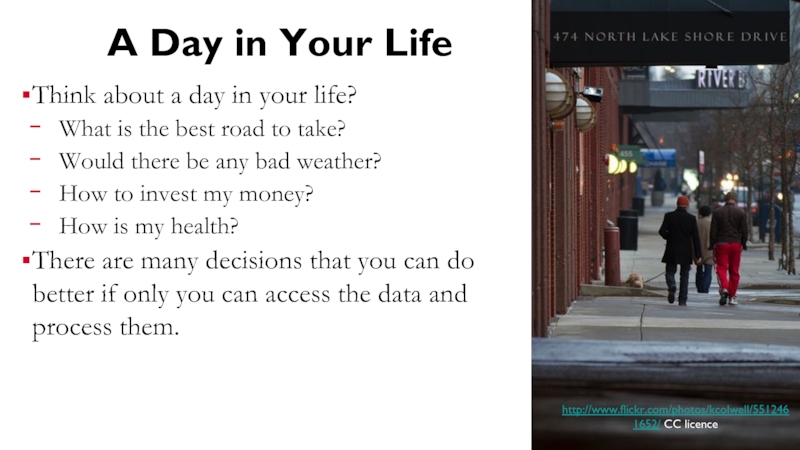
Слайд 5A Day in Your Life
Think about a day in your life?
What
Would there be any bad weather?
How to invest my money?
How is my health?
There are many decisions that you can do better if only you can access the data and process them.
http://www.flickr.com/photos/kcolwell/5512461652/ CC licence
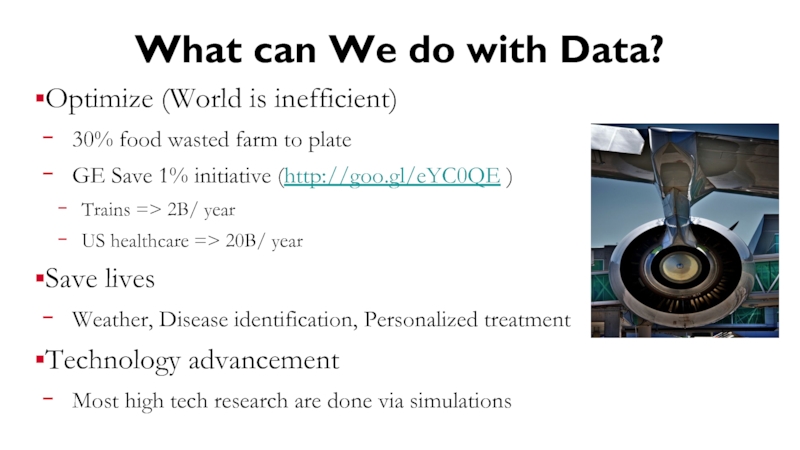
Слайд 7What can We do with Data?
Optimize (World is inefficient)
30% food wasted
GE Save 1% initiative (http://goo.gl/eYC0QE )
Trains => 2B/ year
US healthcare => 20B/ year
Save lives
Weather, Disease identification, Personalized treatment
Technology advancement
Most high tech research are done via simulations
Слайд 11Batch Processing
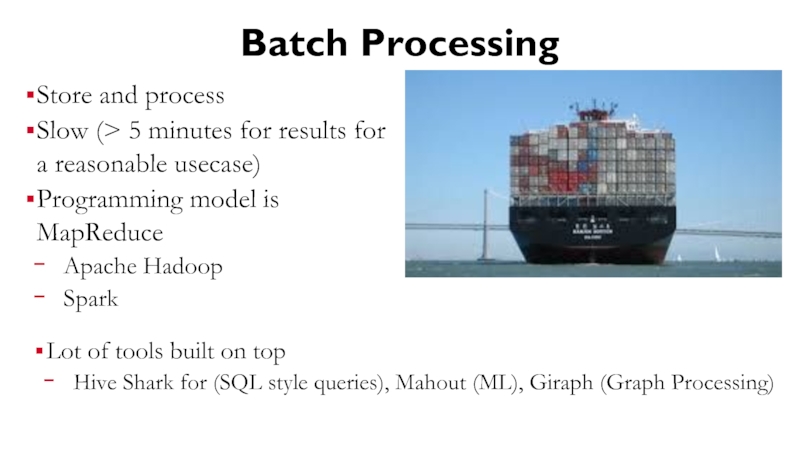
Store and process
Slow (> 5 minutes for results for
Programming model is MapReduce
Apache Hadoop
Spark
Lot of tools built on top
Hive Shark for (SQL style queries), Mahout (ML), Giraph (Graph Processing)
Слайд 12Usecase: Big Data for development
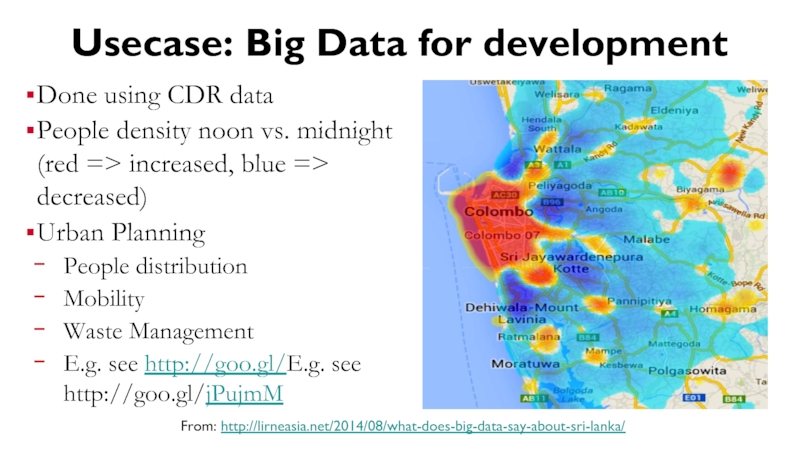
Done using CDR data
People density noon vs.
Urban Planning
People distribution
Mobility
Waste Management
E.g. see http://goo.gl/E.g. see http://goo.gl/jPujmM
From: http://lirneasia.net/2014/08/what-does-big-data-say-about-sri-lanka/
Слайд 13Value of some Insights degrade Fast!
For some usecases ( e.g. stock
E.g. stock markets and speed of light
We need technology that can produce outputs fast
Static Queries, but need very fast output (Alerts, Realtime control)
Dynamic and Interactive Queries ( Data exploration)
Слайд 15Predictive Analytics
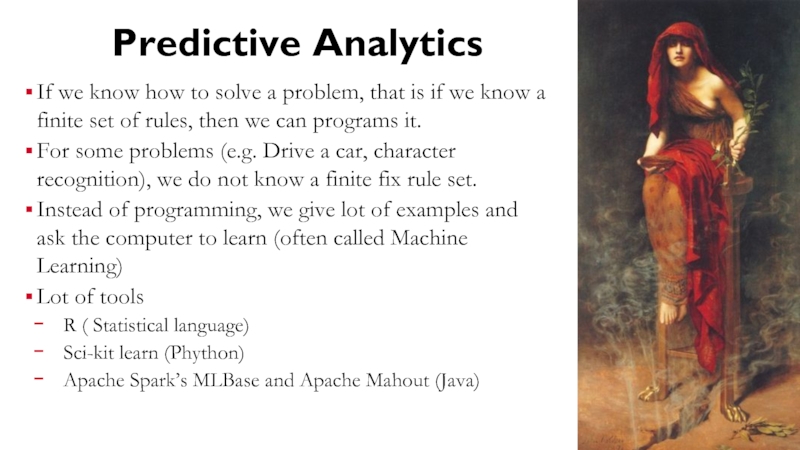
If we know how to solve a problem, that is
For some problems (e.g. Drive a car, character recognition), we do not know a finite fix rule set.
Instead of programming, we give lot of examples and ask the computer to learn (often called Machine Learning)
Lot of tools
R ( Statistical language)
Sci-kit learn (Phython)
Apache Spark’s MLBase and Apache Mahout (Java)
Слайд 16Usecase: Predictive Maintenance
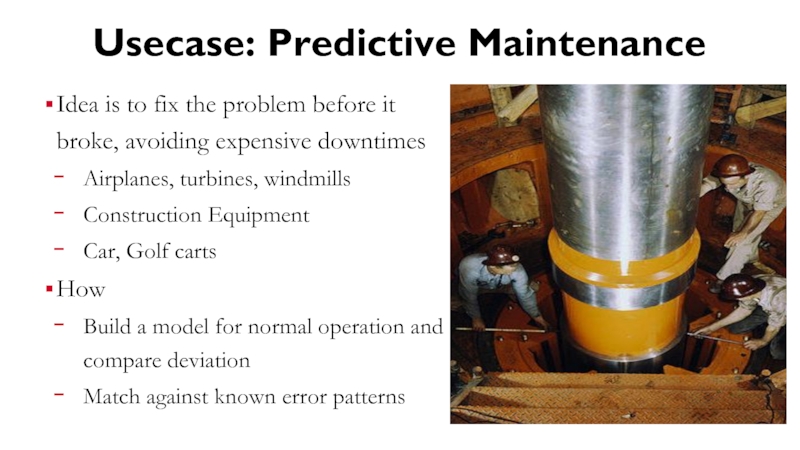
Idea is to fix the problem before it broke,
Airplanes, turbines, windmills
Construction Equipment
Car, Golf carts
How
Build a model for normal operation and compare deviation
Match against known error patterns
Слайд 17Communicate: Dashboards
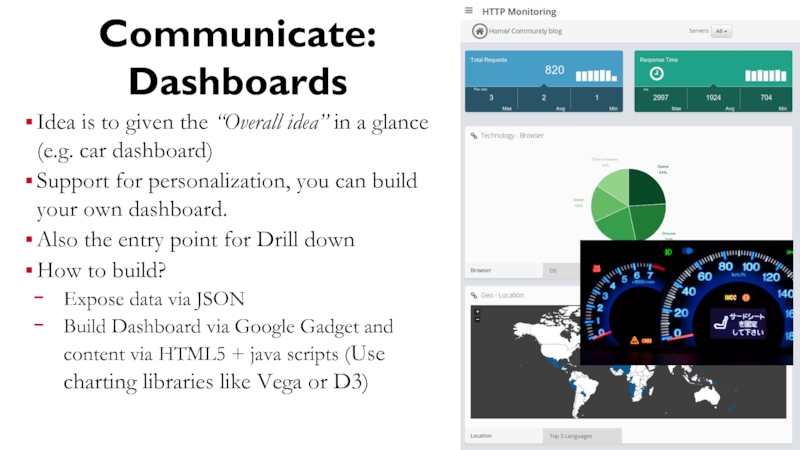
Idea is to given the “Overall idea” in a glance
Support for personalization, you can build your own dashboard.
Also the entry point for Drill down
How to build?
Expose data via JSON
Build Dashboard via Google Gadget and content via HTML5 + java scripts (Use charting libraries like Vega or D3)
Слайд 18Communicate: Alerts and Triggers
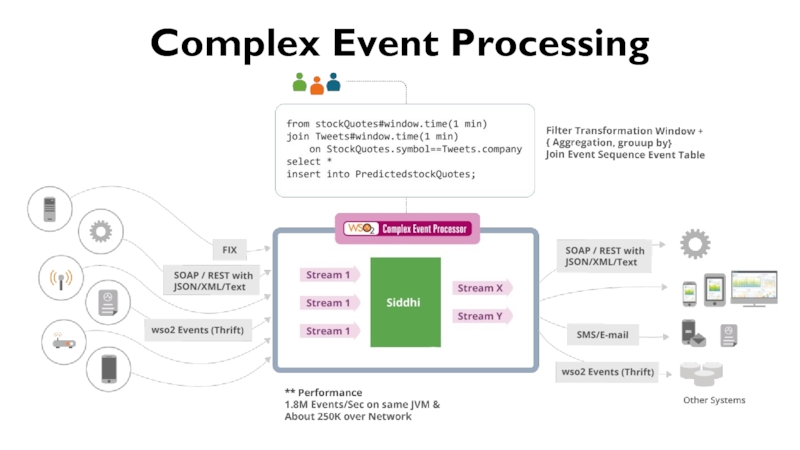
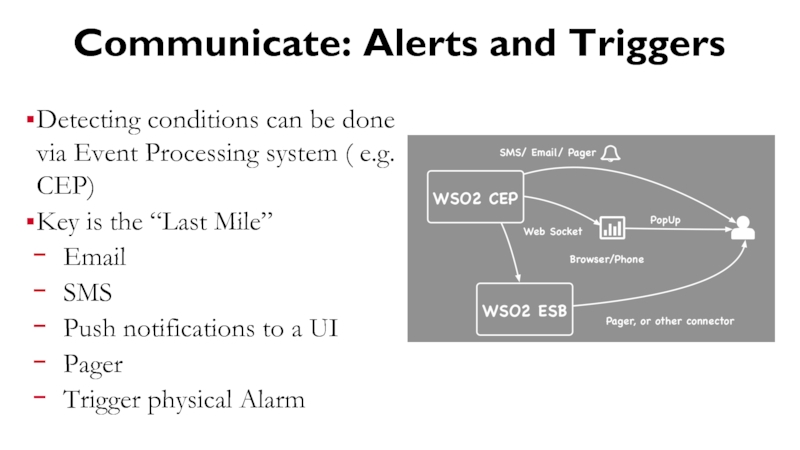
Detecting conditions can be done via Event Processing
Key is the “Last Mile”
SMS
Push notifications to a UI
Pager
Trigger physical Alarm
Слайд 21Large Observational Datasets
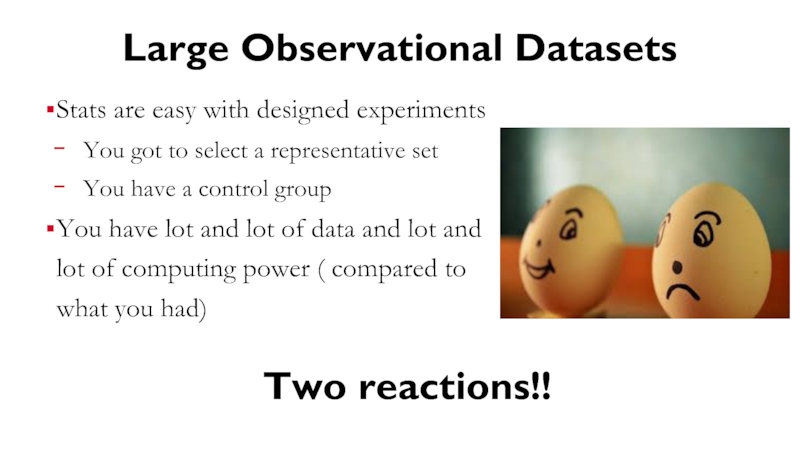
Stats are easy with designed experiments
You got to
You have a control group
You have lot and lot of data and lot and lot of computing power ( compared to what you had)
Two reactions!!
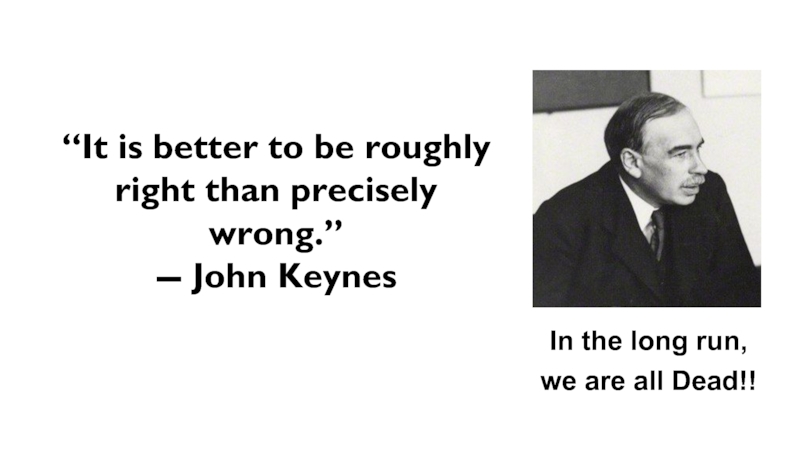
Слайд 22“It is better to be roughly right than precisely wrong.”
In the long run, we are all Dead!!
Слайд 23Challenges: Causality
Correlation does not imply Causality!! ( send a book home
Causality
do repeat experiment with identical test
If CAN’T do a randomized test (A/B test)
With Big data we cannot do either
Option 1: We can act on correlation if we can verify the guess or if correctness is not critical (Start Investigation, Check for a disease, Marketing )
Option 2: We verify correlations using A/B testing or propensity analysis
[1] http://www.freakonomics.com/2008/12/10/the-blagojevich-upside/
[2] https://hbr.org/2014/03/when-to-act-on-a-correlation-and-when-not-to/
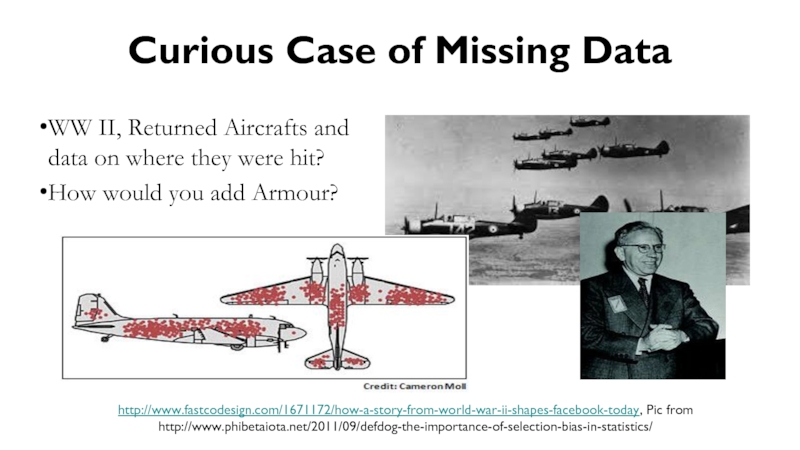
Слайд 24Curious Case of Missing Data
http://www.fastcodesign.com/1671172/how-a-story-from-world-war-ii-shapes-facebook-today, Pic from http://www.phibetaiota.net/2011/09/defdog-the-importance-of-selection-bias-in-statistics/
WW II, Returned
How would you add Armour?
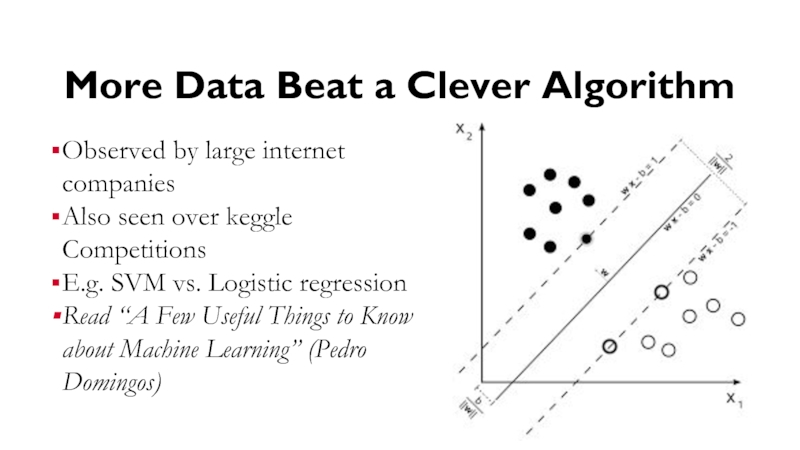
Слайд 25More Data Beat a Clever Algorithm
Observed by large internet companies
Also
E.g. SVM vs. Logistic regression
Read “A Few Useful Things to Know about Machine Learning” (Pedro Domingos)
Слайд 26Challenges: Feature Engineering
In ML feature engineering is the key [1].
You
Deep learning can learn best feature (combination) via semi or unsupervised learning [2]
Bekkerman’s talk https://www.youtube.com/watch?v=wjTJVhmu1JM
Deep Learning, http://cl.naist.jp/~kevinduh/a/deep2014/
Слайд 28Challenges: Updating Models
Incorporate more data
We get more data over time
We get feed back about effectiveness of decisions (e.g. Accuracy of Fraud)
Trends change
Track and update model
Generate models in batch mode and update
Streaming (Online) ML, which is an active research topic
Слайд 29Challenges: Lack of Labeled Data
Most data is not labeled
Idea of
Provide Data + Examples + Ontology, and algorithm find new patterns
Lot of Data
Few example sentences
Often uses Expectations Maximization (EM) Algorithm
Watch Tom Mitchell’s Lecture https://www.youtube.com/watch?v=psFnHkIjHA0
Ontology: People, Cities
Relationships: like,
dislike, live in
Examples: Bob (People) lives in Colombo (City)
Слайд 30Two Takeaways
Do your data Processing as part of a Bigger system
Think Systems, automate, make a difference
Realtime vs Batch
Use tools ( Do not reinvent the wheel)
Think how dynamics are changing (Uncontrolled experiments, lot of Data)
Do not be a data Pessimist
However, do not do stupid things either

![Challenges: CausalityCorrelation does not imply Causality!! ( send a book home example [1])Causality do repeat](/img/tmb/1/79822/8b9f76be25c1bbaf0a25b286744bcc5b-800x.jpg)
![Challenges: Feature EngineeringIn ML feature engineering is the key [1]. You need features to form](/img/tmb/1/79822/6a753a56340c237bdc57c5388b85c8ec-800x.jpg)
