- Главная
- Разное
- Дизайн
- Бизнес и предпринимательство
- Аналитика
- Образование
- Развлечения
- Красота и здоровье
- Финансы
- Государство
- Путешествия
- Спорт
- Недвижимость
- Армия
- Графика
- Культурология
- Еда и кулинария
- Лингвистика
- Английский язык
- Астрономия
- Алгебра
- Биология
- География
- Детские презентации
- Информатика
- История
- Литература
- Маркетинг
- Математика
- Медицина
- Менеджмент
- Музыка
- МХК
- Немецкий язык
- ОБЖ
- Обществознание
- Окружающий мир
- Педагогика
- Русский язык
- Технология
- Физика
- Философия
- Химия
- Шаблоны, картинки для презентаций
- Экология
- Экономика
- Юриспруденция
Data Visualization For Social Problems презентация
Содержание
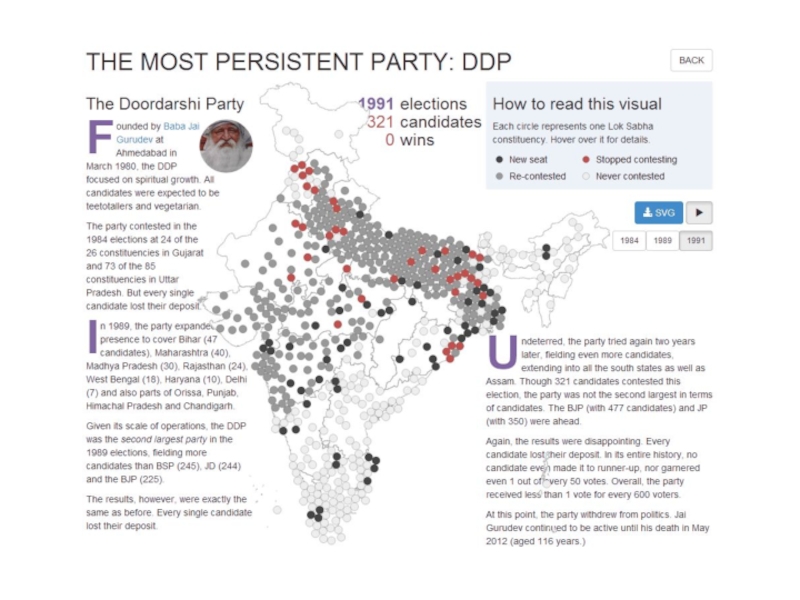
- 1. Data Visualization For Social Problems
- 4. Most discussions of decision-making assume that
- 5. SHOW me what is happening with the
- 6. SHOW me what is happening with the
- 10. SHOW me what is happening with the
- 11. EDUCATION PREDICTING MARKS What determines a child’s
- 12. TN Class X: English
- 13. TN Class X: Social Science
- 14. TN Class X: Mathematics
- 17. DETECTING FRAUD ENERGY UTILITY
- 18. This plot shows the frequency of all
- 19. SHOW me what is happening with the
- 20. SHOW me what is happening with the
- 22. Jain Harini Shweta Sneha Pooja Ashwin Shah
- 23. Based on the results
- 24. Let’s look at 15 years of US
- 25. The pattern in India is quite different
- 26. This adversely impacts children’s marks It’s a
- 27. # contestants Winner margin More contestants did
- 28. # contestants Runner-up margin More contestants did reduce the runner-up margin Karnataka, Assembly Elections 2004
- 29. Adult Education Adminisrative Reforms Agricultural Marketing
- 30. P.W.D. Health and family welfare Revenue Rural
- 31. SHOW me what is happening with the
- 32. SHOW me what is happening with the
- 37. https://gramener.com/aapdonations
- 40. EXPLORING THE MAHABHARATA How does Mahabharata, one
- 41. SHOW me what is happening with the
- 42. VISUALISATION IS IMPERATIVE FOR DATA → INSIGHTS
- 43. We handle terabyte-size data via non-traditional analytics


Слайд 4
Most discussions of decision-making assume that only senior executives make decisions
Peter F Drucker
Data generation and analysis are not sufficient.
Consuming it as a team and acting in cohesion is.

Слайд 5SHOW
me what is happening with the data
EXPLAIN
to me why it’s happening
Allow
EXPLORE
and figure it out
Just
EXPOSE
the data to me
Low effort
High effort
High effort
Low effort
Creator
Consumer
There are many ways to aid data consumption

Слайд 6SHOW
me what is happening with the data
EXPLAIN
to me why it’s happening
Allow
EXPLORE
and figure it out
Just
EXPOSE
the data to me

Слайд 10SHOW
me what is happening with the data
EXPLAIN
to me why it’s happening
Allow
EXPLORE
and figure it out
Just
EXPOSE
the data to me

Слайд 11EDUCATION
PREDICTING MARKS
What determines a child’s marks?
Do girls score better than boys?
Does
Does the medium of instruction matter?
Does community or religion matter?
Does their birthday matter?
Does the first letter of their name matter?


Слайд 18This plot shows the frequency of all meter readings from Apr-2010
This clearly shows collusion of some form with the customers.
This happens with specific customers, not randomly. Here are such customers’ meter readings.
If we define the “extent of fraud” as the percentage excess of the 100 unit
meter reading, the value varies considerably across sections, and time
New section manager arrives
… and is transferred out
… with some explainable anomalies.
Why would these happen?

Слайд 19SHOW
me what is happening with the data
EXPLAIN
to me why it’s happening
Allow
EXPLORE
and figure it out
Just
EXPOSE
the data to me
… to inform and to entertain

Слайд 20SHOW
me what is happening with the data
EXPLAIN
to me why it’s happening
Allow
EXPLORE
and figure it out
Just
EXPOSE
the data to me

Слайд 22Jain
Harini
Shweta
Sneha
Pooja
Ashwin
Shah
Deepti
Sanjana
Varshini
Ezhumalai
Venkatesan
Silambarasan
Pandiyan
Kumaresan
Manikandan
Thirupathi
Agarwal
Kumar
Priya

Слайд 23
Based on the results of the 20 lakh students taking the
June borns score the lowest
The marks shoot up for Aug borns
… and peaks for Sep-borns
120 marks out of 1200 explainable by month of birth
An identical pattern was observed in 2009 and 2010…
… and across districts, gender, subjects, and class X & XII.
“It’s simply that in Canada the eligibility cutoff for age-class hockey is January 1. A boy who turns ten on January 2, then, could be playing alongside someone who doesn’t turn ten until the end of the year—and at that age, in preadolescence, a twelve-month gap in age represents an enormous difference in physical maturity.”
-- Malcolm Gladwell, Outliers

Слайд 24Let’s look at 15 years of US Birth Data
This is a
For example,
Are birthdays uniformly distributed?
Do doctors or parents exercise the C-section option to move dates?
Is there any day of the month that has unusually high or low births?
Are there any months with relatively high or low births?
Very high births in September. But this is fairly well known. Most conceptions happen during the winter holiday season
Relatively few births during the Christmas and Thanksgiving holidays, as well as New Year and Independence Day.
Most people prefer not to have children on the 13th of any month, given that it’s an unlucky day
Some special days like April Fool’s day are avoided, but Valentine’s Day is quite popular
More births
Fewer births
… on average, for each day of the year (from 1975 to 1990)
")
Слайд 25The pattern in India is quite different
This is a birth date
For example,
Is there an aversion to the 13th or is there a local cultural nuance?
Are holidays avoided for births?
Which months have a higher propensity for births, and why?
Are there any patterns not found in the US data?
Very few children are born in the month of August, and thereafter. Most births are concentrated in the first half of the year
We see a large number of children born on the 5th, 10th, 15th, 20th and 25th of each month – that is, round numbered dates
Such round numbered patterns a typical indication of fraud. Here, birthdates are brought forward to aid early school admission
More births
Fewer births
… on average, for each day of the year (from 2007 to 2013)

Слайд 26This adversely impacts children’s marks
It’s a well established fact that older
The average marks of children “born” on the 1st, 5th, 10th, 15th etc. of the month tend to score lower marks.
Are holidays avoided for births?
Which months have a higher propensity for births, and why?
Are there any patterns not found in the US data?
Higher marks
Lower marks
… on average, for children born on a given day of the year (from 2007 to 2013)
Children “born” on round numbered days score lower marks on average,
due to a higher proportion of younger children

Слайд 27# contestants
Winner margin
More contestants did not reduce the winner margin
Karnataka, Assembly

Слайд 28# contestants
Runner-up margin
More contestants did reduce the runner-up margin
Karnataka, Assembly Elections

Слайд 29
Adult Education
Adminisrative Reforms
Agricultural Marketing
Agriculture
Animal Husbandry
Cooperative
Excise
Finance
Fisheries
Fisheries & Inland water transport
Food & Civil
Forest
Fuel
Haz & Wakf
Health and family welfare
Higher Education
Home
Horticulture
Housing
Information & Technology
Kannada & Culture
Labour
Law & Human Rights
Major & Medium Industries
Medical Education
Medium and Large Industries
Mines & Geology
Minor Irrigation
Muzrai
P.W.D.
Parliamentary Affairs and Human Rights
Planning
Planning and Statistics
Primary and Secondary Education
Primary Education
Prison
Public Library
Revenue
Rural Development and Panchayat Raj
Rural Water Supply
Rural Water Supply and Sanitation
Sericulture
Small Scale Industries
Small Industries
Social Welfare
Sugar
Textile
Tourism
Transport
Transportation
Urban Development
Water Resources
Woman & Child Development
Youth and Sports
Youth Service & Sports
BJP focus
JD(S)
focus
INC focus
What topics did parties focus on during questions?
Karnataka, 2008-2012

Слайд 30P.W.D.
Health and family welfare
Revenue
Rural Development and Panchayat Raj
Social Welfare
Urban Development
Water Resources
Minor
Fuel
Housing
Agriculture
Primary Education
Primary and Secondary Education
Woman & Child Development
Higher Education
Home
Cooperative
Forest
Adminisrative Reforms
Labour
Food & Civil Supplies
Tourism
Finance
Animal Husbandry
Transportation
Horticulture
Muzrai
Haz & Wakf
Transport
Medical Education
Medium and Large Industries
Excise
Major & Medium Industries
Kannada & Culture
Textile
Fisheries
Parliamentary Affairs and Human Rights
Adult Education
Rural Water Supply and Sanitation
Mines & Geology
Small Industries
Youth and Sports
Sugar
Planning and Statistics
Agricultural Marketing
Rural Water Supply
Fisheries & Inland water transport
Small Scale Industries
Youth Service & Sports
Sericulture
Law & Human Rights
Prison
Planning
Information & Technology
Public Library
What topics did the young & old focus on during questions?
Karnataka, 2008-2012
Young
Old

Слайд 31SHOW
me what is happening with the data
EXPLAIN
to me why it’s happening
Allow
EXPLORE
and figure it out
Just
EXPOSE
the data to me
… to connect the dots for your readers

Слайд 32SHOW
me what is happening with the data
EXPLAIN
to me why it’s happening
Allow
EXPLORE
and figure it out
Just
EXPOSE
the data to me


Слайд 40EXPLORING THE MAHABHARATA
How does Mahabharata, one of the largest epics with
Can this ‘unstructured data’ be processed to extract analytical insights?
What does sentiment analysis of this tome convey?
Is there a better way to explore relations between characters?
How can closeness of characters be analysed & visualized?

Слайд 41SHOW
me what is happening with the data
EXPLAIN
to me why it’s happening
Allow
EXPLORE
and figure it out
Just
EXPOSE
the data to me
… to allow your users to tell stories

Слайд 42VISUALISATION IS IMPERATIVE FOR
DATA → INSIGHTS → ACTION
Spot the unusual
Communicate patterns
Simplify

Слайд 43We handle terabyte-size data
via non-traditional analytics
and visualise it in real-time.
A data
gramener.com
for more examples