- Главная
- Разное
- Дизайн
- Бизнес и предпринимательство
- Аналитика
- Образование
- Развлечения
- Красота и здоровье
- Финансы
- Государство
- Путешествия
- Спорт
- Недвижимость
- Армия
- Графика
- Культурология
- Еда и кулинария
- Лингвистика
- Английский язык
- Астрономия
- Алгебра
- Биология
- География
- Детские презентации
- Информатика
- История
- Литература
- Маркетинг
- Математика
- Медицина
- Менеджмент
- Музыка
- МХК
- Немецкий язык
- ОБЖ
- Обществознание
- Окружающий мир
- Педагогика
- Русский язык
- Технология
- Физика
- Философия
- Химия
- Шаблоны, картинки для презентаций
- Экология
- Экономика
- Юриспруденция
xjCharts презентация
Содержание
- 1. xjCharts
- 2. © 1999 Experimental Object Technologies www.xjtek.com What
- 3. © 1999 Experimental Object Technologies www.xjtek.com When
- 4. © 1999 Experimental Object Technologies www.xjtek.com Existing
- 5. © 1999 Experimental Object Technologies www.xjtek.com When
- 6. © 1999 Experimental Object Technologies www.xjtek.com How Do Developers Use xjCharts? ?
- 7. © 1999 Experimental Object Technologies www.xjtek.com xjCharts
- 8. © 1999 Experimental Object Technologies www.xjtek.com Code
- 9. © 1999 Experimental Object Technologies www.xjtek.com xjCharts
- 10. © 1999 Experimental Object Technologies www.xjtek.com Target
- 11. © 1999 Experimental Object Technologies www.xjtek.com Visual
- 12. © 1999 Experimental Object Technologies www.xjtek.com Attributes
- 13. © 1999 Experimental Object Technologies www.xjtek.com UML
- 14. © 1999 Experimental Object Technologies www.xjtek.com Summary
Слайд 1xjCharts
A C++ / Java Statecharts Tool
for Developers
Experimental Object Technologies
www.xjtek.com
Слайд 2© 1999 Experimental Object Technologies www.xjtek.com
What is xjCharts?
A tool for developers
of event-driven software
A graphical Editor that creates and handles statechart objects in C++ or Java code
A runtime Engine that executes your statecharts according to UML semantics
Editor is easy to use
Engine is fast
A graphical Editor that creates and handles statechart objects in C++ or Java code
A runtime Engine that executes your statecharts according to UML semantics
Editor is easy to use
Engine is fast
Слайд 3© 1999 Experimental Object Technologies www.xjtek.com
When Do You Need a Statechart?
During
its execution, a program performs operations in response to the external or internal events and conditions
Sometimes, this event and time ordering of operations is so pervasive that we can best formally characterize the behavior of such programs in terms of a statechart
David Harel
Sometimes, this event and time ordering of operations is so pervasive that we can best formally characterize the behavior of such programs in terms of a statechart
David Harel
Слайд 4© 1999 Experimental Object Technologies www.xjtek.com
Existing Statecharts Tools
There are other tools
on the market:
iLogix Statemate
Rational Rose
ObjecTime Developer
ISI BetterState
They are heavyweight environments that force developer to learn a lot, to follow certain design templates, to use project files, etc
Poor integration with other tools developers use
iLogix Statemate
Rational Rose
ObjecTime Developer
ISI BetterState
They are heavyweight environments that force developer to learn a lot, to follow certain design templates, to use project files, etc
Poor integration with other tools developers use
Слайд 5© 1999 Experimental Object Technologies www.xjtek.com
When Do Developers Use xjCharts?
Developers realize
that a component of the system is event-driven
They want to stay with their favorite development environment and rapidly insert a statechart into an existing project
They want the statechart to work fast, with minimum overhead
They do not want to learn a new environment
They want to stay with their favorite development environment and rapidly insert a statechart into an existing project
They want the statechart to work fast, with minimum overhead
They do not want to learn a new environment
Слайд 7© 1999 Experimental Object Technologies www.xjtek.com
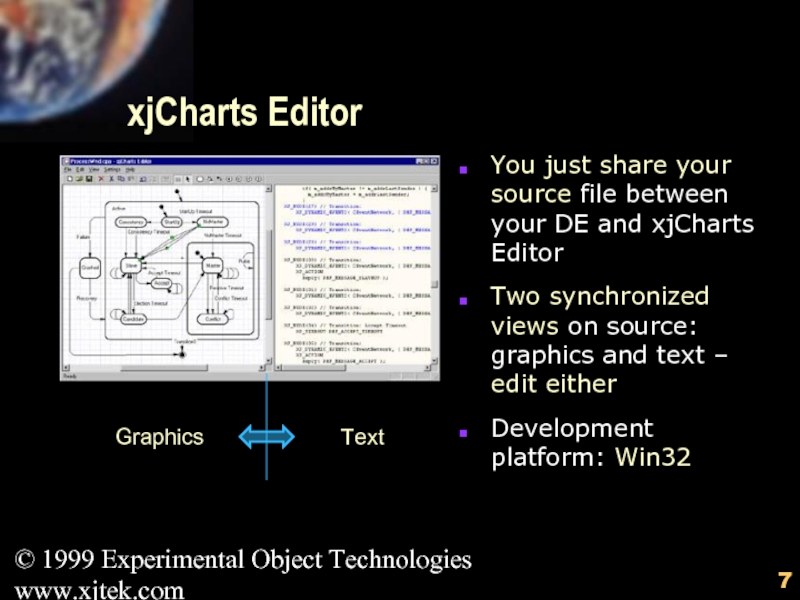
xjCharts Editor
You just share your source
file between your DE and xjCharts Editor
Two synchronized views on source: graphics and text – edit either
Development platform: Win32
Two synchronized views on source: graphics and text – edit either
Development platform: Win32
Слайд 8© 1999 Experimental Object Technologies www.xjtek.com
Code Generation
xjCharts generates C++ or Java
1.1
Everything is generated while you draw
The complete information about the statechart is stored in the source file – no extra files needed
Everything is generated while you draw
The complete information about the statechart is stored in the source file – no extra files needed
Слайд 9© 1999 Experimental Object Technologies www.xjtek.com
xjCharts Engine
Executes your statechart.
Provides UML semantics
Is
fast: up to 500,000 events per second on Intel Pentium II 450 MHz
Is a library compiled for each target platform
Source may be licensed
Is a library compiled for each target platform
Source may be licensed
Слайд 10© 1999 Experimental Object Technologies www.xjtek.com
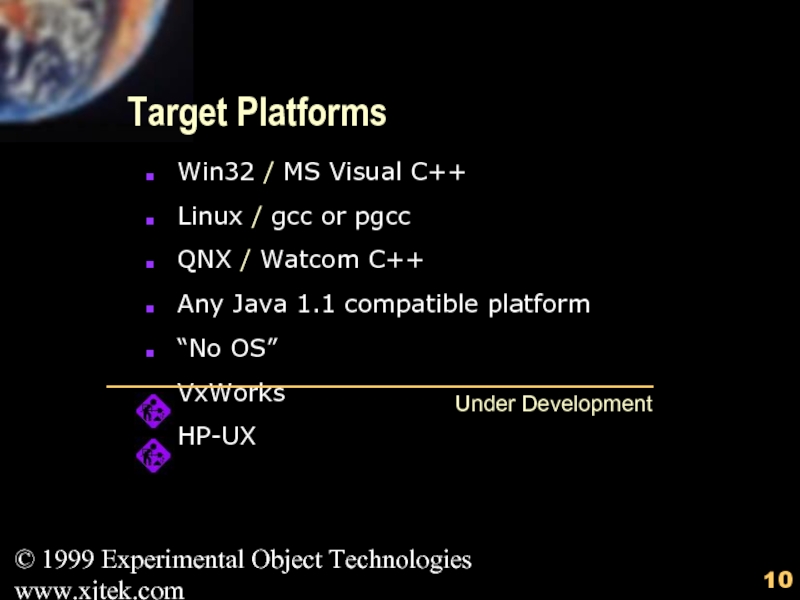
Target Platforms
Win32 / MS Visual C++
Linux
/ gcc or pgcc
QNX / Watcom C++
Any Java 1.1 compatible platform
“No OS”
VxWorks
HP-UX
QNX / Watcom C++
Any Java 1.1 compatible platform
“No OS”
VxWorks
HP-UX
Under Development
Слайд 11© 1999 Experimental Object Technologies www.xjtek.com
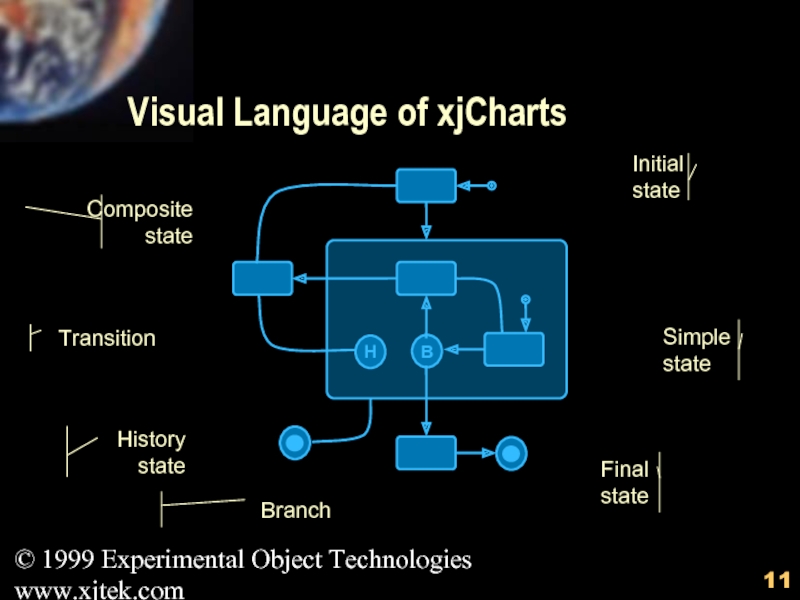
Visual Language of xjCharts
Composite state
History state
Branch
Initial
state
Simple state
Final state
Transition
Слайд 12© 1999 Experimental Object Technologies www.xjtek.com
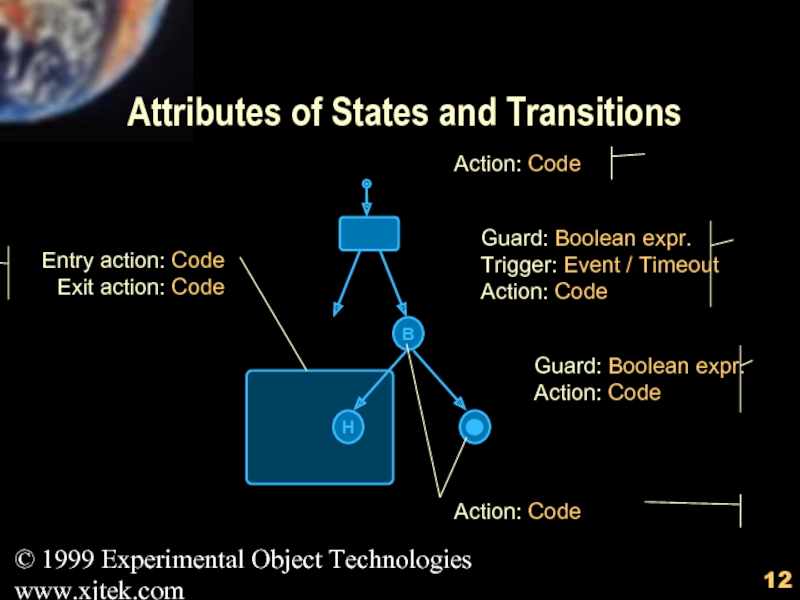
Attributes of States and Transitions
Action: Code
Guard:
Boolean expr.
Trigger: Event / Timeout
Action: Code
Action: Code
Guard: Boolean expr.
Action: Code
Слайд 13© 1999 Experimental Object Technologies www.xjtek.com
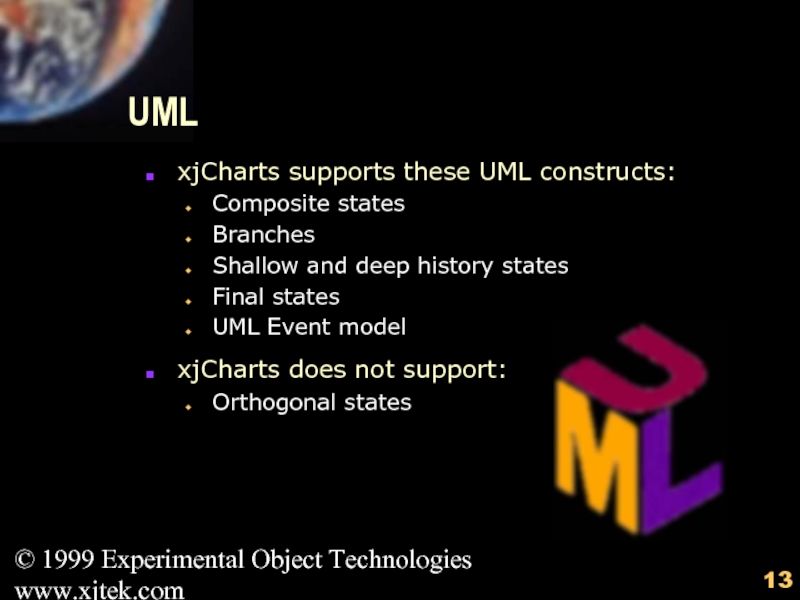
UML
xjCharts supports these UML constructs:
Composite states
Branches
Shallow
and deep history states
Final states
UML Event model
xjCharts does not support:
Orthogonal states
Final states
UML Event model
xjCharts does not support:
Orthogonal states
Слайд 14© 1999 Experimental Object Technologies www.xjtek.com
Summary
xjCharts Editor creates and handles statecharts
in your source code
C++ and Java generated while you draw
Development platform: Win32
Target: Win32, Linux, QNX, Java, “no OS”
Fast Engine: 500,000 eps on PII 450
Platform-independent event model
UML syntax and semantics
C++ and Java generated while you draw
Development platform: Win32
Target: Win32, Linux, QNX, Java, “no OS”
Fast Engine: 500,000 eps on PII 450
Platform-independent event model
UML syntax and semantics
