President, Snowflake Llc
- Главная
- Разное
- Дизайн
- Бизнес и предпринимательство
- Аналитика
- Образование
- Развлечения
- Красота и здоровье
- Финансы
- Государство
- Путешествия
- Спорт
- Недвижимость
- Армия
- Графика
- Культурология
- Еда и кулинария
- Лингвистика
- Английский язык
- Астрономия
- Алгебра
- Биология
- География
- Детские презентации
- Информатика
- История
- Литература
- Маркетинг
- Математика
- Медицина
- Менеджмент
- Музыка
- МХК
- Немецкий язык
- ОБЖ
- Обществознание
- Окружающий мир
- Педагогика
- Русский язык
- Технология
- Физика
- Философия
- Химия
- Шаблоны, картинки для презентаций
- Экология
- Экономика
- Юриспруденция
We Got One! How to Measure How Well You’re Hiring презентация
Содержание
- 1. We Got One! How to Measure How Well You’re Hiring
- 2. Today’s Content Leader Tom Morley President, Snowflake
- 3. The “right” people A Simple Workforce
- 4. Did We Get This One Right? Measuring
- 5. Is the individual “right”?
- 6. Readiness Is the employee prepared to contribute
- 7. Readiness Requirements tracking – “Did he/she get
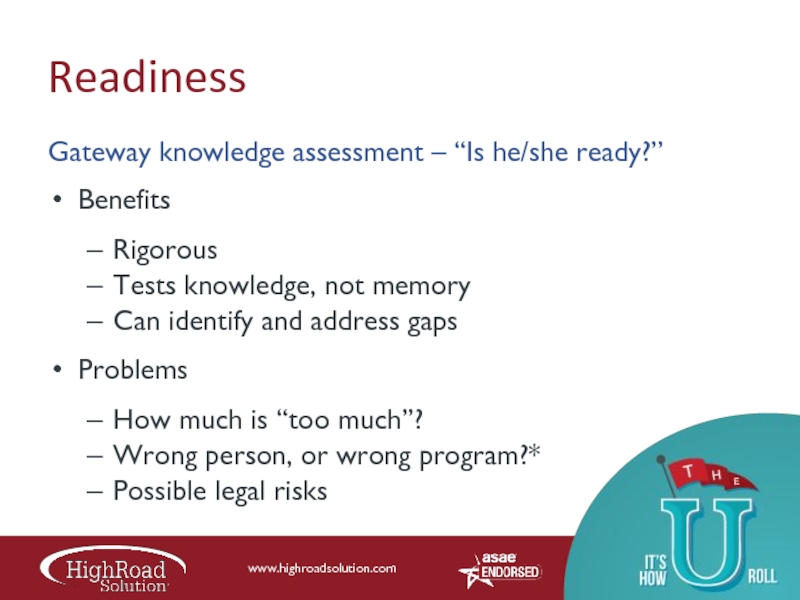
- 8. Readiness Gateway knowledge assessment – “Is he/she
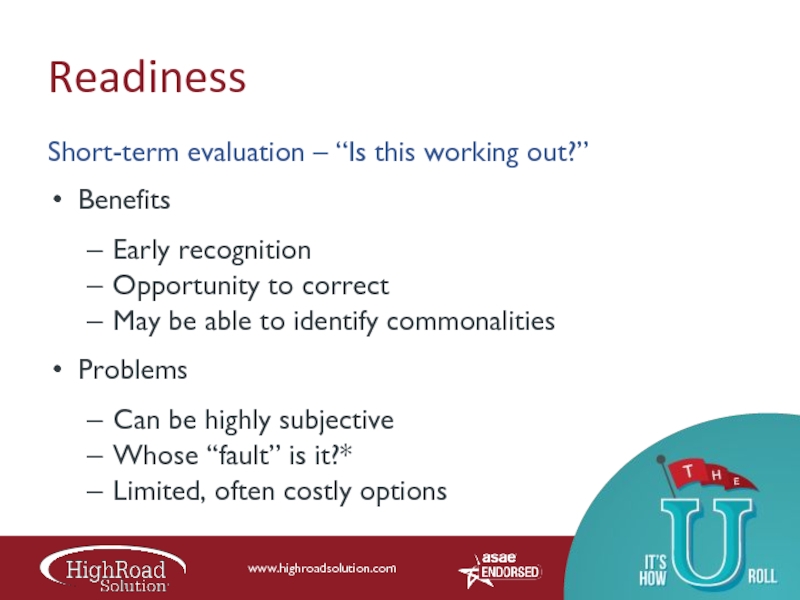
- 9. Readiness Short-term evaluation – “Is this working
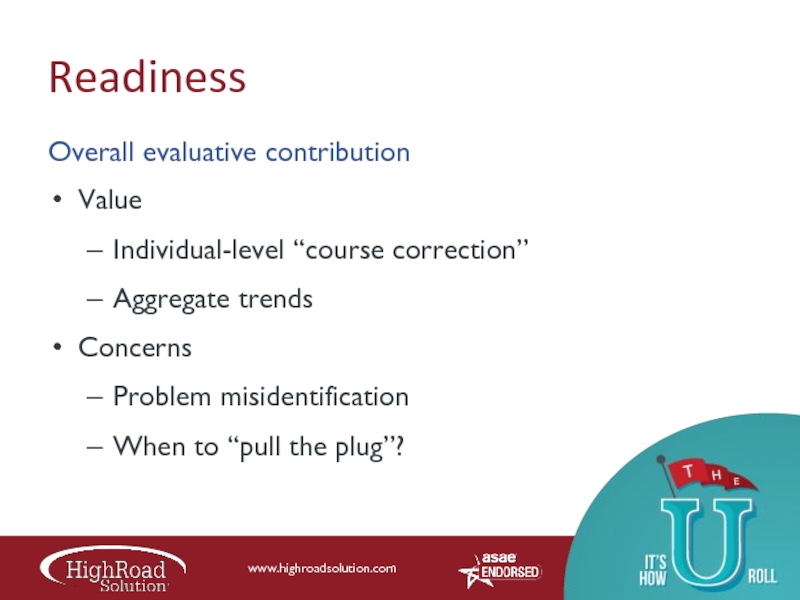
- 10. Readiness Overall evaluative contribution Value Individual-level “course
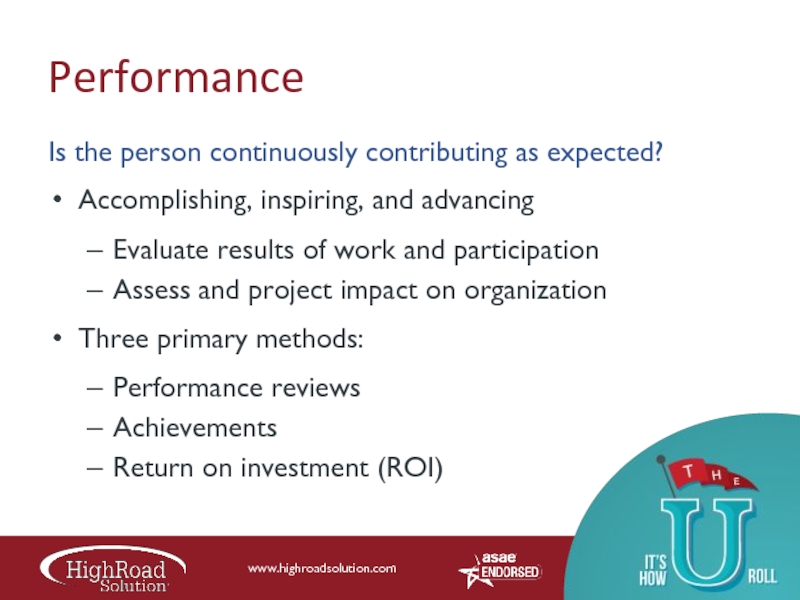
- 11. Performance Is the person continuously contributing as
- 12. Performance Reviews – “Is he/she having the
- 13. Performance Reviews – “Is he/she having the
- 14. Performance Reviews – “Is he/she having the
- 15. Performance Achievements – “Does the individual ‘stand
- 16. Performance Achievements – “Does the individual ‘stand
- 17. Performance ROI – “What is his/her impact
- 18. Performance Overall evaluative contribution Value Individual impact
- 19. Does the process deliver?
- 20. Are We Getting Them Right? Measuring aggregate
- 21. Recruiting Are we identifying the right candidates?
- 22. Recruiting Contributions of recruiting statistics Benefits Determine
- 23. Recruiting Exploring recruiting issues Key explanatory statistics
- 24. Hiring Are the people we want accepting
- 25. Hiring Contributions of hiring statistics Benefits Evaluate
- 26. Hiring Exploring hiring issues Key explanatory statistics
- 27. Selection Are the people we’re hiring turning
- 28. Selection Contributions of selection statistics Benefits Potentially
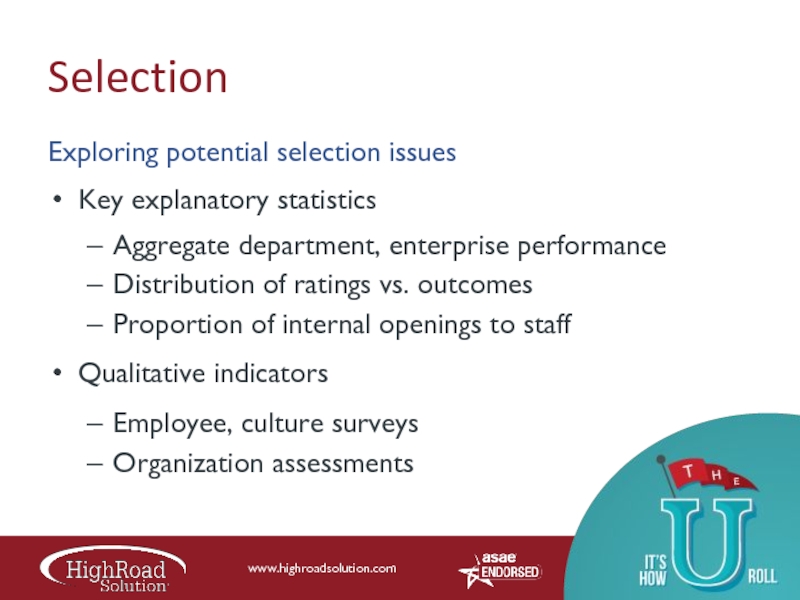
- 29. Selection Exploring potential selection issues Key explanatory
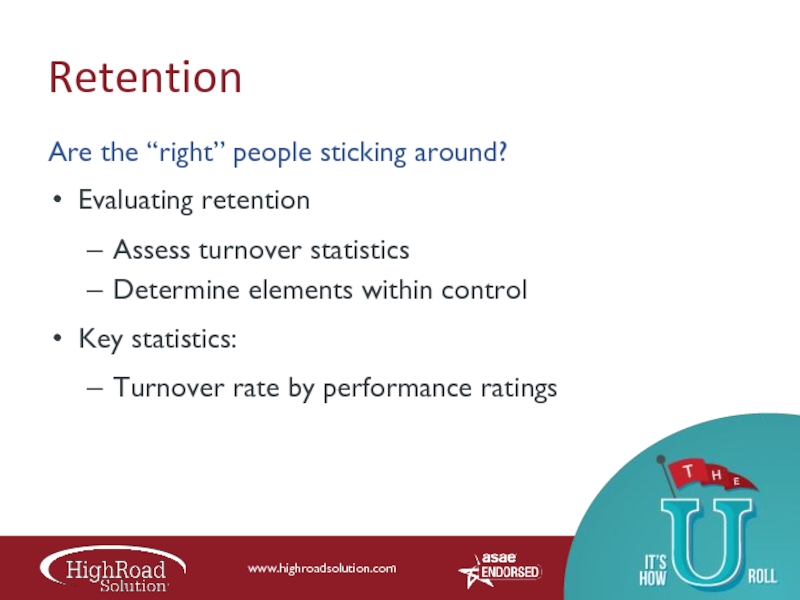
- 30. Retention Are the “right” people sticking around?
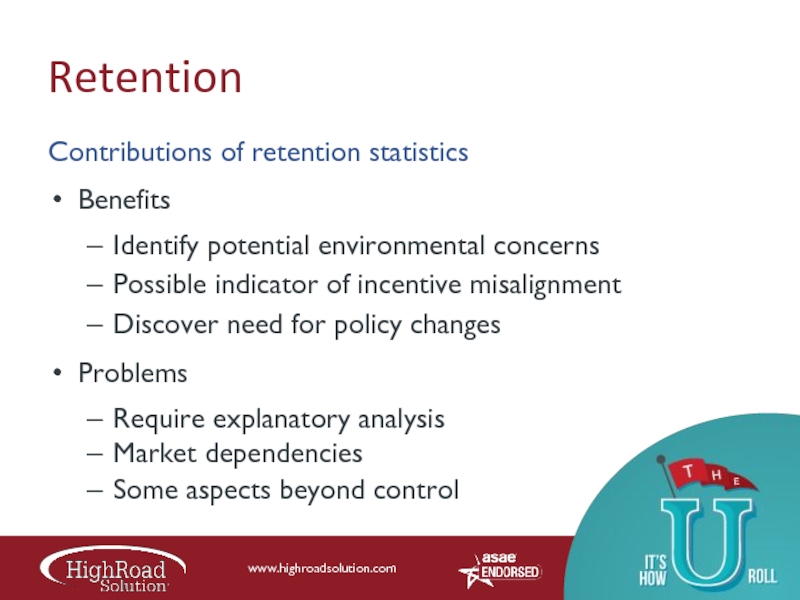
- 31. Retention Contributions of retention statistics Benefits Identify
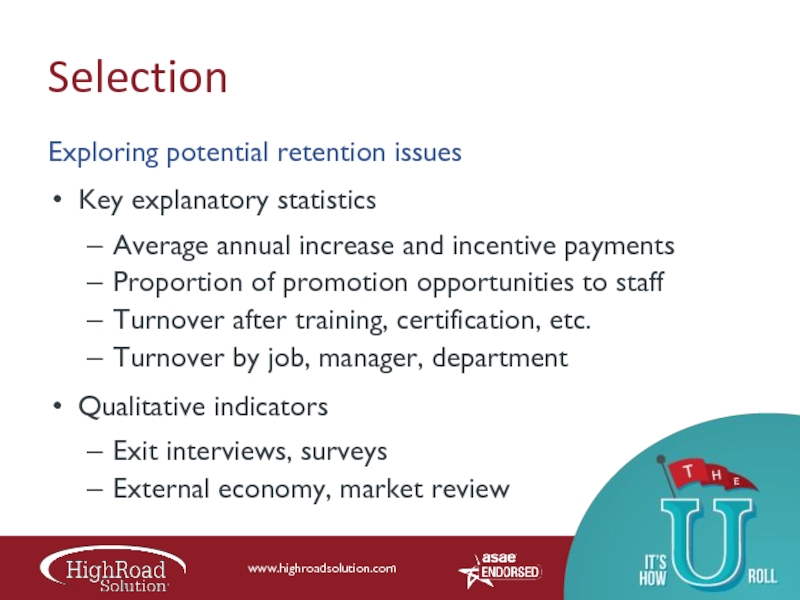
- 32. Selection Exploring potential retention issues Key explanatory
- 33. Wrap-up
- 34. Summary Measuring “right” – the individual and
- 35. More Information Learn more about best practices
Слайд 2Today’s Content Leader
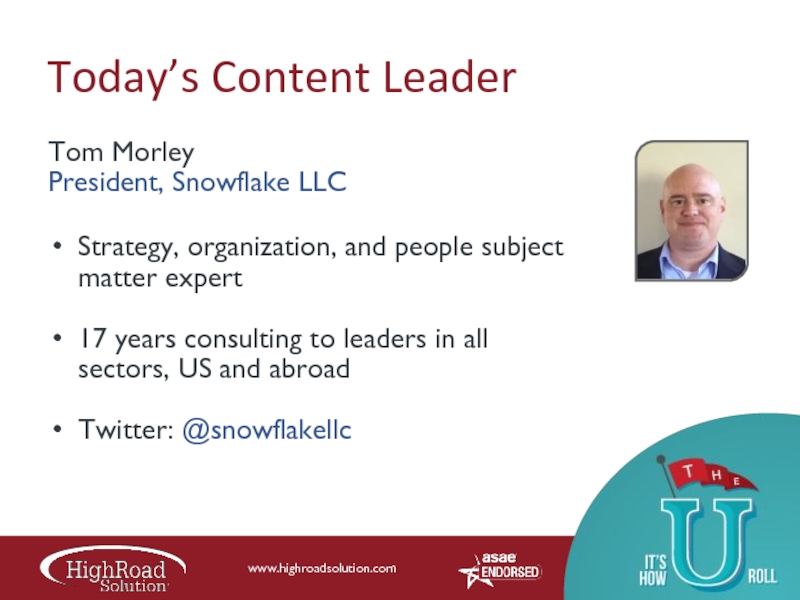
Tom Morley
President, Snowflake LLC
Strategy, organization, and people subject matter
expert
17 years consulting to leaders in all sectors, US and abroad
Twitter: @snowflakellc
17 years consulting to leaders in all sectors, US and abroad
Twitter: @snowflakellc
Слайд 3
The “right” people
A Simple Workforce Challenge
Inspire
Hire
Identify
A changing world calls for different
resources
People are a limiting factor for strategy
It’s hard to hire the people you need
Today’s challenges require inspired solutions
People are a limiting factor for strategy
It’s hard to hire the people you need
Today’s challenges require inspired solutions
Слайд 4Did We Get This One Right?
Measuring what’s important about individuals
Typical measurable
elements of “right”
Readiness – Prepared for what’s expected
Performance – Delivering results, good “fit”
These elements cover other indicators
The organization may have other factors
Readiness – Prepared for what’s expected
Performance – Delivering results, good “fit”
These elements cover other indicators
The organization may have other factors
Слайд 6Readiness
Is the employee prepared to contribute when asked?
Knowledge and skills at
prescribed times
Measure milestone capabilities
Align with development plans
Three primary methods:
Requirements tracking
Gateway knowledge assessment
Short-term evaluation
Measure milestone capabilities
Align with development plans
Three primary methods:
Requirements tracking
Gateway knowledge assessment
Short-term evaluation
Слайд 7Readiness
Requirements tracking – “Did he/she get the basics?”
Benefits
Simplest form to track
Can
measure and respond within activity
Data can be collected and analyzed
Problems
Assumes training effectiveness
Tests are often too easy
No clear consequences
Data can be collected and analyzed
Problems
Assumes training effectiveness
Tests are often too easy
No clear consequences
Слайд 8Readiness
Gateway knowledge assessment – “Is he/she ready?”
Benefits
Rigorous
Tests knowledge, not memory
Can
identify and address gaps
Problems
How much is “too much”?
Wrong person, or wrong program?*
Possible legal risks
Problems
How much is “too much”?
Wrong person, or wrong program?*
Possible legal risks
Слайд 9Readiness
Short-term evaluation – “Is this working out?”
Benefits
Early recognition
Opportunity to correct
May be
able to identify commonalities
Problems
Can be highly subjective
Whose “fault” is it?*
Limited, often costly options
Problems
Can be highly subjective
Whose “fault” is it?*
Limited, often costly options
Слайд 10Readiness
Overall evaluative contribution
Value
Individual-level “course correction”
Aggregate trends
Concerns
Problem misidentification
When to “pull the plug”?
Слайд 11Performance
Is the person continuously contributing as expected?
Accomplishing, inspiring, and advancing
Evaluate results
of work and participation
Assess and project impact on organization
Three primary methods:
Performance reviews
Achievements
Return on investment (ROI)
Assess and project impact on organization
Three primary methods:
Performance reviews
Achievements
Return on investment (ROI)
Слайд 12Performance
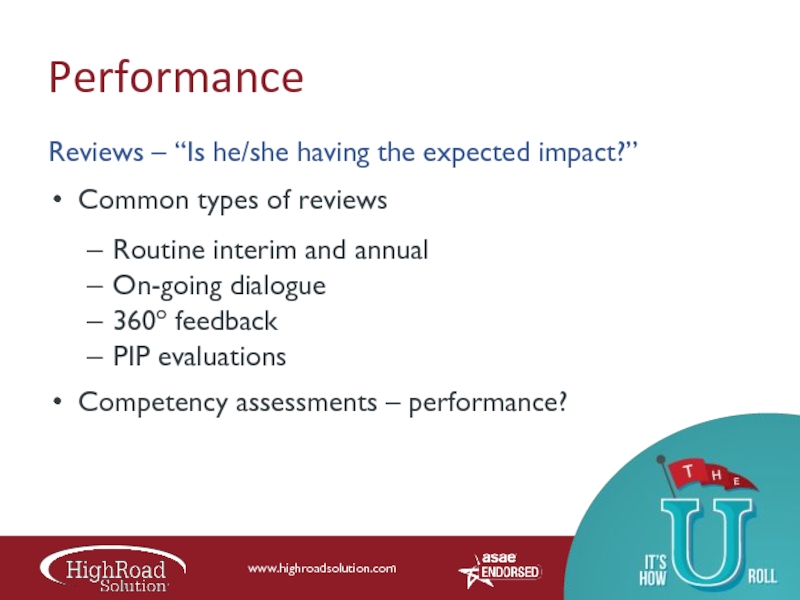
Reviews – “Is he/she having the expected impact?”
Common types of reviews
Routine
interim and annual
On-going dialogue
360o feedback
PIP evaluations
Competency assessments – performance?
On-going dialogue
360o feedback
PIP evaluations
Competency assessments – performance?
Слайд 13Performance
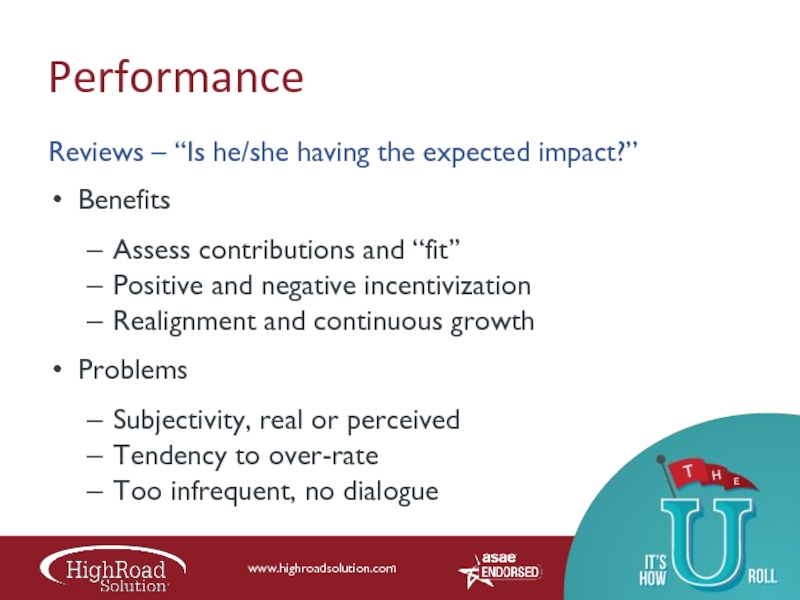
Reviews – “Is he/she having the expected impact?”
Benefits
Assess contributions and “fit”
Positive
and negative incentivization
Realignment and continuous growth
Problems
Subjectivity, real or perceived
Tendency to over-rate
Too infrequent, no dialogue
Realignment and continuous growth
Problems
Subjectivity, real or perceived
Tendency to over-rate
Too infrequent, no dialogue
Слайд 14Performance
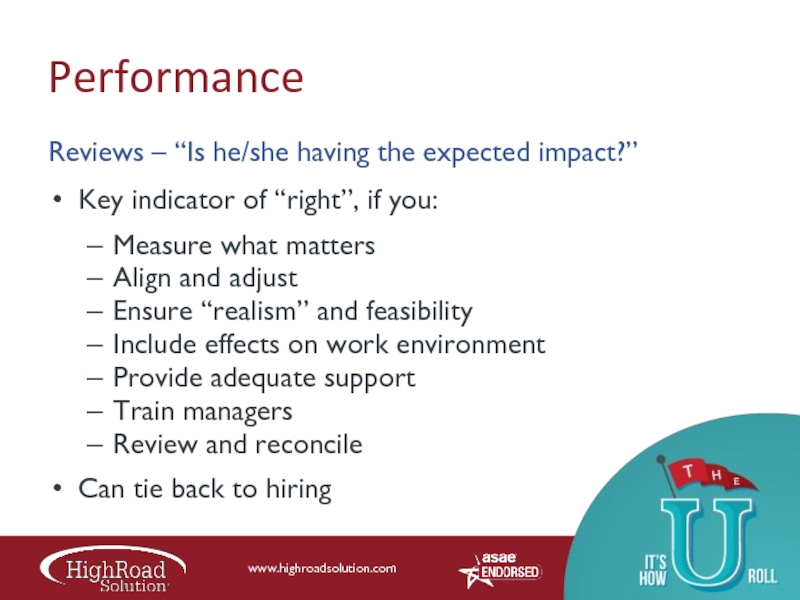
Reviews – “Is he/she having the expected impact?”
Key indicator of “right”,
if you:
Measure what matters
Align and adjust
Ensure “realism” and feasibility
Include effects on work environment
Provide adequate support
Train managers
Review and reconcile
Can tie back to hiring
Measure what matters
Align and adjust
Ensure “realism” and feasibility
Include effects on work environment
Provide adequate support
Train managers
Review and reconcile
Can tie back to hiring
Слайд 15Performance
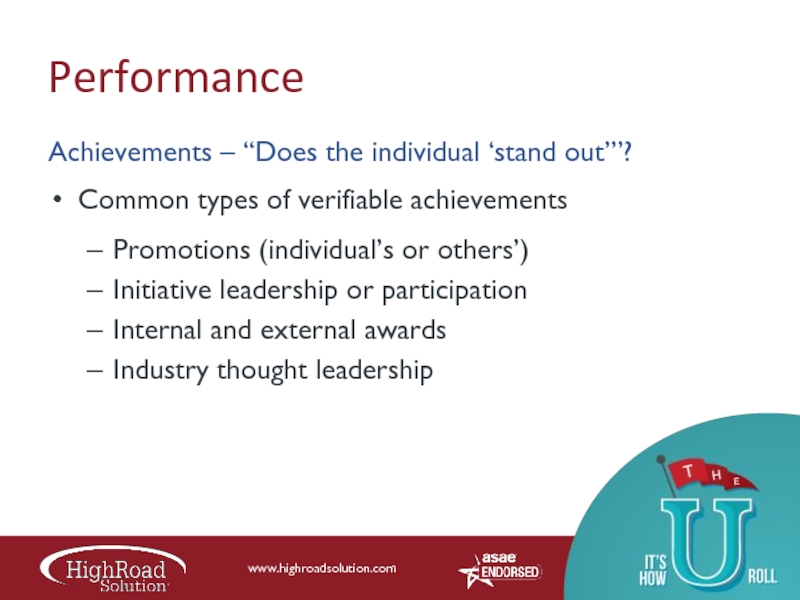
Achievements – “Does the individual ‘stand out’”?
Common types of verifiable achievements
Promotions
(individual’s or others’)
Initiative leadership or participation
Internal and external awards
Industry thought leadership
Initiative leadership or participation
Internal and external awards
Industry thought leadership
Слайд 16Performance
Achievements – “Does the individual ‘stand out’?”
Benefits
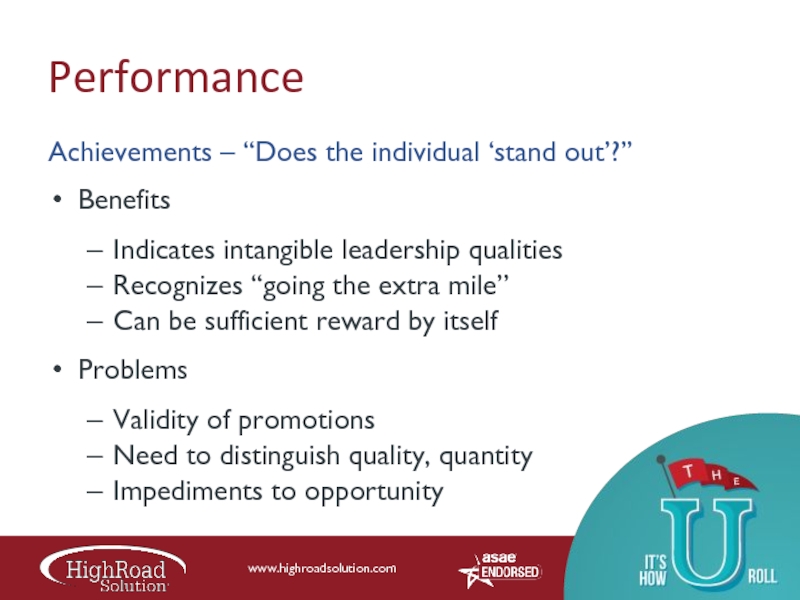
Indicates intangible leadership qualities
Recognizes “going
the extra mile”
Can be sufficient reward by itself
Problems
Validity of promotions
Need to distinguish quality, quantity
Impediments to opportunity
Can be sufficient reward by itself
Problems
Validity of promotions
Need to distinguish quality, quantity
Impediments to opportunity
Слайд 17Performance
ROI – “What is his/her impact on the ‘bottom line’?”
Benefits
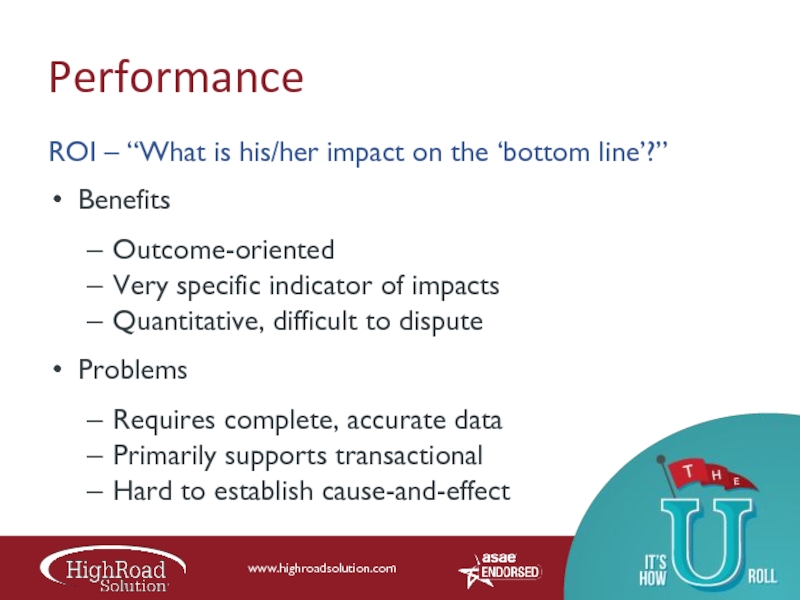
Outcome-oriented
Very specific
indicator of impacts
Quantitative, difficult to dispute
Problems
Requires complete, accurate data
Primarily supports transactional
Hard to establish cause-and-effect
Quantitative, difficult to dispute
Problems
Requires complete, accurate data
Primarily supports transactional
Hard to establish cause-and-effect
Слайд 18Performance
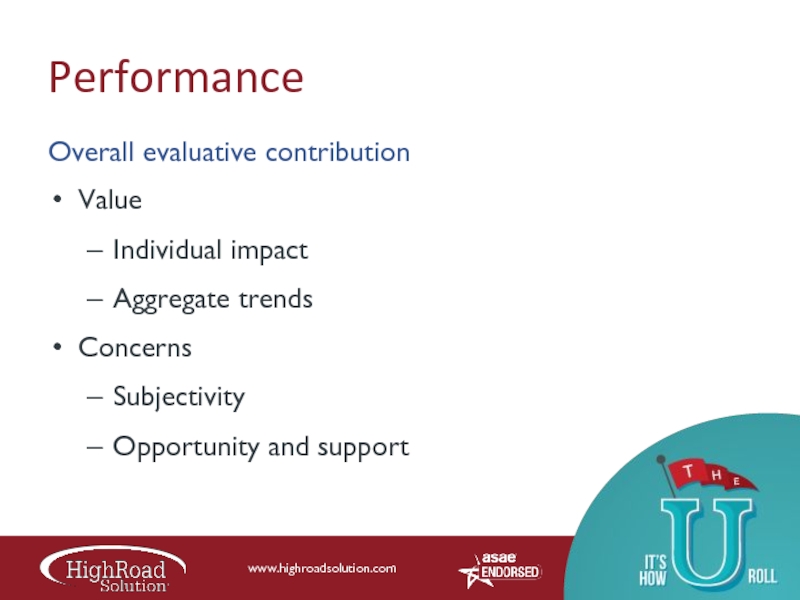
Overall evaluative contribution
Value
Individual impact
Aggregate trends
Concerns
Subjectivity
Opportunity and support
Слайд 20Are We Getting Them Right?
Measuring aggregate hiring effectiveness
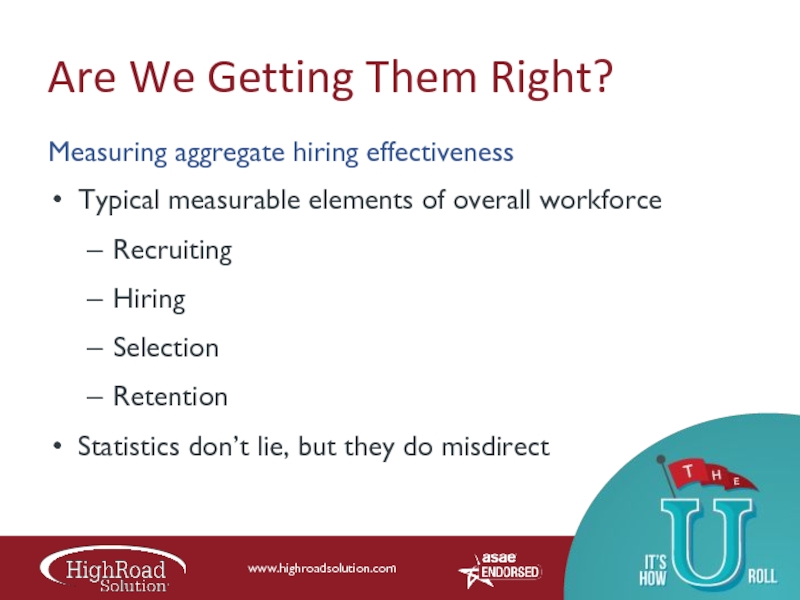
Typical measurable elements of
overall workforce
Recruiting
Hiring
Selection
Retention
Statistics don’t lie, but they do misdirect
Recruiting
Hiring
Selection
Retention
Statistics don’t lie, but they do misdirect
Слайд 21Recruiting
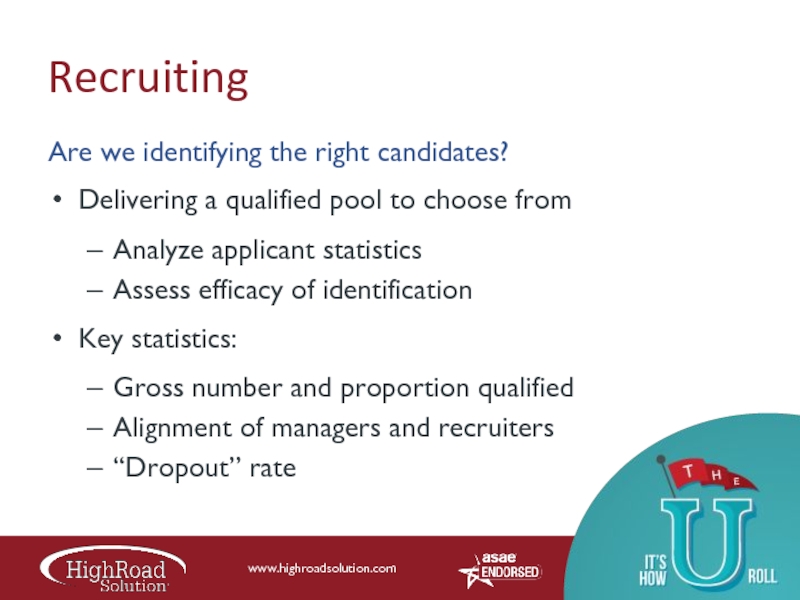
Are we identifying the right candidates?
Delivering a qualified pool to choose
from
Analyze applicant statistics
Assess efficacy of identification
Key statistics:
Gross number and proportion qualified
Alignment of managers and recruiters
“Dropout” rate
Analyze applicant statistics
Assess efficacy of identification
Key statistics:
Gross number and proportion qualified
Alignment of managers and recruiters
“Dropout” rate
Слайд 22Recruiting
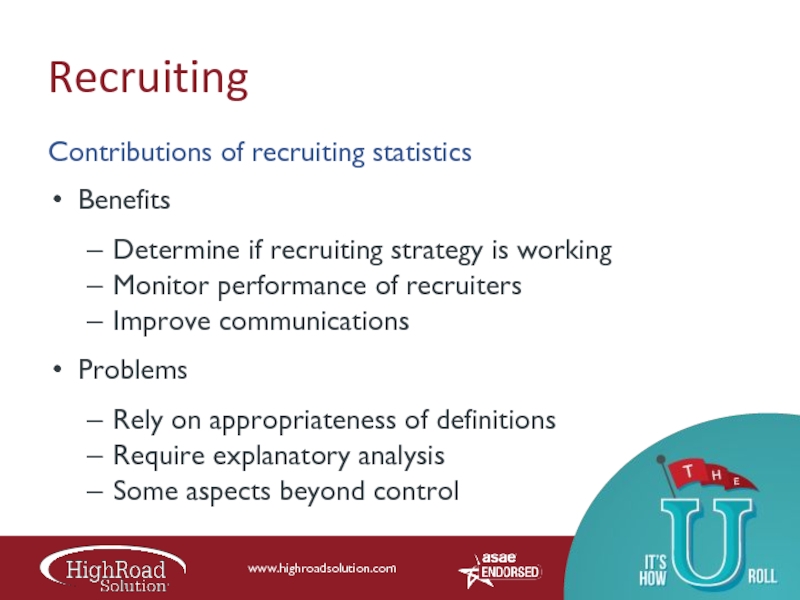
Contributions of recruiting statistics
Benefits
Determine if recruiting strategy is working
Monitor performance of
recruiters
Improve communications
Problems
Rely on appropriateness of definitions
Require explanatory analysis
Some aspects beyond control
Improve communications
Problems
Rely on appropriateness of definitions
Require explanatory analysis
Some aspects beyond control
Слайд 23Recruiting
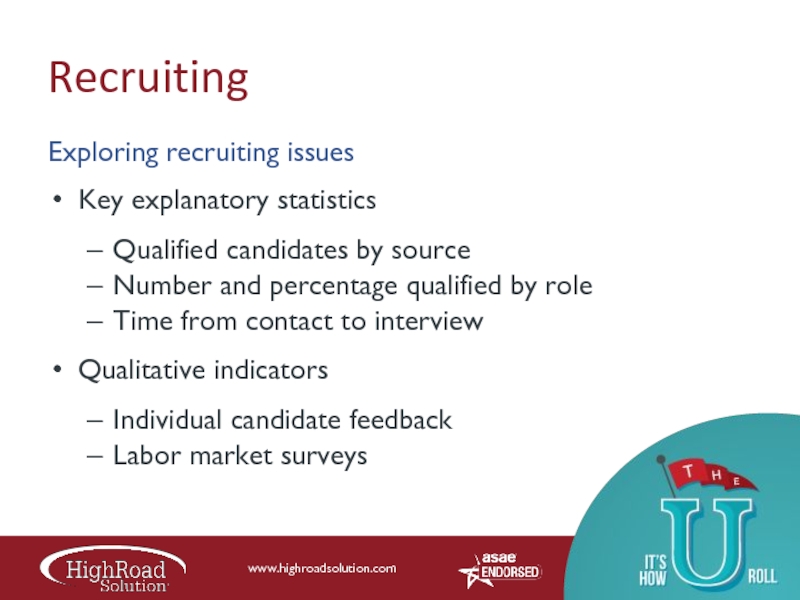
Exploring recruiting issues
Key explanatory statistics
Qualified candidates by source
Number and percentage qualified
by role
Time from contact to interview
Qualitative indicators
Individual candidate feedback
Labor market surveys
Time from contact to interview
Qualitative indicators
Individual candidate feedback
Labor market surveys
Слайд 24Hiring
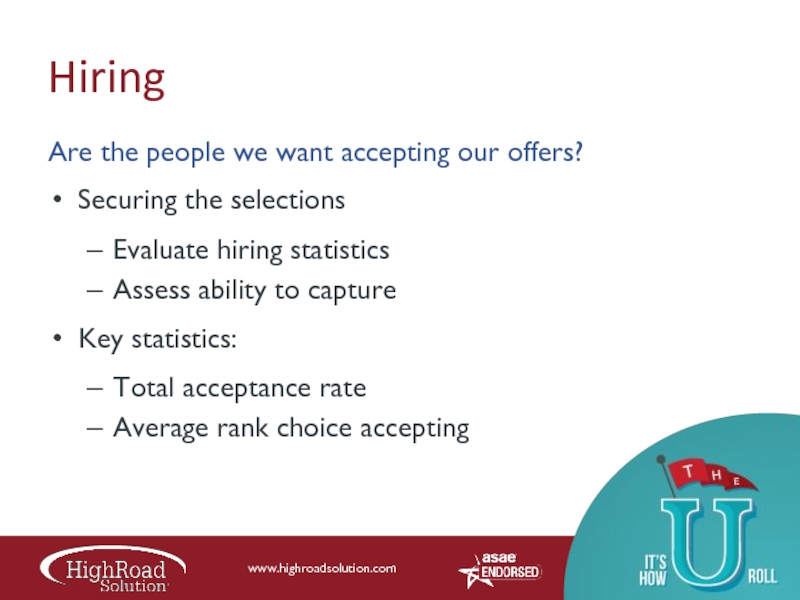
Are the people we want accepting our offers?
Securing the selections
Evaluate hiring
statistics
Assess ability to capture
Key statistics:
Total acceptance rate
Average rank choice accepting
Assess ability to capture
Key statistics:
Total acceptance rate
Average rank choice accepting
Слайд 25Hiring
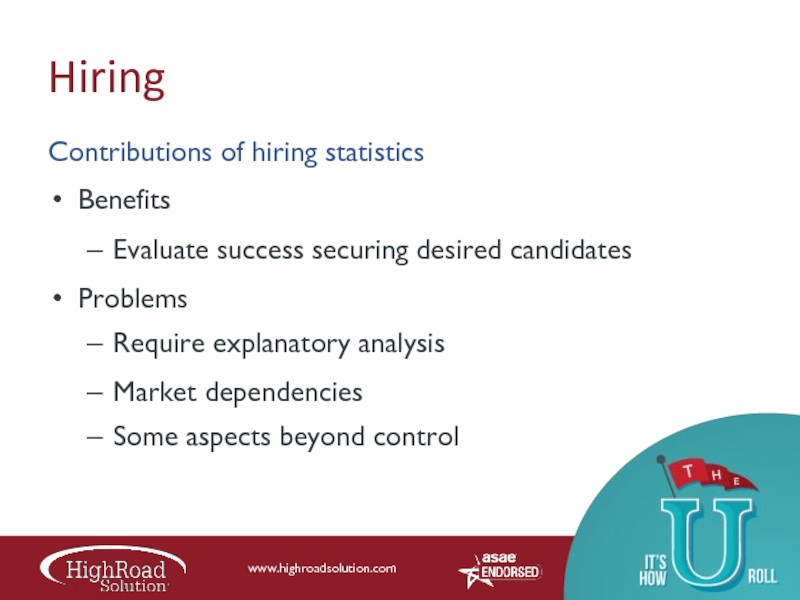
Contributions of hiring statistics
Benefits
Evaluate success securing desired candidates
Problems
Require explanatory analysis
Market dependencies
Some
aspects beyond control
Слайд 26Hiring
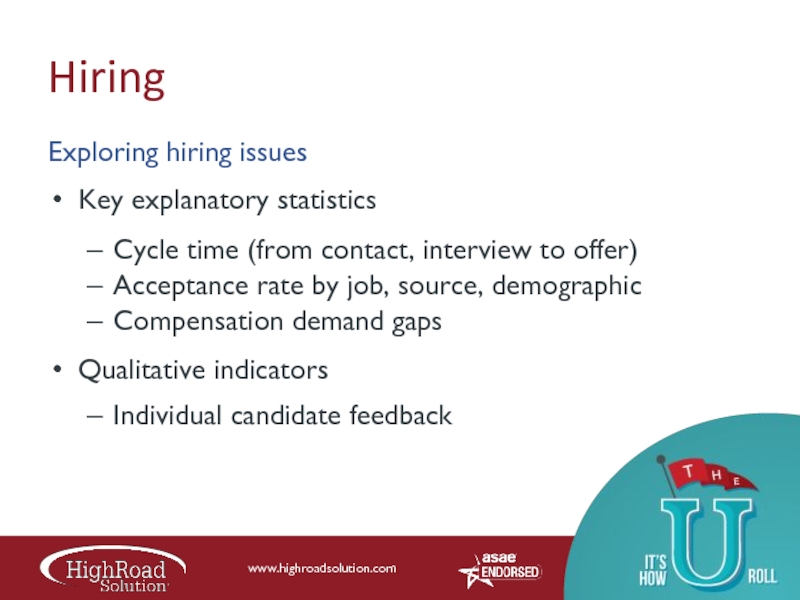
Exploring hiring issues
Key explanatory statistics
Cycle time (from contact, interview to offer)
Acceptance
rate by job, source, demographic
Compensation demand gaps
Qualitative indicators
Individual candidate feedback
Compensation demand gaps
Qualitative indicators
Individual candidate feedback
Слайд 27Selection
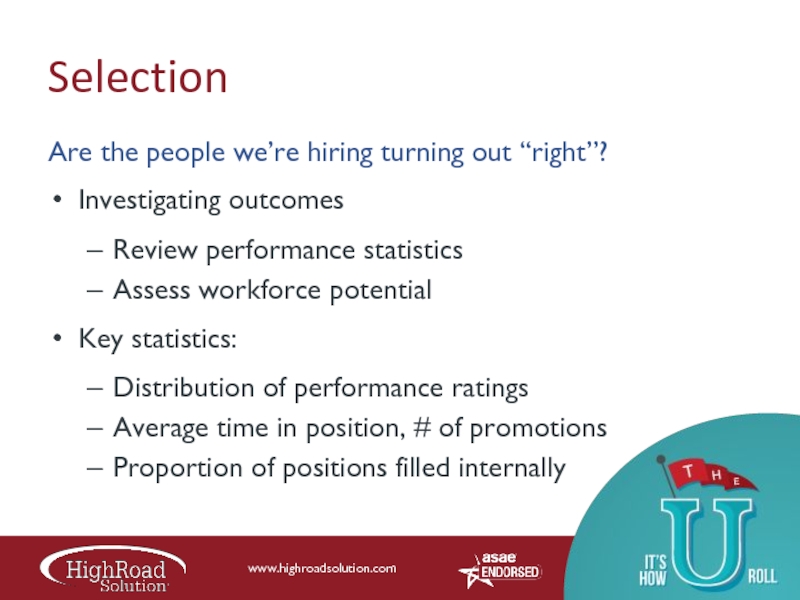
Are the people we’re hiring turning out “right”?
Investigating outcomes
Review performance statistics
Assess
workforce potential
Key statistics:
Distribution of performance ratings
Average time in position, # of promotions
Proportion of positions filled internally
Key statistics:
Distribution of performance ratings
Average time in position, # of promotions
Proportion of positions filled internally
Слайд 28Selection
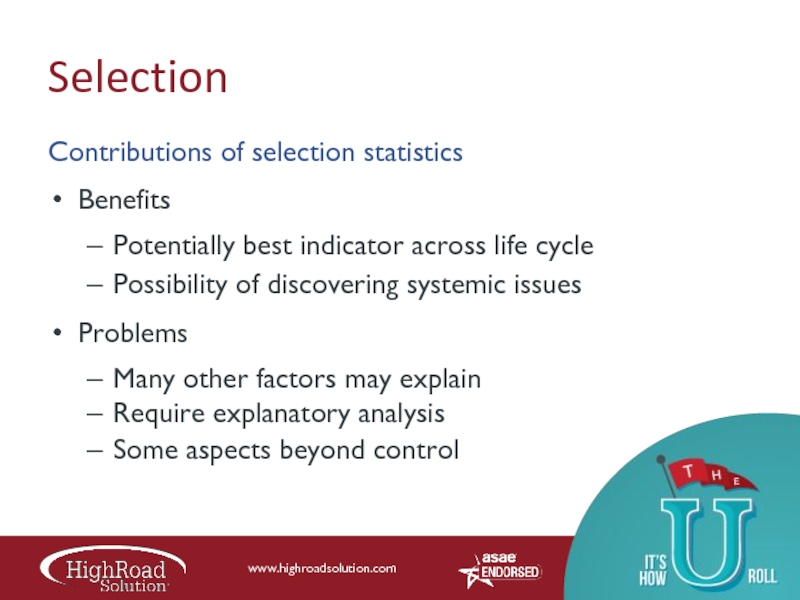
Contributions of selection statistics
Benefits
Potentially best indicator across life cycle
Possibility of discovering
systemic issues
Problems
Many other factors may explain
Require explanatory analysis
Some aspects beyond control
Problems
Many other factors may explain
Require explanatory analysis
Some aspects beyond control
Слайд 29Selection
Exploring potential selection issues
Key explanatory statistics
Aggregate department, enterprise performance
Distribution of ratings
vs. outcomes
Proportion of internal openings to staff
Qualitative indicators
Employee, culture surveys
Organization assessments
Proportion of internal openings to staff
Qualitative indicators
Employee, culture surveys
Organization assessments
Слайд 30Retention
Are the “right” people sticking around?
Evaluating retention
Assess turnover statistics
Determine elements within
control
Key statistics:
Turnover rate by performance ratings
Key statistics:
Turnover rate by performance ratings
Слайд 31Retention
Contributions of retention statistics
Benefits
Identify potential environmental concerns
Possible indicator of incentive misalignment
Discover
need for policy changes
Problems
Require explanatory analysis
Market dependencies
Some aspects beyond control
Problems
Require explanatory analysis
Market dependencies
Some aspects beyond control
Слайд 32Selection
Exploring potential retention issues
Key explanatory statistics
Average annual increase and incentive payments
Proportion
of promotion opportunities to staff
Turnover after training, certification, etc.
Turnover by job, manager, department
Qualitative indicators
Exit interviews, surveys
External economy, market review
Turnover after training, certification, etc.
Turnover by job, manager, department
Qualitative indicators
Exit interviews, surveys
External economy, market review
Слайд 34Summary
Measuring “right” – the individual and the process
Have to define “right”
to hire “right”
Getting it “wrong” is costly, affects brand
“Effectiveness” vs. “explanatory” measures
Individual monitoring allows real-time correction
Process evaluation:
Can identify systemic challenges
May not fix individual situations
Environment may play a major role
Getting it “wrong” is costly, affects brand
“Effectiveness” vs. “explanatory” measures
Individual monitoring allows real-time correction
Process evaluation:
Can identify systemic challenges
May not fix individual situations
Environment may play a major role
Слайд 35More Information
Learn more about best practices and how they might apply
to your organization
Snowflake LLC
+1.540.931.9943
info@snowflakellc.com
www.snowflakellc.com/contact
Facebook: www.facebook.com/snowflakellc
Twitter: @snowflakellc
Snowflake LLC
+1.540.931.9943
info@snowflakellc.com
www.snowflakellc.com/contact
Facebook: www.facebook.com/snowflakellc
Twitter: @snowflakellc

