- Главная
- Разное
- Дизайн
- Бизнес и предпринимательство
- Аналитика
- Образование
- Развлечения
- Красота и здоровье
- Финансы
- Государство
- Путешествия
- Спорт
- Недвижимость
- Армия
- Графика
- Культурология
- Еда и кулинария
- Лингвистика
- Английский язык
- Астрономия
- Алгебра
- Биология
- География
- Детские презентации
- Информатика
- История
- Литература
- Маркетинг
- Математика
- Медицина
- Менеджмент
- Музыка
- МХК
- Немецкий язык
- ОБЖ
- Обществознание
- Окружающий мир
- Педагогика
- Русский язык
- Технология
- Физика
- Философия
- Химия
- Шаблоны, картинки для презентаций
- Экология
- Экономика
- Юриспруденция
Toss ‘N’ Turn:Smartphone asSleep and Sleep Quality Detector презентация
Содержание
- 1. Toss ‘N’ Turn:Smartphone asSleep and Sleep Quality Detector
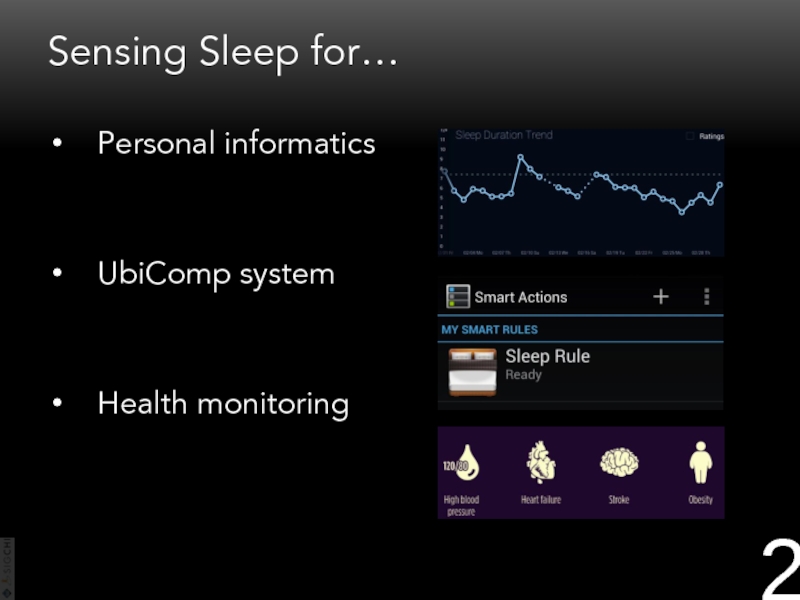
- 2. Sensing Sleep for… Personal informatics
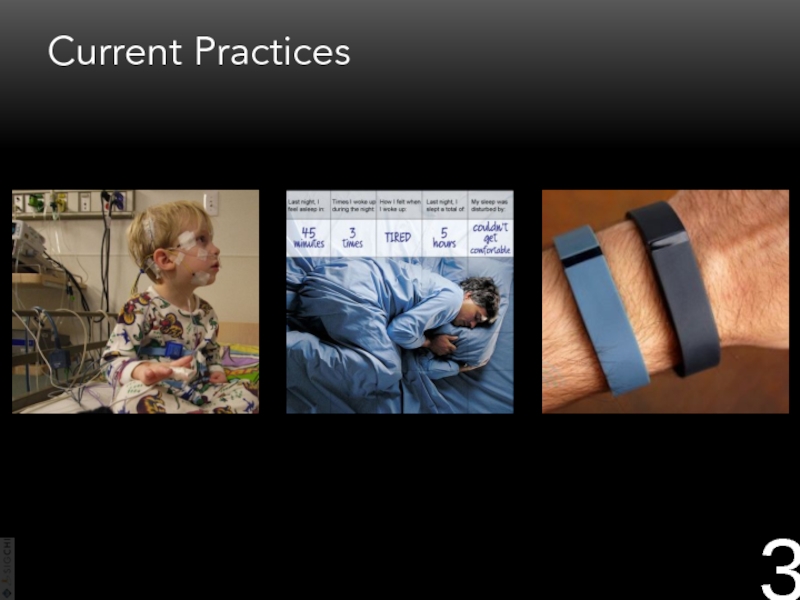
- 3. Current Practices
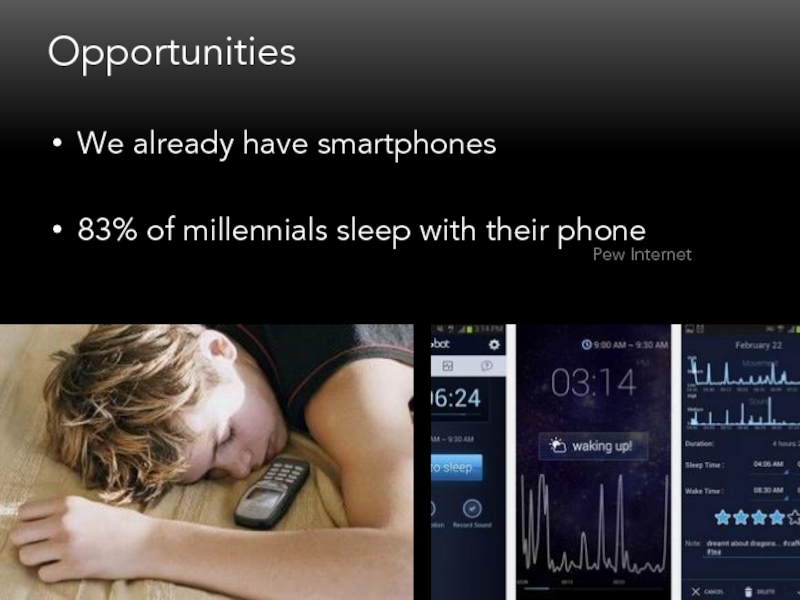
- 4. Opportunities We already have smartphones 83%
- 5. How well a smartphone
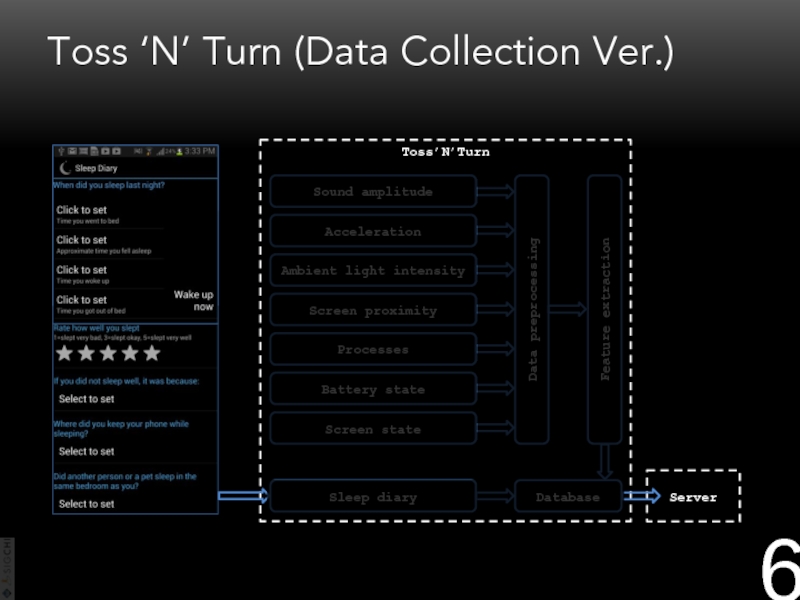
- 6. Toss ‘N’ Turn (Data Collection Ver.)
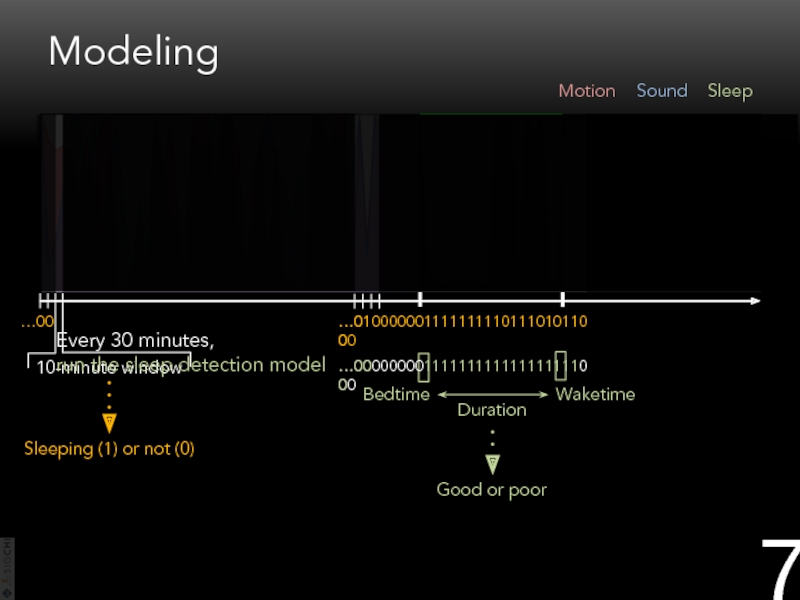
- 7. Modeling Sound Motion Sleep
- 8. User Study Recruited good and poor sleepers
- 9. Ground Truthing User Study Global score >
- 10. Demographics User Study 11 Share bed with
- 11. Evaluation Classifier Bayesian network (BN) with correlation-based
- 12. Task 1: Sleep Detection Detect sleep
- 13. Task 2: Daily Sleep Quality Inference
- 14. Task 3: Good/Poor Sleeper Classification Evaluation
- 15. Discussion How well a smartphone
- 16. Top Five Features Time Battery charging /
- 17. Sleep Detection Errors Discussion People who
- 18. General vs. Individual Models Sleep detection: 93.06%
- 19. Limitations Subjective vs. objective sleep quality “How
- 20. Thanks! More info at cmuchimps.org or email loomlike@cs.cmu.edu Special thanks to: DARPA, Google
- 21. Backup Slides
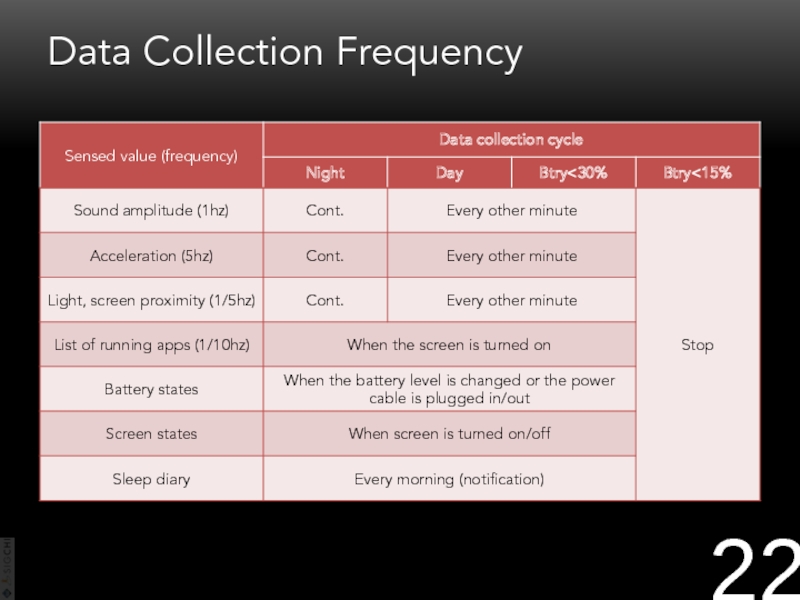
- 22. Data Collection Frequency
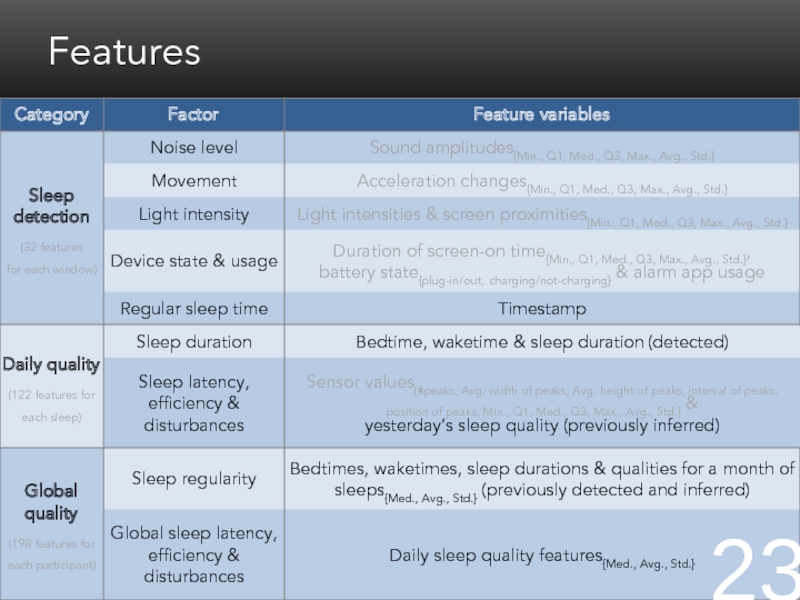
- 23. Features
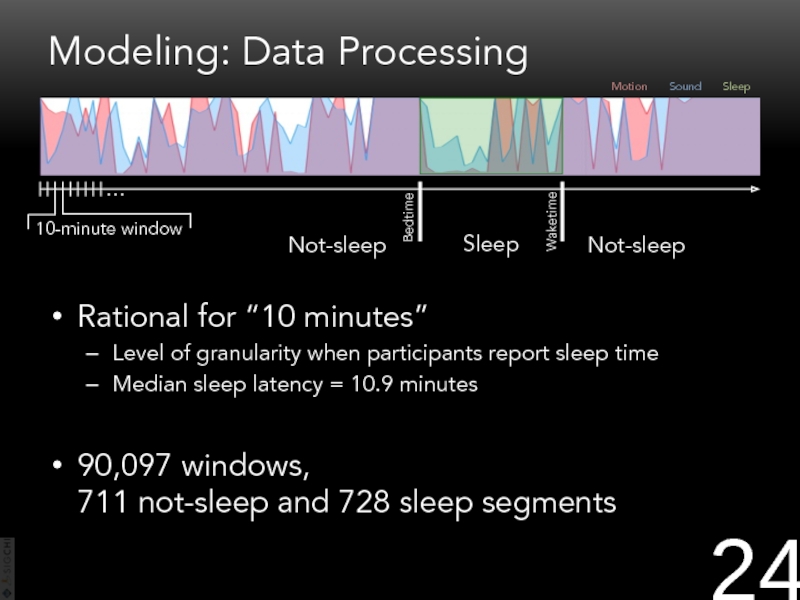
- 24. Modeling: Data Processing
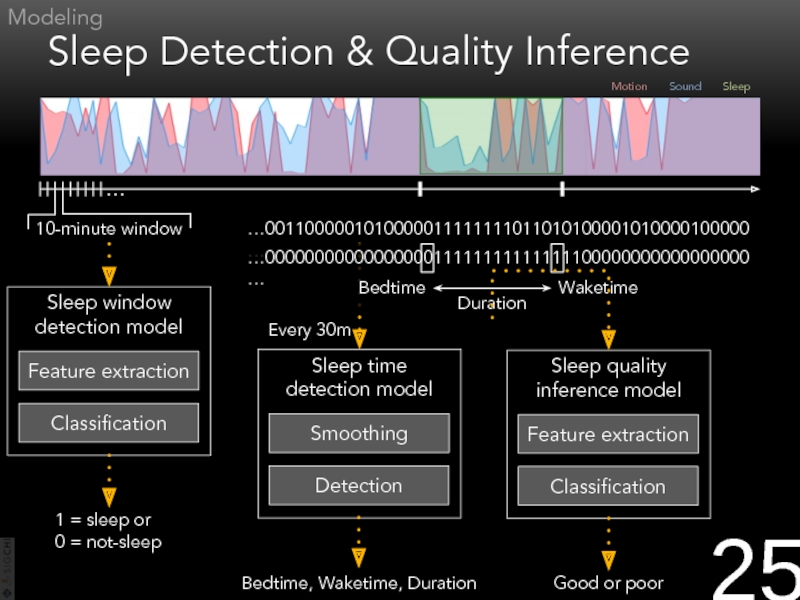
- 25. Sleep Detection & Quality Inference Modeling … Sound Motion 10-minute window Sleep …0011000001010000011111111011010100001010000100000…
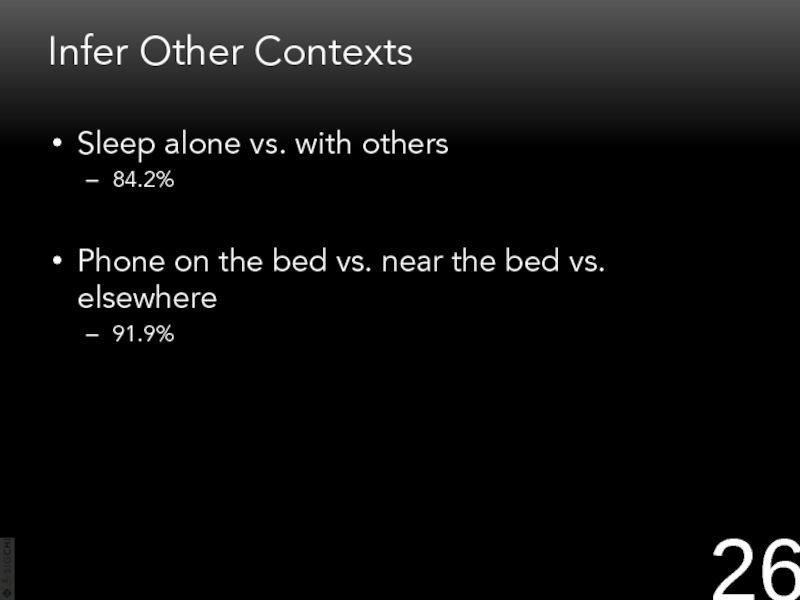
- 26. Infer Other Contexts Sleep alone vs. with
Слайд 1Toss ‘N’ Turn:
Smartphone as
Sleep and Sleep Quality Detector
Jun-Ki Min (loomlike@cs.cmu.edu)
Afsaneh Doryab
Jason
Слайд 4Opportunities
We already have smartphones
83% of millennials sleep with their phone
Pew Internet
Слайд 5
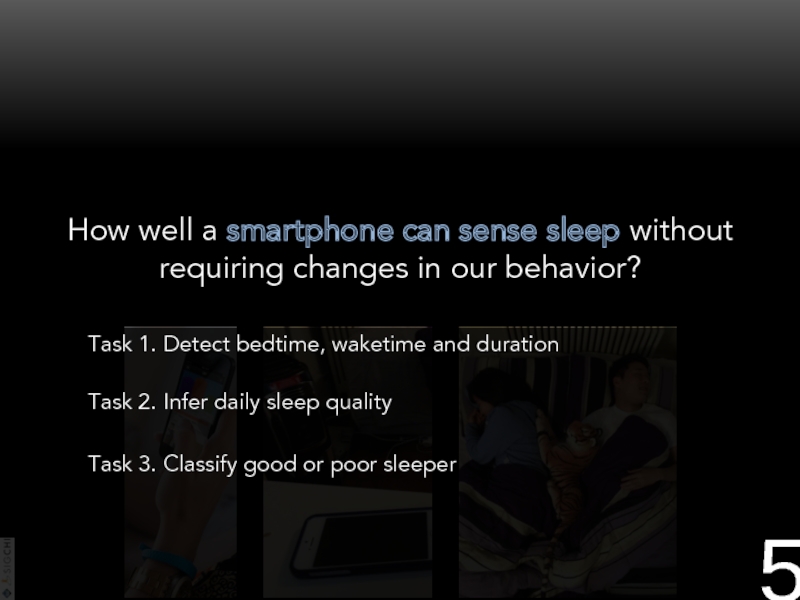
How well a smartphone can sense sleep without requiring changes in
Task 1. Detect bedtime, waketime and duration
Task 2. Infer daily sleep quality
Task 3. Classify good or poor sleeper
Слайд 8User Study
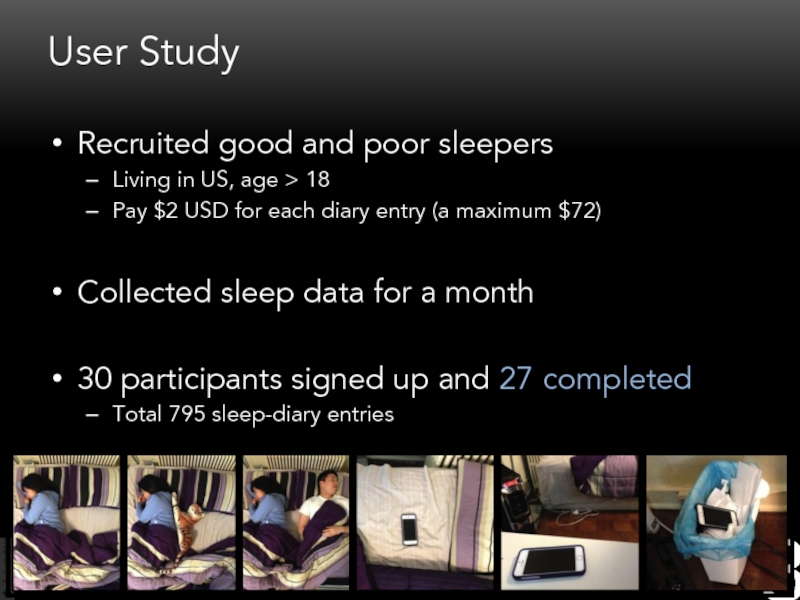
Recruited good and poor sleepers
Living in US, age > 18
Pay
Collected sleep data for a month
30 participants signed up and 27 completed
Total 795 sleep-diary entries
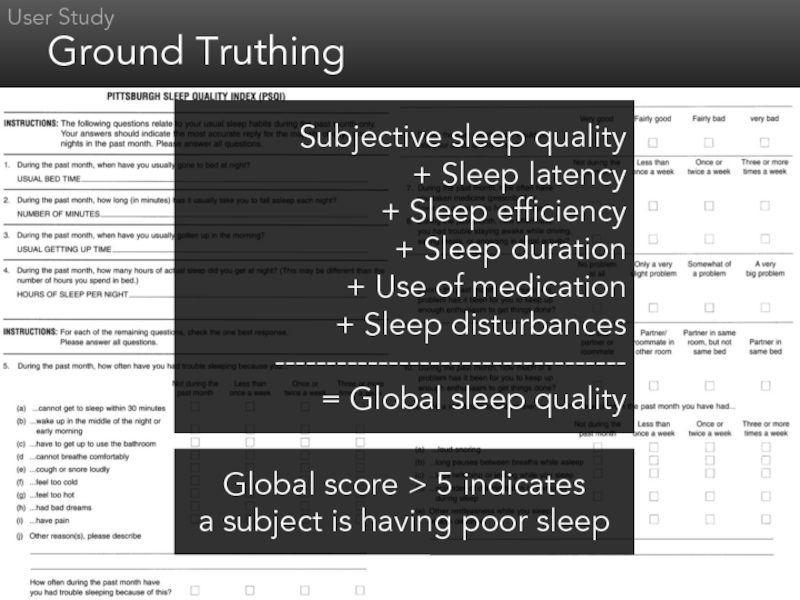
Слайд 9Ground Truthing
User Study
Global score > 5 indicates
a subject is having poor
Subjective sleep quality
+ Sleep latency
+ Sleep efficiency
+ Sleep duration
+ Use of medication
+ Sleep disturbances
----------------------------------
= Global sleep quality
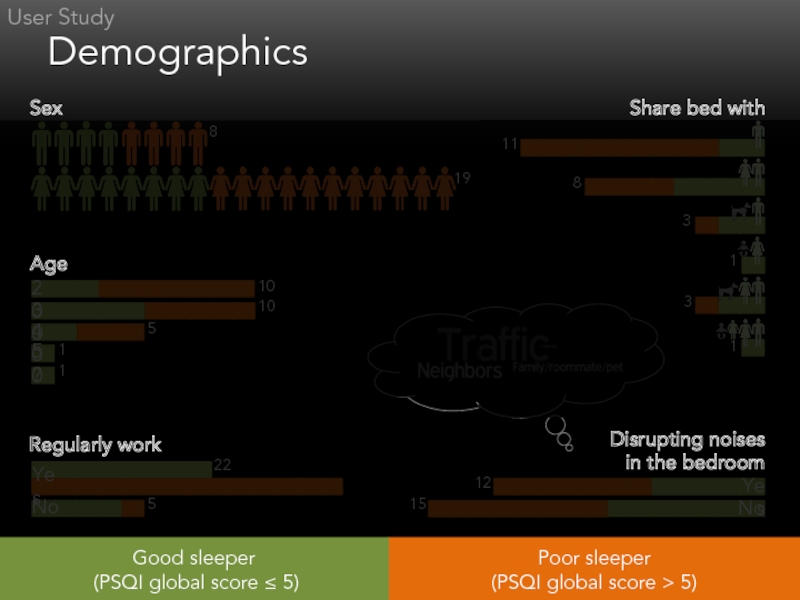
Слайд 10Demographics
User Study
11
Share bed with
3
8
3
1
1
Disrupting noises in the bedroom
12
15
Yes
No
Age
10
10
5
1
1
20
30
40
50
?
Regularly work
22
5
No
Yes
Poor sleeper
(PSQI global
Good sleeper
(PSQI global score ≤ 5)
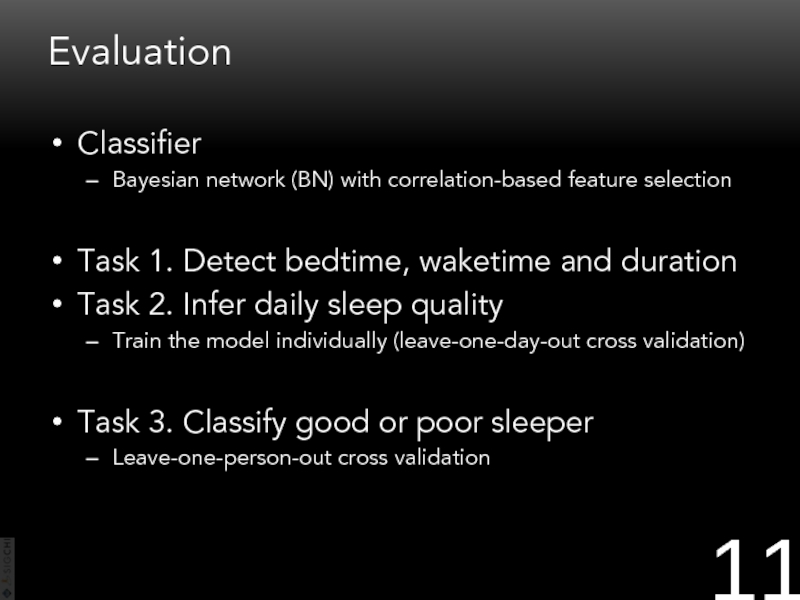
Слайд 11Evaluation
Classifier
Bayesian network (BN) with correlation-based feature selection
Task 1. Detect bedtime, waketime
Task 2. Infer daily sleep quality
Train the model individually (leave-one-day-out cross validation)
Task 3. Classify good or poor sleeper
Leave-one-person-out cross validation
Слайд 12
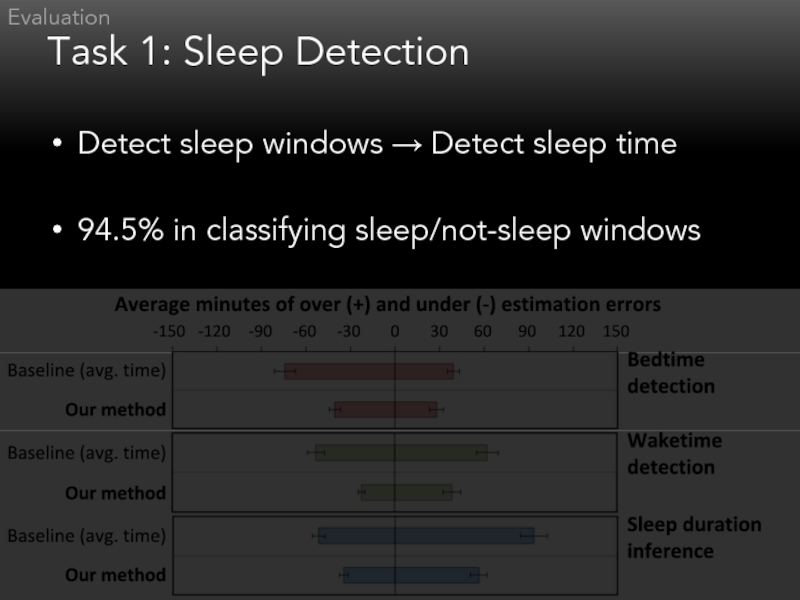
Task 1: Sleep Detection
Detect sleep windows → Detect sleep time
94.5% in
Evaluation
Bedtime
detection
Baseline (avg. time)
Our method
Waketime
detection
Baseline (avg. time)
Sleep duration
inference
Baseline (avg. time)
-150
150
-120
120
90
60
30
0
-30
-60
-90
Average minutes of over (+) and under (-) estimation errors
Our method
Our method
Слайд 13
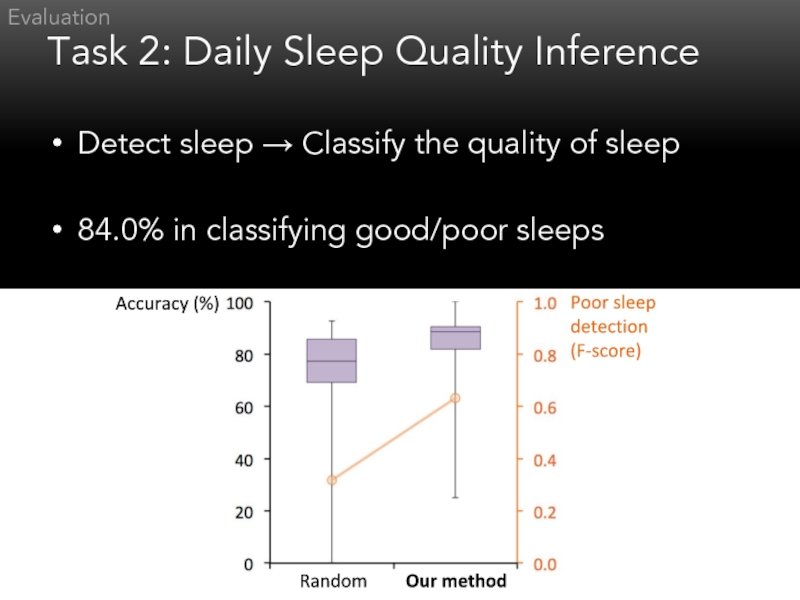
Task 2: Daily Sleep Quality Inference
Evaluation
Detect sleep → Classify the quality
84.0% in classifying good/poor sleeps
Accuracy (%)
Our method
Random
Poor sleep detection
(F-score)
Слайд 14
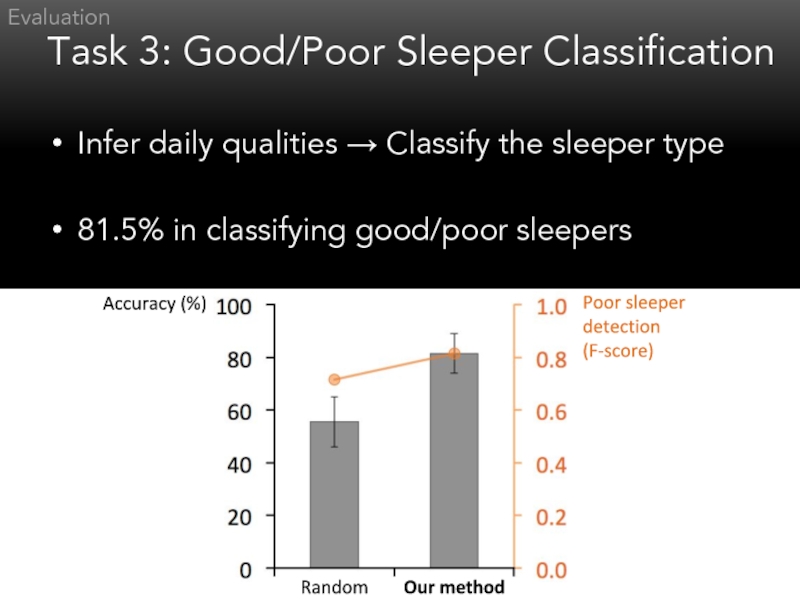
Task 3: Good/Poor Sleeper Classification
Evaluation
Infer daily qualities → Classify the sleeper
81.5% in classifying good/poor sleepers
Our method
Random
Accuracy (%)
Poor sleeper detection
(F-score)
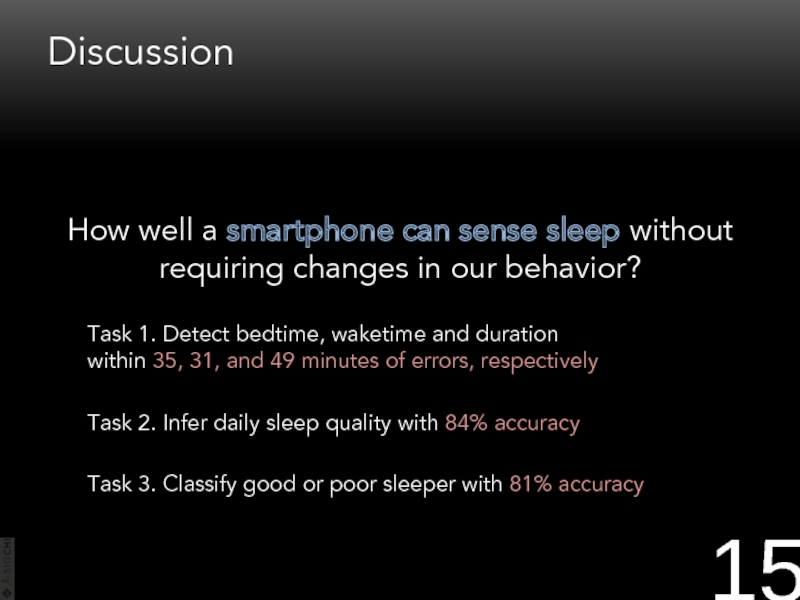
Слайд 15Discussion
How well a smartphone can sense sleep without requiring changes in
Task 1. Detect bedtime, waketime and duration within 35, 31, and 49 minutes of errors, respectively
Task 2. Infer daily sleep quality with 84% accuracy
Task 3. Classify good or poor sleeper with 81% accuracy
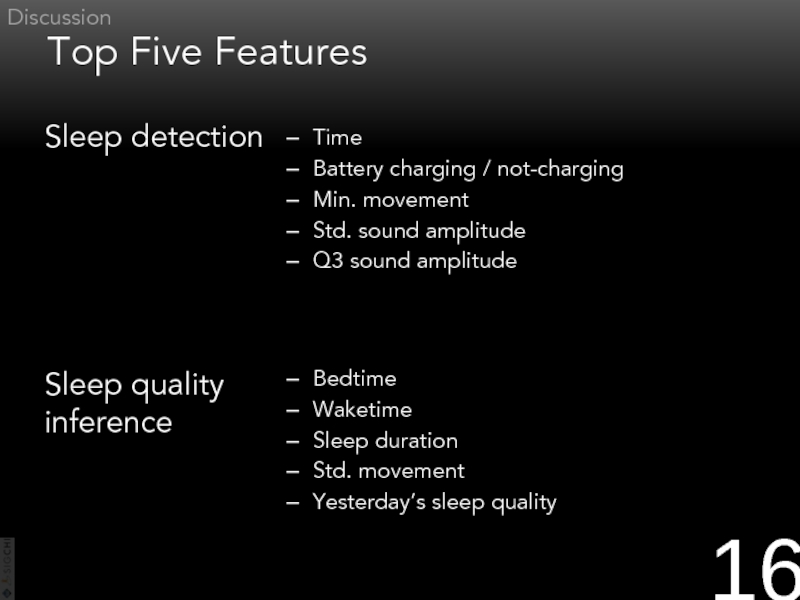
Слайд 16Top Five Features
Time
Battery charging / not-charging
Min. movement
Std. sound amplitude
Q3 sound amplitude
Bedtime
Waketime
Sleep duration
Std. movement
Yesterday’s sleep quality
Discussion
Sleep detection
Sleep quality
inference
Слайд 17
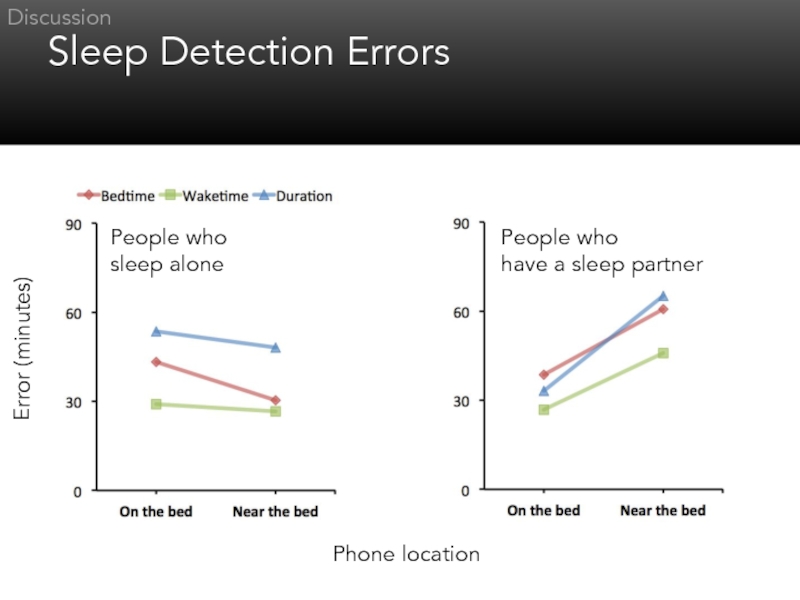
Sleep Detection Errors
Discussion
People who
sleep alone
People who
have a sleep partner
Phone location
Error (minutes)
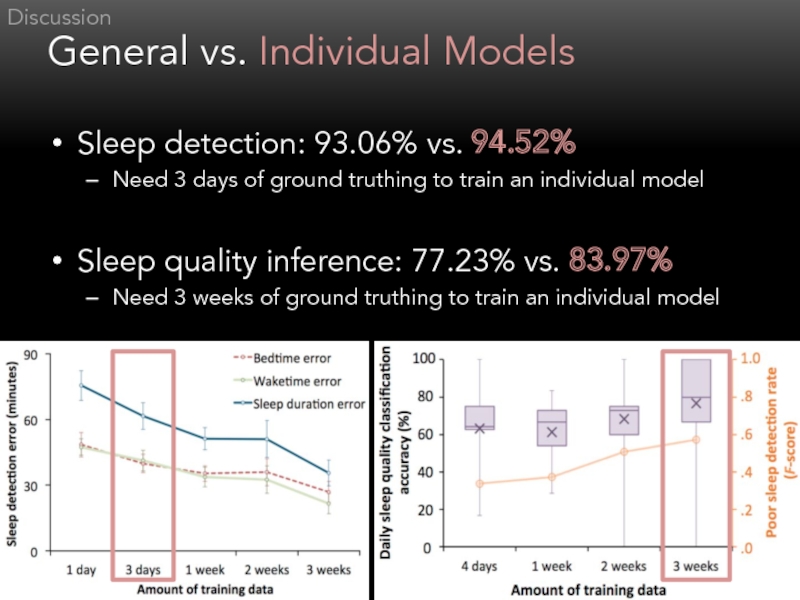
Слайд 18General vs. Individual Models
Sleep detection: 93.06% vs. 94.52%
Need 3 days of
Sleep quality inference: 77.23% vs. 83.97%
Need 3 weeks of ground truthing to train an individual model
Discussion
Слайд 19Limitations
Subjective vs. objective sleep quality
“How was your sleep last night? Rate
People tend to over / underestimate their sleep
Small sample size of poor-quality sleep
Discussion
Слайд 20Thanks!
More info at cmuchimps.org
or email loomlike@cs.cmu.edu
Special thanks to:
DARPA, Google
Слайд 24Modeling: Data Processing
Rational for “10 minutes”
Level of granularity when participants report
Median sleep latency = 10.9 minutes
90,097 windows, 711 not-sleep and 728 sleep segments
…
Sound
Motion
10-minute window
Sleep
Sleep
Not-sleep
Not-sleep
Bedtime
Waketime
Слайд 25Sleep Detection & Quality Inference
Modeling
…
Sound
Motion
10-minute window
Sleep
…0011000001010000011111111011010100001010000100000…
Слайд 26Infer Other Contexts
Sleep alone vs. with others
84.2%
Phone on the bed vs.
91.9%
