- Главная
- Разное
- Дизайн
- Бизнес и предпринимательство
- Аналитика
- Образование
- Развлечения
- Красота и здоровье
- Финансы
- Государство
- Путешествия
- Спорт
- Недвижимость
- Армия
- Графика
- Культурология
- Еда и кулинария
- Лингвистика
- Английский язык
- Астрономия
- Алгебра
- Биология
- География
- Детские презентации
- Информатика
- История
- Литература
- Маркетинг
- Математика
- Медицина
- Менеджмент
- Музыка
- МХК
- Немецкий язык
- ОБЖ
- Обществознание
- Окружающий мир
- Педагогика
- Русский язык
- Технология
- Физика
- Философия
- Химия
- Шаблоны, картинки для презентаций
- Экология
- Экономика
- Юриспруденция
Smartwatches: Past, Present and Future презентация
Содержание
- 1. Smartwatches: Past, Present and Future
- 2. @gregswan SVP @ Weber Shandwick Brand Innovation Consumer Marketing Digital/Mobile Strategy Strategic Partnerships
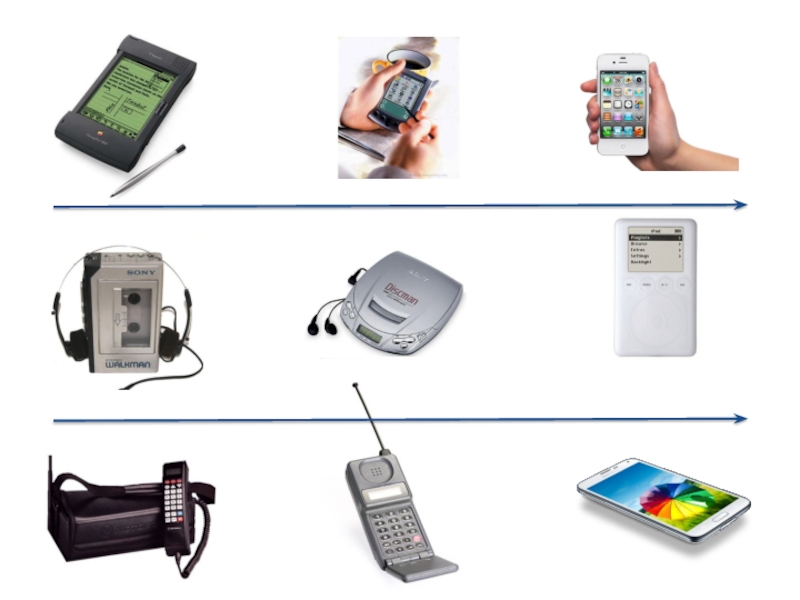
- 3. Why do we have such an obsession with smartwatch tech? Drawn by Nick O’Brien
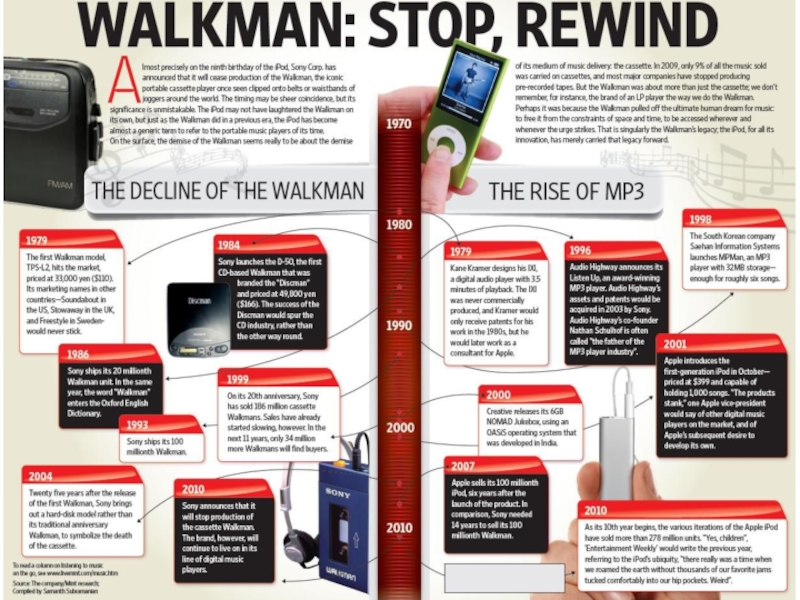
- 4. 1942 1979 1982 Future
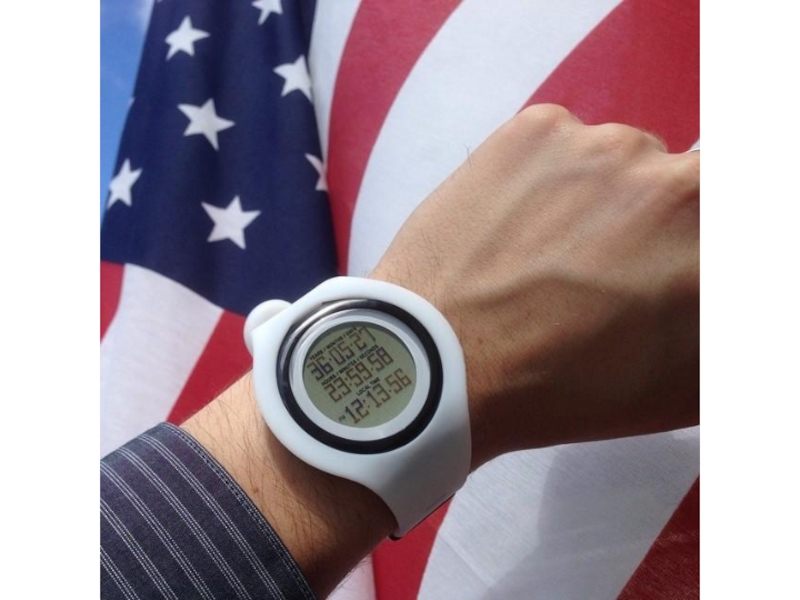
- 5. ..to this
- 6. …but actually this?
- 7. 3 –pronged approach to understanding where we’re
- 8. Ubiquity of Mobile
- 9. Smartphones Have Revolutionized Consumer Behavior, Disrupted Countless Industries
- 10. MOBILE USAGE AS % OF WEB
- 11. Internet Ad =$43B Mobile Ad =$7.1B
- 12. “VISUAL WEB” SOCIAL NETWORKS: UNIQUE TREND,
- 13. TOP FACEBOOK NEWS PUBLISHERS, 4/14 TOP
- 14. WHAT CONNECTED DEVICE OWNERS ARE DOING
- 15. 132 117 181 110 DAILY DISTRIBUTION
- 16. if you can measure it, someone
- 17. history of self-tracking "quantified self” coined
- 18. The movement to incorporate wearable technology as
- 19. sousveillance inverse surveillance, by recording an activity
- 20. “QSers” don’t just self-track; they also interrogate
- 21. “Dancy is connected to at least
- 22. the adoption of quantified self In
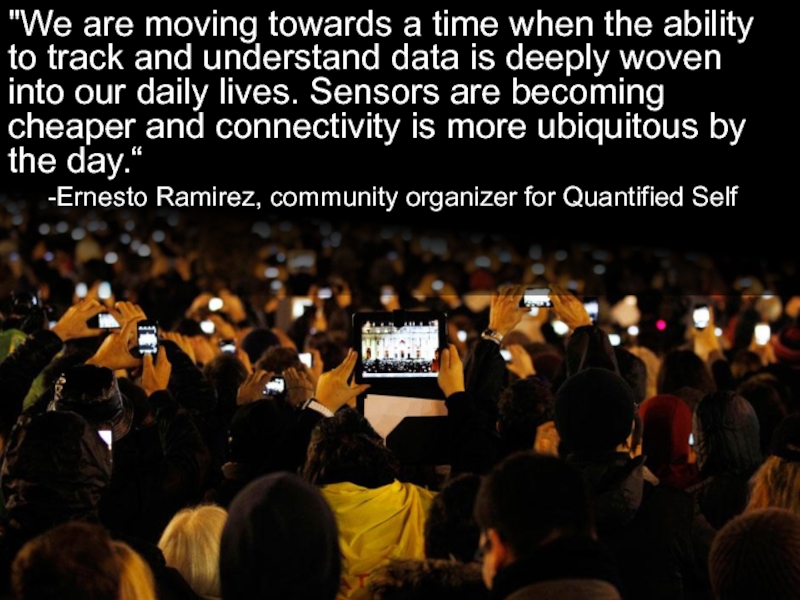
- 23. "We are moving towards a time
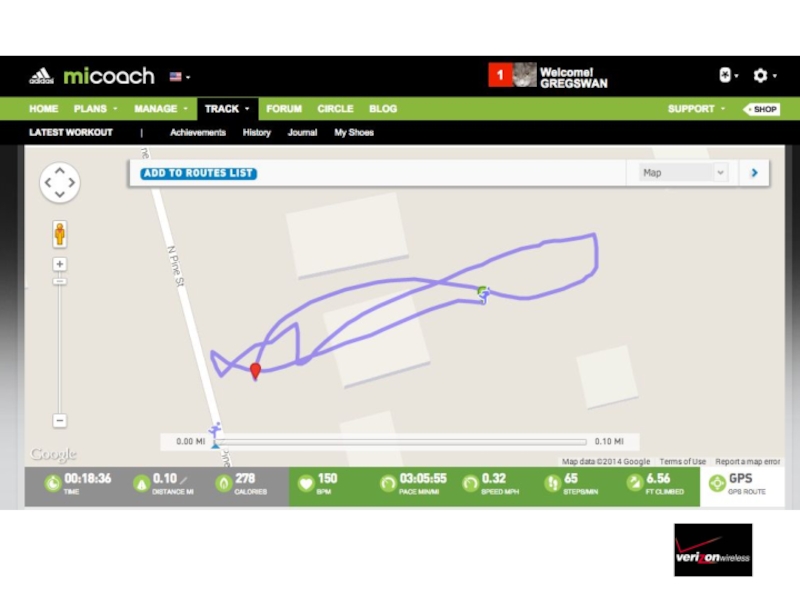
- 24. how does it work? Tracking inputs and
- 25. Quantified Self Today One-off
- 26. (via Sonny Vu, Misfit Wearables)
- 27. centralized dashboards
- 28. limitations No common platform: every device tracks
- 29. Sits and Spikes Data ownership and portability
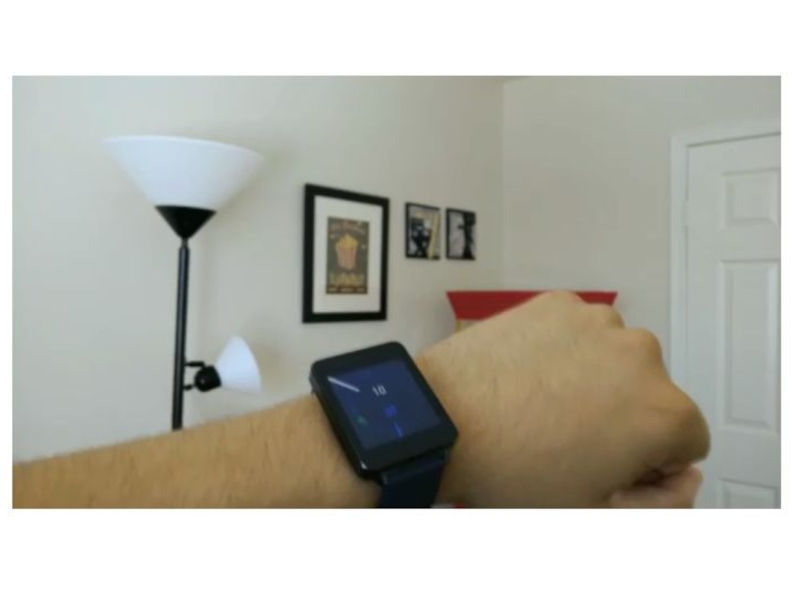
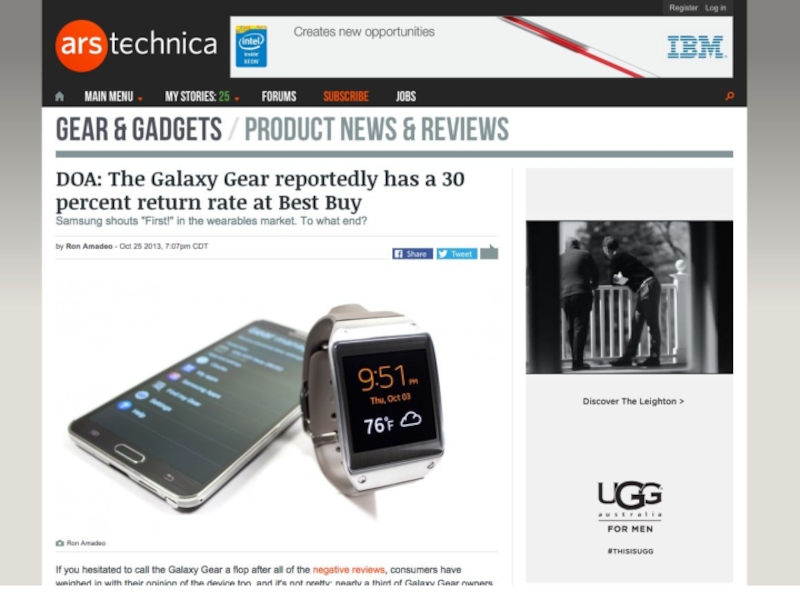
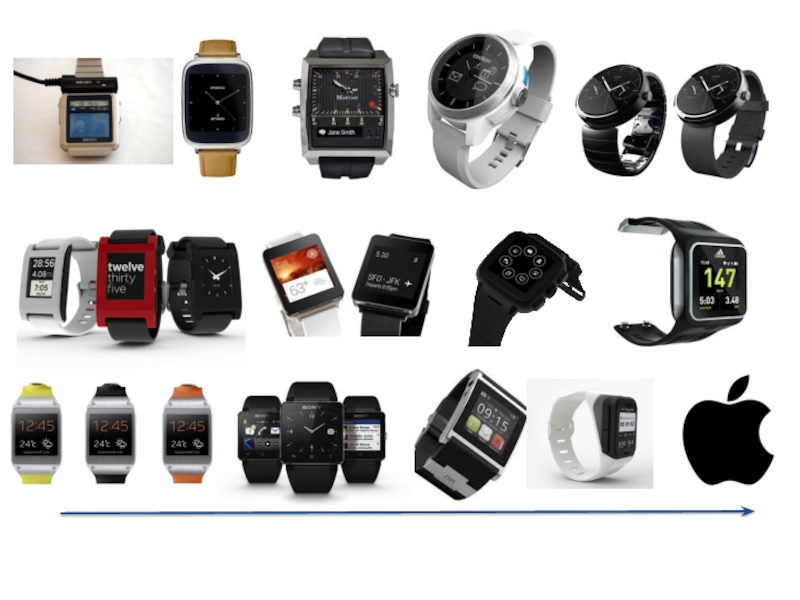
- 30. Smartwatches Today – And Tomorrow (literally)
- 34. 2013 SmartWatch Industry 40 Companies had smartwatches
- 35. 2013 Market Share for SmartWatch Industry
- 36. Consumer Insights/Primary Uses
- 37. Corporations + Startups Brands + Consumers
- 50. Apple’s impact on entering the industry
- 54. Where are we headed? Let’s discuss… Utility/Social
- 55. thank you.

Слайд 2@gregswan
SVP @ Weber Shandwick
Brand Innovation
Consumer Marketing
Digital/Mobile Strategy
Strategic Partnerships


Слайд 73 –pronged approach to understanding where we’re at in the smart
Ubiquity of Mobile
Quantified Self
Smartwatches Today


Слайд 10
MOBILE USAGE AS % OF WEB USAGE BY REGION, 5/14
11%
19%
6%
17%
8%
16%
23%
37%
38%
18%
12%
17%
14%
25%
Source: Mary
Mobile accounts for 25% of all web usage

Слайд 11
Internet Ad
=$43B
Mobile Ad
=$7.1B
% OF TIME SPENT IN MEDIA VS. % ADVERTISING
% OF TOTAL MOBILE CONSUMPTION TIME OF ADVERTISING SPENDING
~$30B+
Opportunity in USA
Source: Mary Meeker, Internet Trends, May 2014
Smartphones are the Primary Screen in U.S. & China
The eyeballs, and money are following.

Слайд 12
“VISUAL WEB” SOCIAL NETWORKS: UNIQUE TREND, USA, 3/11-2/14
USA UNIQUE VISITORS (MM)
DESKTOP
MULTI-PLATFORM
Source: Mary Meeker, Internet Trends, May 2014
Rich Content & its Sharing is Rising Rapidly
DESKTOP ONLYMULTI-PLATFORMSource: Mary Meeker, Internet")
Слайд 13
TOP FACEBOOK NEWS PUBLISHERS, 4/14
TOP TWITTER NEWS PUBLISHERS, 4/14
# OF INTERACTIONS
# OF SHARES (MM)
Source: Mary Meeker, Internet Trends, May 2014
Facebook & Twitter are Still King (and Queen)
# OF SHARES (MM)Source:")
Слайд 14
WHAT CONNECTED DEVICE OWNERS ARE DOING WHILE WATCHING TV, USA
Source: Mary
84% of mobile owners use devices during TV Time

Слайд 15
132
117
181
110
DAILY DISTRIBUTION OF SCREEN MINUTES ACROSS COUNTRIES (MINS)
132
117
181
110
99
143
174
115
89
161
170
59
113
146
149
66
69
160
168
69
147
103
151
43
131
80
193
39
114
123
165
35
78
96
167
95
102
99
189
43
115
126
127
63
111
122
119
70
98
158
98
66
104
114
106
30
148
97
111
55
132
65
174
33
125
102
132
37
124
97
122
53
111
109
132
39
93
103
163
32
96
95
162
31
95
132
90
61
127
94
144
14
129
77
137
36
104
97
124
51
95
106
98
52
98
112
90
48
125
68
135
15
134
83
79
30
89
85
109
34
Smartphones = Most Viewed
Source: Mary Meeker, Internet Trends, May 2014
1321171811109914317411589161170591131461496669160168691471031514313180193391141231653578 961679510299189431151261276311112211970981589866104114 106 30148971115513265174331251021323712497122531111091323993103163329695162319513290611279414414129771373610497124519510698529811290481256813515134837930898510934Smartphones = Most Viewed Medium GloballySource: Mary Meeker,")
Слайд 16
if you can measure it, someone will, and that somebody should
Quantified Self

Слайд 17
history of self-tracking
"quantified self” coined in 2007 by Wired Magazine editors
“a

Слайд 18The movement to incorporate wearable technology as a means to collect
Utilize quantifiable data to better understand oneself, one’s health and one’s limitations
Growth driven by affordability and widespread implementation of sensors
Popularized recently by fitness-related products Nike FuelBand, FitBit, Jawbone Up and more
Also called Body-Hacking, or Lifelogging
The Quantified Self

Слайд 19sousveillance
inverse surveillance, by recording an activity by way of portable, personal
a form of volunteer autoethnography

Слайд 20“QSers” don’t just self-track; they also interrogate the experiences, methods and
-Whitney Erin Boesel, Cyberology

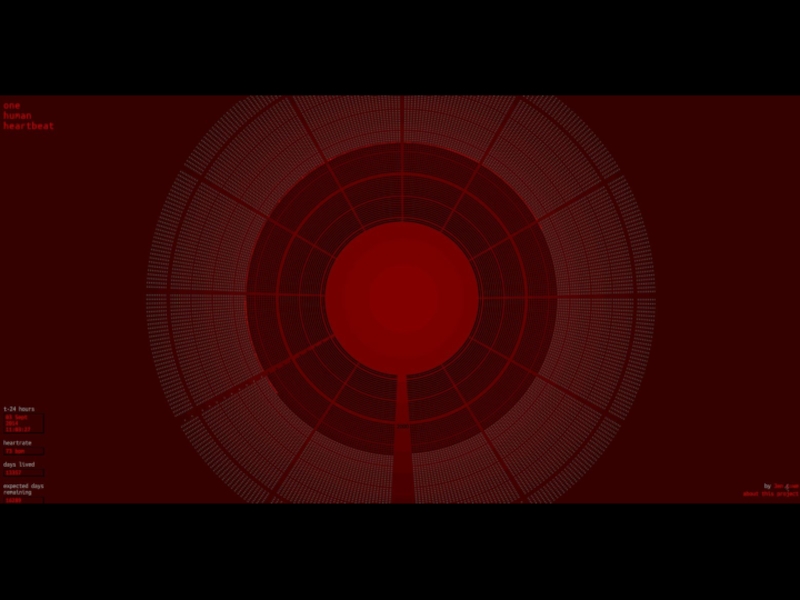
Слайд 21
“Dancy is connected to at least three sensors all day, every
the extreme…

Слайд 22
the adoption of quantified self
In total, 7 in 10 U.S. adults
60% of U.S. adults say they track their weight, diet or exercise routine.
33% of U.S. adults track health indicators or symptoms, like blood pressure, blood sugar, headaches or sleep patterns.
12% of U.S. adults track health indicators or symptoms for a loved one.
21% of Americans are tracking themselves using technology -- more than active Twitter users (Pew, Feb. 13)
Apple Stores sell more than 20 self-tracking products.
There will be an estimated 485 million wearable computing devices shipped by 2018 (ABI Research, Feb. 2013). For reference, 700 million smartphones were shipped in 2012.
Source: Pew Research, “Tracking Health”

Слайд 23
"We are moving towards a time when the ability to track
Слайд 24how does it work?
Tracking inputs and aggregating data around:
Performance
Health
Environment
Then:
Aggregate
Sync via web and apps
Compete against friends
Share

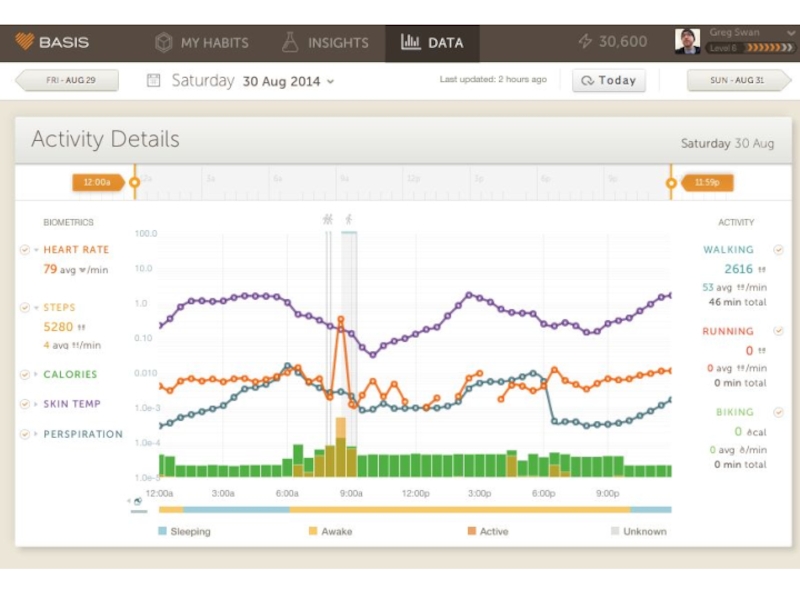
Слайд 25
Quantified Self Today
One-off wearables
Unattractive
Little integration
Practically no data ownership
(via Sonny Vu, Misfit
")
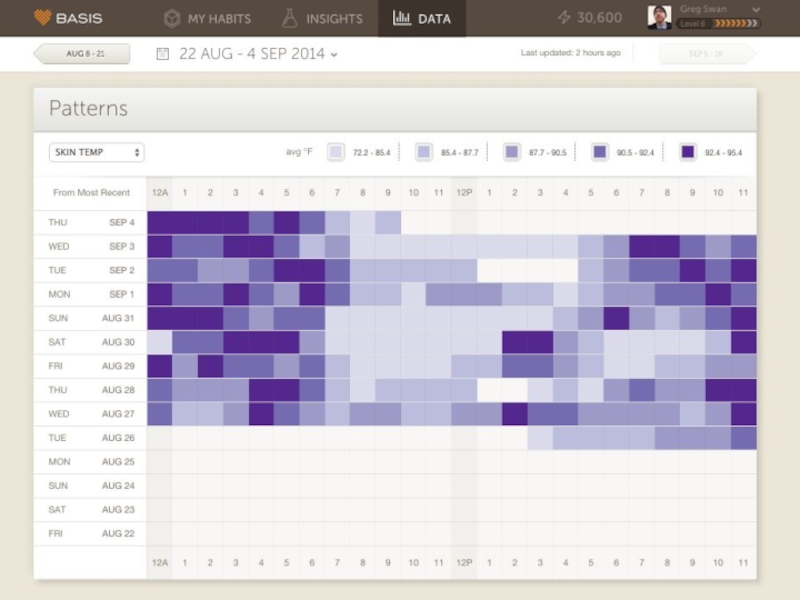
Слайд 26
(via Sonny Vu, Misfit Wearables)
(via Sonny Vu, Misfit Wearables)
Quantified Self Tomorrow
Integrated
Unnoticeable
Cross- device integration
Increased data ownership
(via Sonny Vu, Misfit Wearables)Quantified Self TomorrowIntegrated into clothing/techUnnoticeableCross- device integrationIncreased")

Слайд 28limitations
No common platform: every device tracks differently.
Medical limitations: measuring activity
Sharing: Only 34% of trackers share their data with someone else – which means that the other 66% are not as motivated as they could be.
Data ownership: users rarely have access to their raw data.
Privacy: emerging technology requires emerging regulations.

Слайд 29Sits and Spikes
Data ownership and portability is extremely limiting
Smart devices are
My primary doctor doesn’t care about all of this “health” data I’ve stored up
Gamification inspires action
Warm months = more activity

")

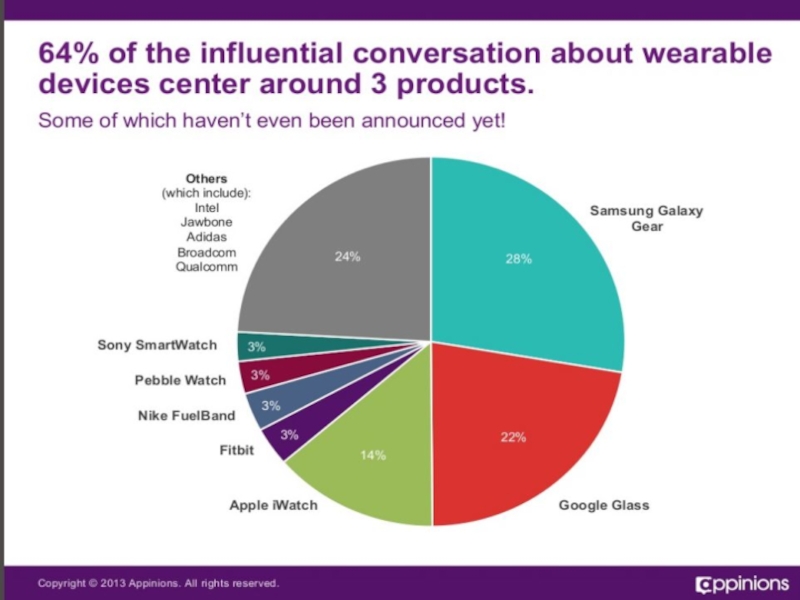
Слайд 342013 SmartWatch Industry
40 Companies had smartwatches on the market in 2013,
A total of 3.1 million units were sold compared to 0.3 million in 2012, expected to grow to 15 million in 2014
The average price for a smartwatch sold in 2013 was USD $225
Market Value in 2013 was $700 million USD
In 2014 the Industry is expected to grow to $2.5 billion USD


Слайд 37
Corporations + Startups
Brands + Consumers
Employees + Markets
Machines + Media + The
Multiple stakeholders impacting smartwatch adoption


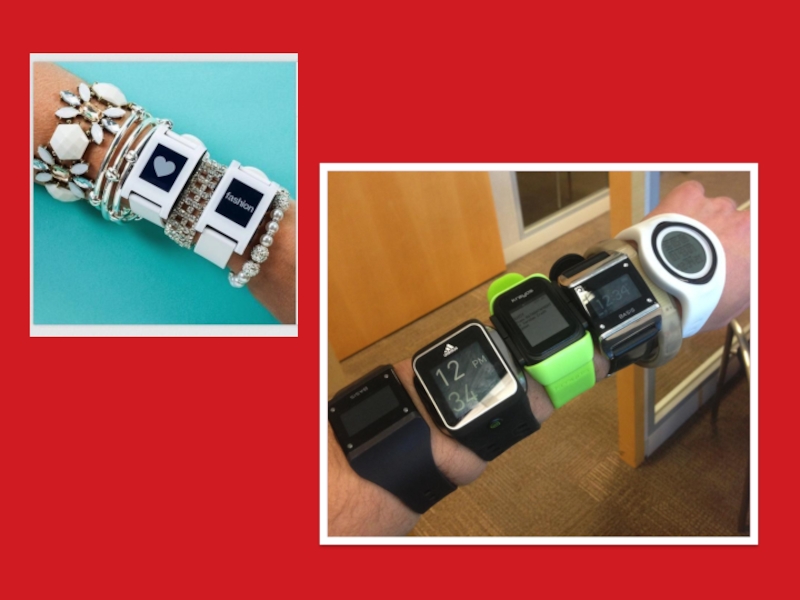
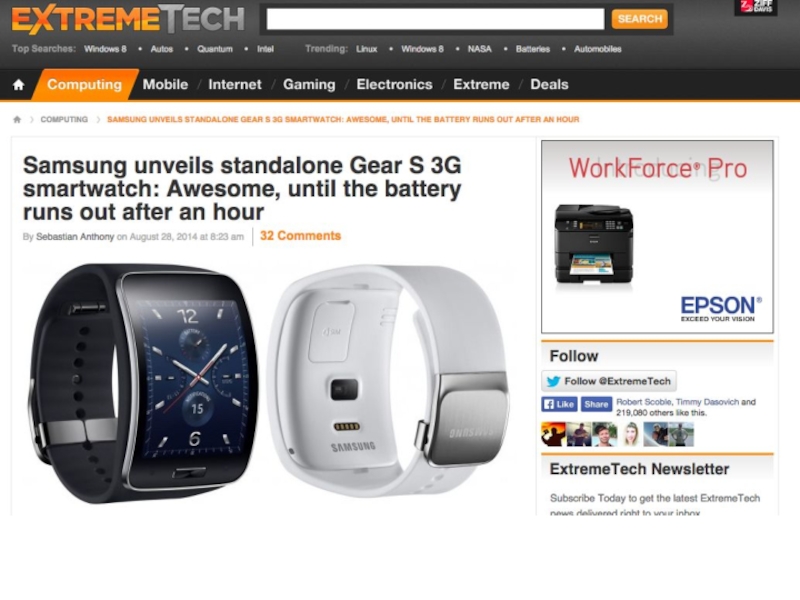


Слайд 54Where are we headed? Let’s discuss…
Utility/Social Stigma
Price
Battery Life
Privacy (e.g., GPS and
Data Ownership
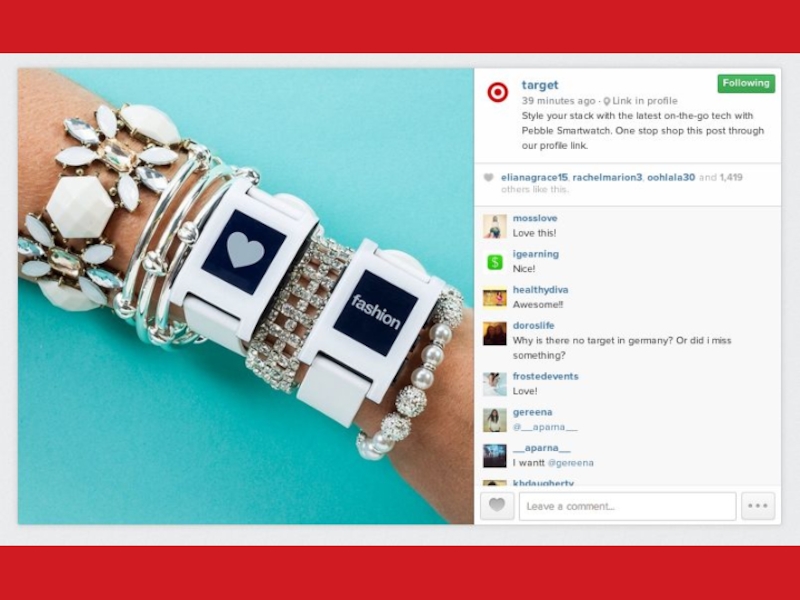
Fashion
App Store
Standalone vs Slave
Special Uses vs. Mainstream Uses (e.g., kids, seniors)
Apple (e.g., iPad utility post-launch)
Geeky toys becoming mainstream (e.g., phones, fax, computers, drones)
Data OwnershipFashionApp StoreStandalone vs")