- Главная
- Разное
- Дизайн
- Бизнес и предпринимательство
- Аналитика
- Образование
- Развлечения
- Красота и здоровье
- Финансы
- Государство
- Путешествия
- Спорт
- Недвижимость
- Армия
- Графика
- Культурология
- Еда и кулинария
- Лингвистика
- Английский язык
- Астрономия
- Алгебра
- Биология
- География
- Детские презентации
- Информатика
- История
- Литература
- Маркетинг
- Математика
- Медицина
- Менеджмент
- Музыка
- МХК
- Немецкий язык
- ОБЖ
- Обществознание
- Окружающий мир
- Педагогика
- Русский язык
- Технология
- Физика
- Философия
- Химия
- Шаблоны, картинки для презентаций
- Экология
- Экономика
- Юриспруденция
Probability-2 презентация
Содержание
- 1. Probability-2
- 2. Recap Why should we learn
- 3. Today’s Objectives Counting subsets of a
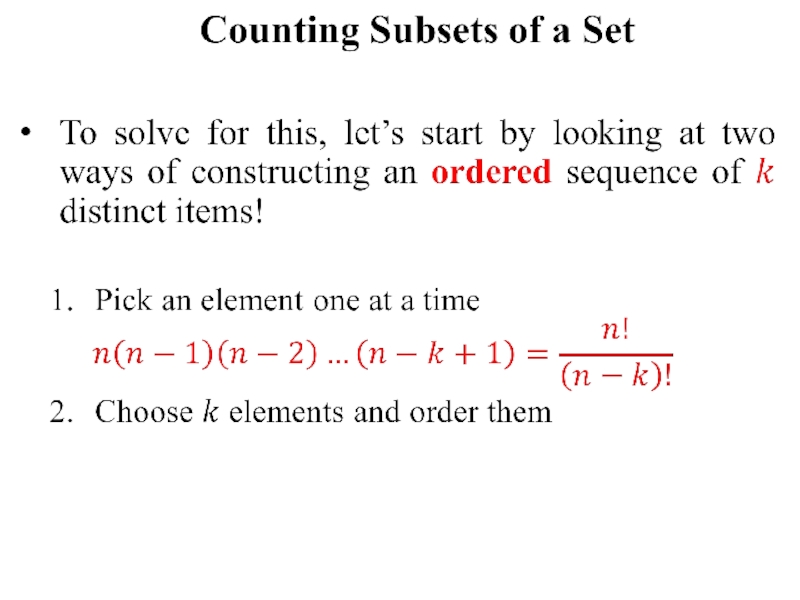
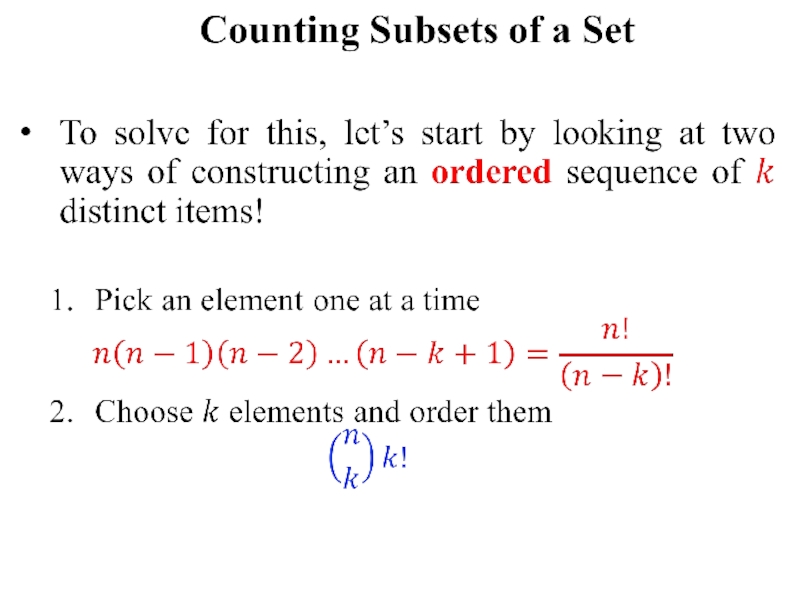
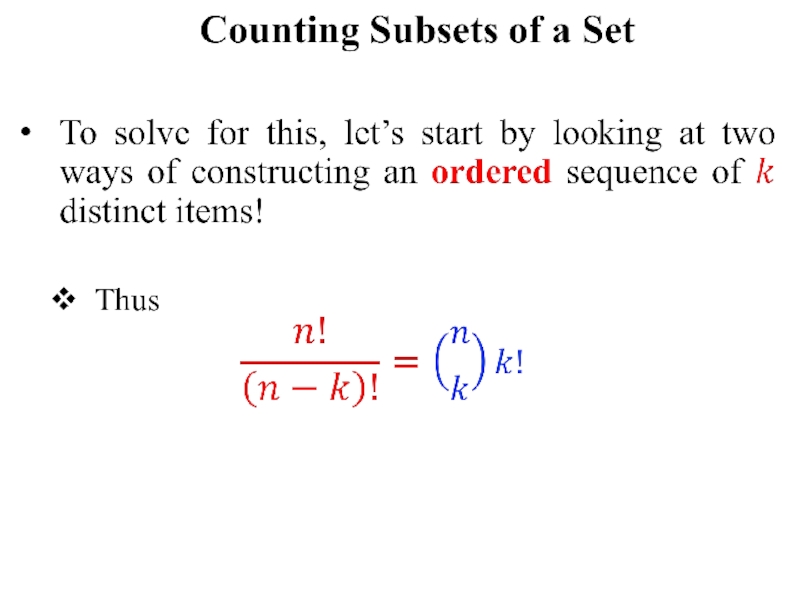
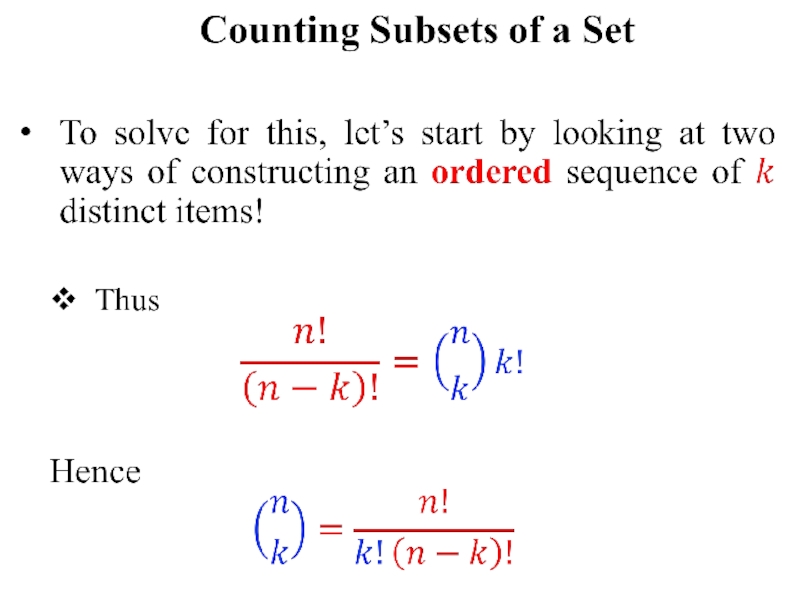
- 4.
- 5. Why Count Subsets of Set? Example:
- 6.
- 7.
- 8.
- 9.
- 10.
- 11.
- 12.
- 13.
- 14. Conditional Probability An Interesting Kind
- 15. Biryani ☺
- 16. Conditional Probability Of
- 17. Conditional Probability What is
- 18. Conditional Probability So, how to answer the “Food Court” question?
- 19.
- 20. Why Do Tree Diagrams Work?
- 21. Why Do Tree Diagrams Work?
- 22. Why Do Tree Diagrams Work?
- 23. Why Do Tree Diagrams Work?
- 24. Why Do Tree Diagrams Work?
- 25.
- 26.
- 27.
- 28.
- 29.
- 30.
- 31. What Independence Really Means? Are these
- 32. What Independence Really Means? Thus being dependent is completely different from being disjoint!
- 33. What Independence Really Means? Thus being
- 34. What Independence Really Means? Thus being
- 35. Independence---Cont. Generally, independence is
- 36. Total Probability Theorem Take a look
- 37. Total Probability Theorem Take a look
- 38. Total Probability Theorem Take a look
- 39. Total Probability Theorem Take a look
- 40. Total Probability Theorem Take a look
- 41. Total Probability Theorem Where do we use it? Baye’s Theorem!
- 42. Medical Testing Problem Let’s
- 43. Probability Tree A: The
- 44.
- 45. Conditional Probability Tree---Cont. Surprising, Right!
- 46.
- 47.
- 48. Bayes Theorem---Cont. A Posteriori Probabilities
- 49.
- 50.
- 51.
- 52.
- 53.
- 54. Random Variables So far,
- 55. Random Variables But most
- 56. Random Variables---Cont. “Random Variables”
- 57. Random Variables---Cont. “Random Variables”
- 58.
- 59.
- 60.
- 61.
- 62.
- 63. Expected Value Weighted average
- 64.
- 65.
- 66. Variance Consider the
- 67. Variance Let’s compute the expected return for both games:
- 68.
- 69.
- 70.
- 71. Variance Game A:
- 72. Variance For game
- 73. Standard Deviation
- 74. Standard Deviation
- 75. Standard Deviation
Слайд 1Discrete Mathematics
PROBABILITY-II
Adil M. Khan
Professor of Computer Science
Innopolis University
“The Consequences of an Act Affect the Probability of its Occurring Again!” - B. F. Skinner -

Слайд 2Recap
Why should we learn Probability?
Formulating questions in terms of probability
Building
the probability model
Four-step Method
Uniform sample spaces
Counting
Four-step Method
Uniform sample spaces
Counting

Слайд 3Today’s Objectives
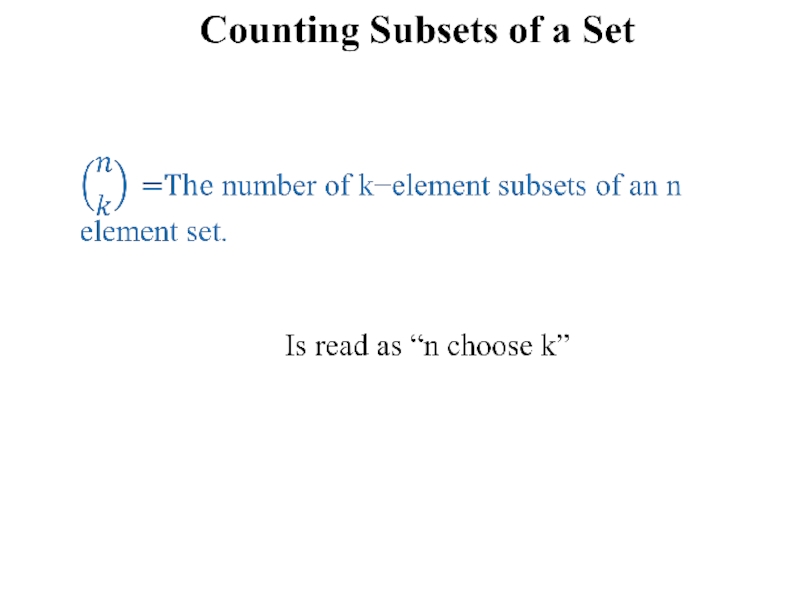
Counting subsets of a set
Conditional Probability
Independence
Total Probability Theorem
Baye’s theorem
Random variables

Слайд 5Why Count Subsets of Set?
Example:
Suppose we select 5 cards at
random from a deck of 52 cards.
What is the probability that we will end up having a full house?
Doing this using the possibility tree will take some effort.
What is the probability that we will end up having a full house?
Doing this using the possibility tree will take some effort.


Слайд 14Conditional Probability
An Interesting Kind of Probability Question
“After this lecture, when
I go to UI canteen for lunch, what is the probability that today they will be serving biryani (my favorite food)?


Слайд 16Conditional Probability
Of course, the vast majority of the food that
the cafeteria prepares is NEITHER delicious NOR is it ever biryani (low probability).
But they do cook dishes that contain rice, so now the question is “what’s the probability that food from UI is delicious given that it contains rice?”
This is called “Conditional Probability”
But they do cook dishes that contain rice, so now the question is “what’s the probability that food from UI is delicious given that it contains rice?”
This is called “Conditional Probability”

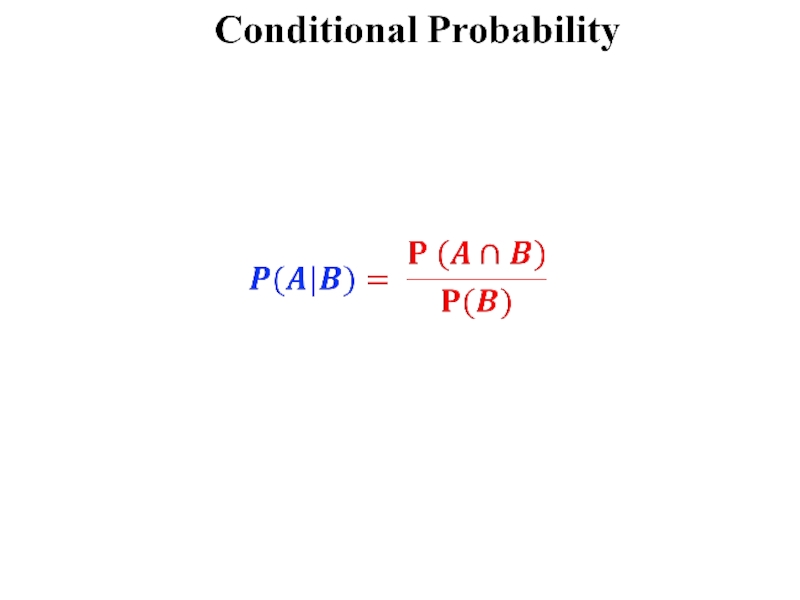
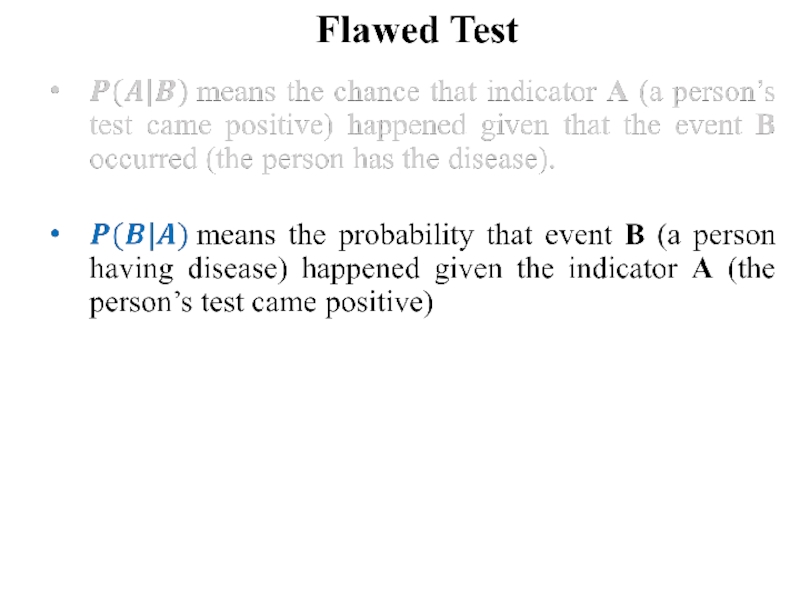
Слайд 17Conditional Probability
What is the probability that it will rain this
afternoon, given that it is cloudy this morning?
What is the probability that two rolled dice sum to 10, given that both are odd?
Written as
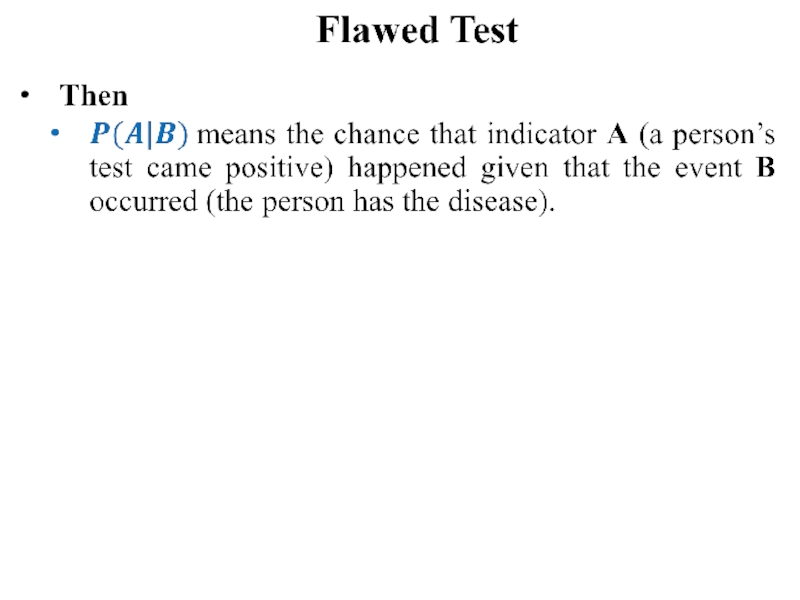
P(A|B) – denotes the probability of event A, given that event B happens.
What is the probability that two rolled dice sum to 10, given that both are odd?
Written as
P(A|B) – denotes the probability of event A, given that event B happens.


Слайд 20Why Do Tree Diagrams Work?
We have solved multiple probability problems using
tree diagrams
Let’s think for a moment about “why do tree diagrams work?”
The answer involves conditional probabilities
In fact, the probabilities that we have been recording on the edges of a tree diagram are conditional probabilities
More generally, on each edge of a tree diagram, we record that the probability that the experiment proceeds along that part, given that it reaches the parent vertex

Слайд 21Why Do Tree Diagrams Work?
Let’s look the upper most edges of
the probability tree for the previous example!


Слайд 24Why Do Tree Diagrams Work?
“So the Product Rule is the formal
justification for multiplying edge probabilities in a probability tree to get outcome probabilities”


Слайд 32What Independence Really Means?
Thus being dependent is completely different from being
disjoint!

Слайд 33What Independence Really Means?
Thus being dependent is completely different from being
disjoint!
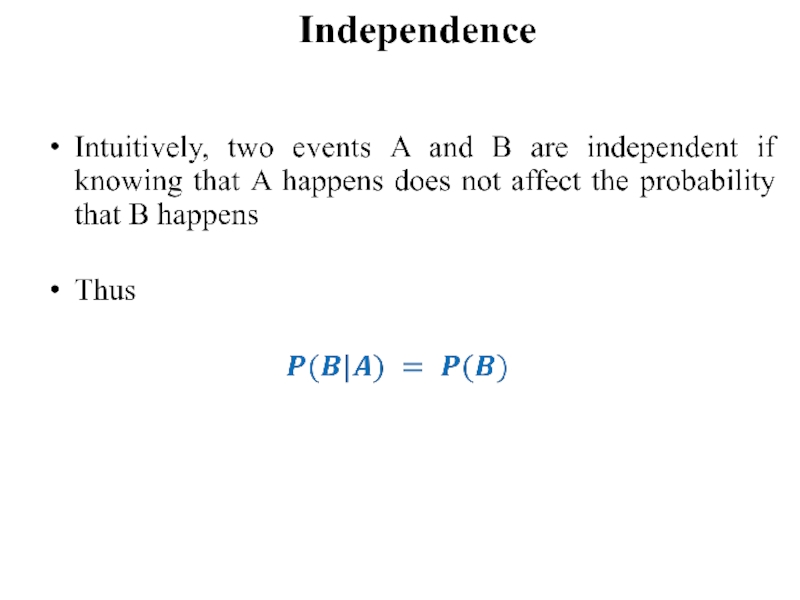
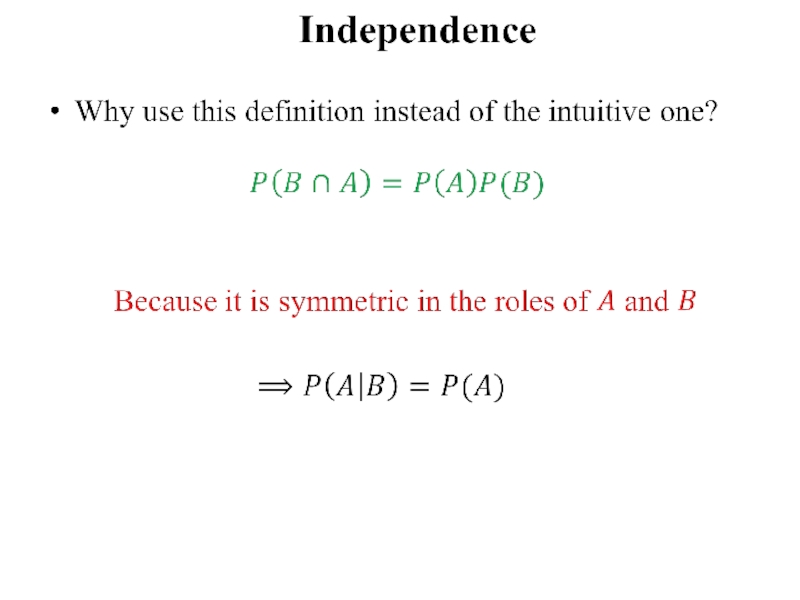
Two events are independent, if the occurrence of one does not change our belief about the occurrence of the other.
Two events are independent, if the occurrence of one does not change our belief about the occurrence of the other.

Слайд 34What Independence Really Means?
Thus being dependent is completely different from being
disjoint!
Two events are independent, if the occurrence of one does not change our belief about the occurrence of the other.
Typically the case when the two events are determined by two physically distinct and non-interacting processes.
Getting heads in a coin toss and snowing outside
Two events are independent, if the occurrence of one does not change our belief about the occurrence of the other.
Typically the case when the two events are determined by two physically distinct and non-interacting processes.
Getting heads in a coin toss and snowing outside

Слайд 35Independence---Cont.
Generally, independence is an assumption that we assume when modeling
a phenomenon.
The reason we so-often assume statistical independence is not because of its real-world accuracy
It is because of its armchair appeal: It makes the math easy
How does it do that?
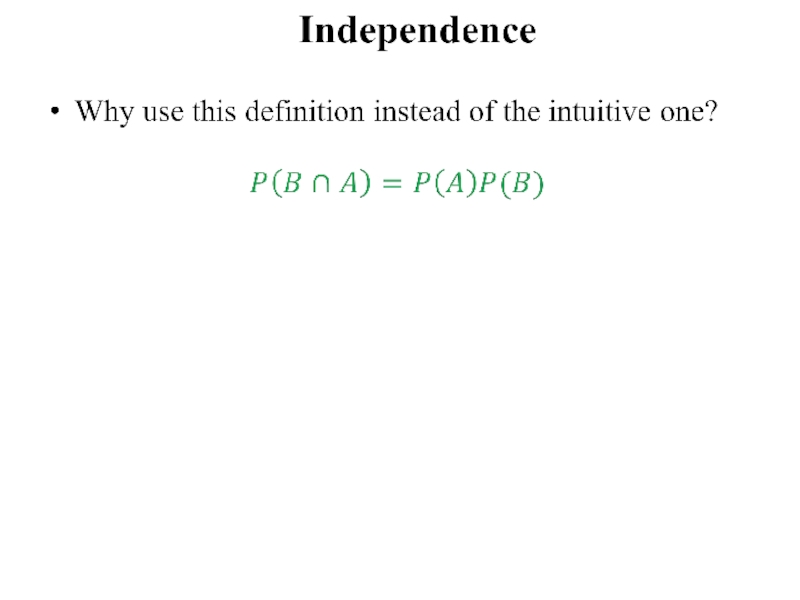
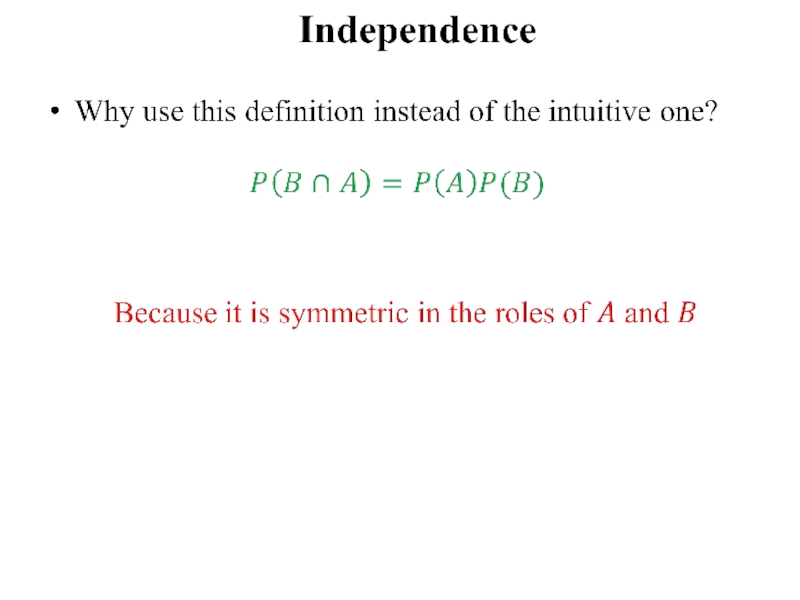
By splitting a compound probability into a product of individual probabilities.
(Note for TAs: Include example of Independence assumption in tutorials)
The reason we so-often assume statistical independence is not because of its real-world accuracy
It is because of its armchair appeal: It makes the math easy
How does it do that?
By splitting a compound probability into a product of individual probabilities.
(Note for TAs: Include example of Independence assumption in tutorials)


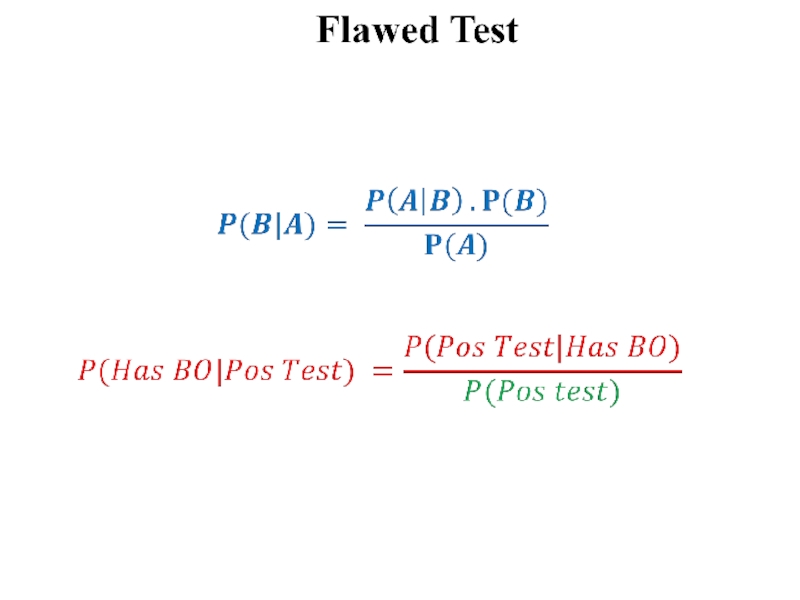
Слайд 42Medical Testing Problem
Let’s assume a “not-so-perfect” test for a medical condition
called BO suffered by 10% of the population
The test is not-so-perfect because
90% of the tests come positive if you have BO
70% of the tests come negative if you don’t have BO
If we randomly test a person for BO, and if the test comes positive, what is the probability that the person has BO.
The test is not-so-perfect because
90% of the tests come positive if you have BO
70% of the tests come negative if you don’t have BO
If we randomly test a person for BO, and if the test comes positive, what is the probability that the person has BO.

Слайд 43Probability Tree
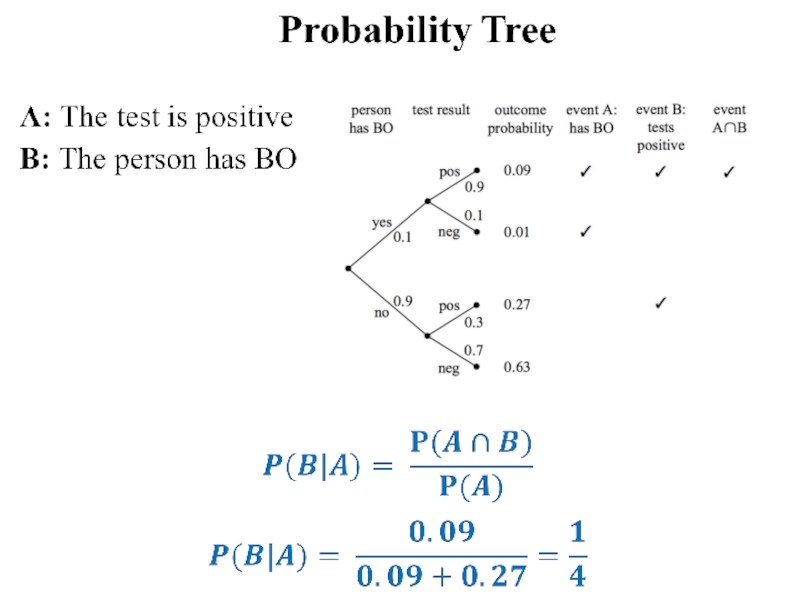
A: The test came positive
B: The person has BO
BO
is suffered by 10% of the population
If someone has BO, there is a 90% chance that the test will be positive
If someone does not have the condition, there is a 70% chance that the test will be negative.
If someone has BO, there is a 90% chance that the test will be positive
If someone does not have the condition, there is a 70% chance that the test will be negative.

Слайд 45Conditional Probability Tree---Cont.
Surprising, Right!
So if the test comes out positive,
the person has only 25% chance of having the diseases
Conclusion:
Tests are flawed
Tests give test probabilities not the real probabilities
Conclusion:
Tests are flawed
Tests give test probabilities not the real probabilities


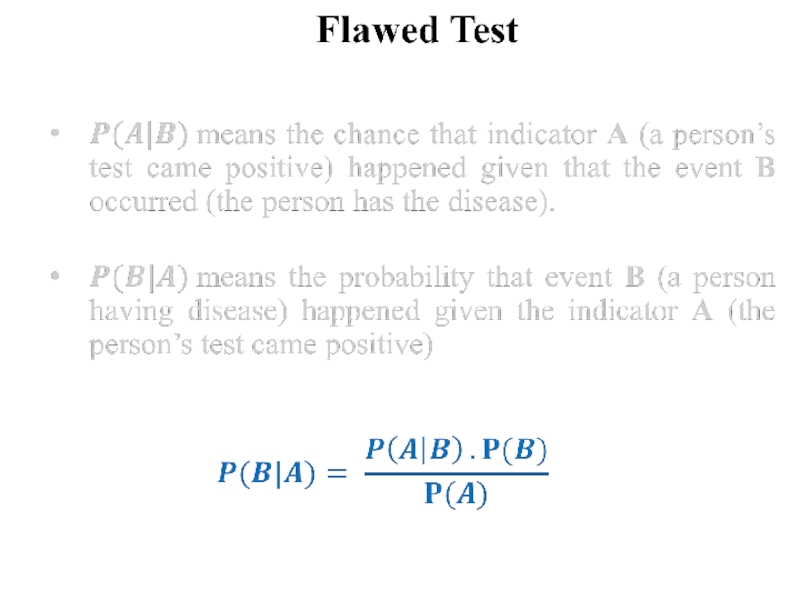
Слайд 48Bayes Theorem---Cont.
A Posteriori Probabilities
For example:
The probability that it
was cloudy this morning, given that it rained in the afternoon.
Mathematically speaking, there is no difference between a posteriori probability and a conditional probability.
Mathematically speaking, there is no difference between a posteriori probability and a conditional probability.

Слайд 54Random Variables
So far, we focused on probabilities of events.
For
example,
The probability that someone wins the Monty Hall Game
The probability that someone has a rare medical condition given that he/she tests positive
The probability that someone wins the Monty Hall Game
The probability that someone has a rare medical condition given that he/she tests positive

Слайд 55Random Variables
But most often, we are interested in knowing more
than this.
For example,
How many players must play Monty Hall Game before one of them finally wins?
How long will a weather certain condition last?
How long will I loose gambling with a strange coin all night?
To be able to answer such questions, we have to learn about “Random Variables”
For example,
How many players must play Monty Hall Game before one of them finally wins?
How long will a weather certain condition last?
How long will I loose gambling with a strange coin all night?
To be able to answer such questions, we have to learn about “Random Variables”

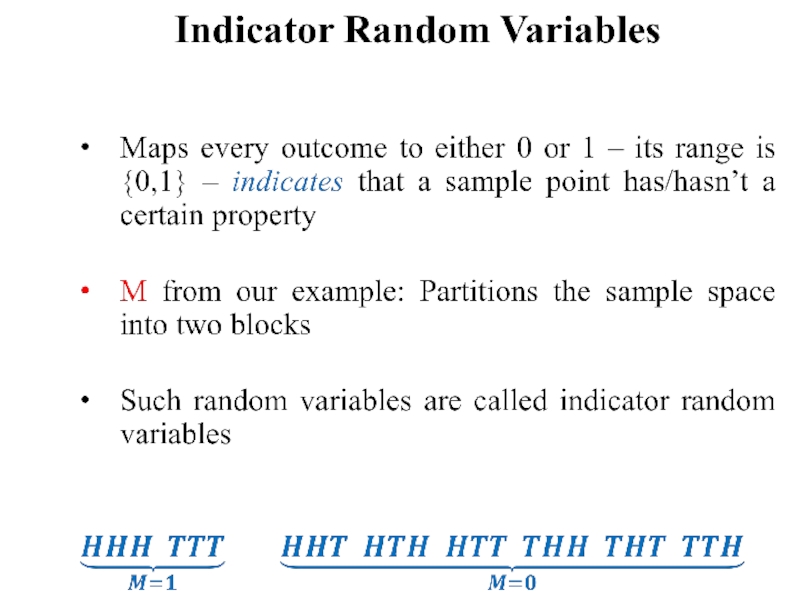
Слайд 56Random Variables---Cont.
“Random Variables” are nothing but “functions”
A random variable R on
a probability space is a function whose domain is the sample space and whose range is a set of Real numbers.

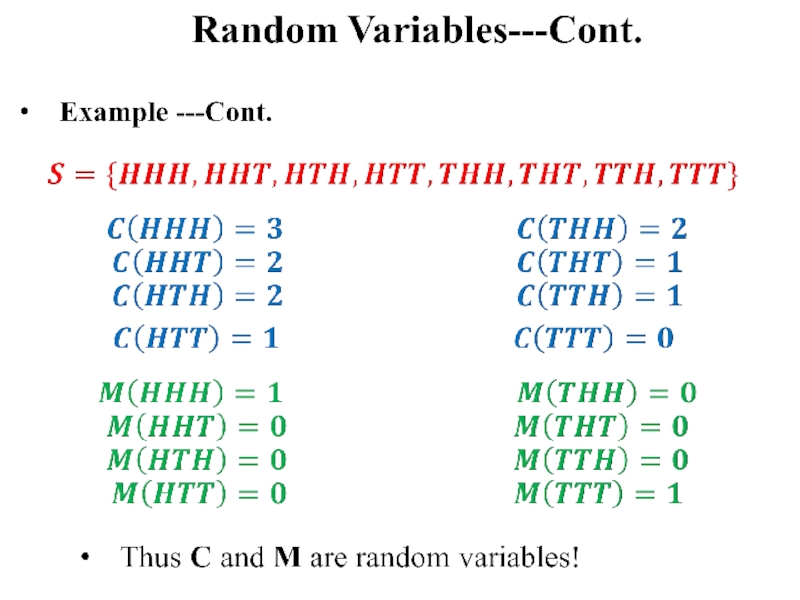
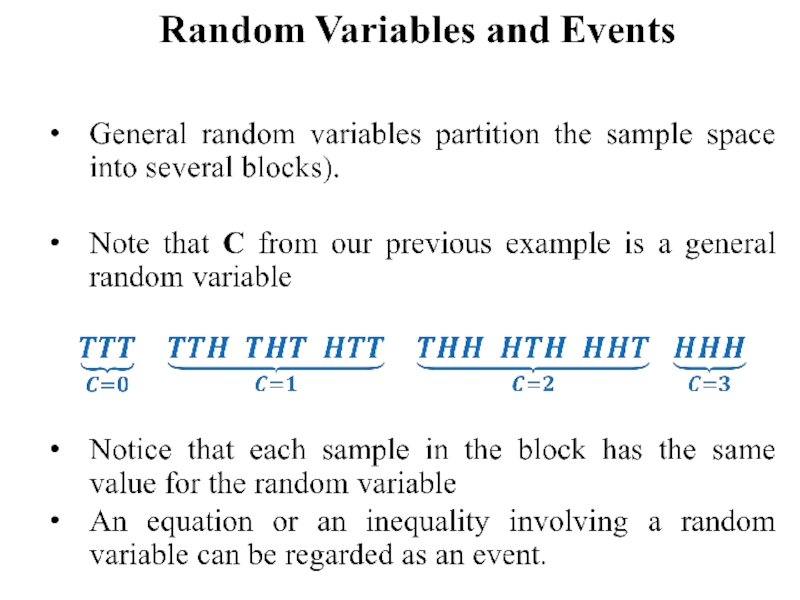
Слайд 57Random Variables---Cont.
“Random Variables” are nothing but “functions”
A random variable R on
a probability space is a function whose domain is the sample space and whose range is a set of Real numbers.
Let’s look at this example!
Tossing three independent coins and noting
C: the number of heads that appear
M: 1 if all are heads or tails, 0 otherwise
If we look closely, we will see that C and M are in fact functions that map every outcome of the experiment to a number.
Let’s look at this example!
Tossing three independent coins and noting
C: the number of heads that appear
M: 1 if all are heads or tails, 0 otherwise
If we look closely, we will see that C and M are in fact functions that map every outcome of the experiment to a number.

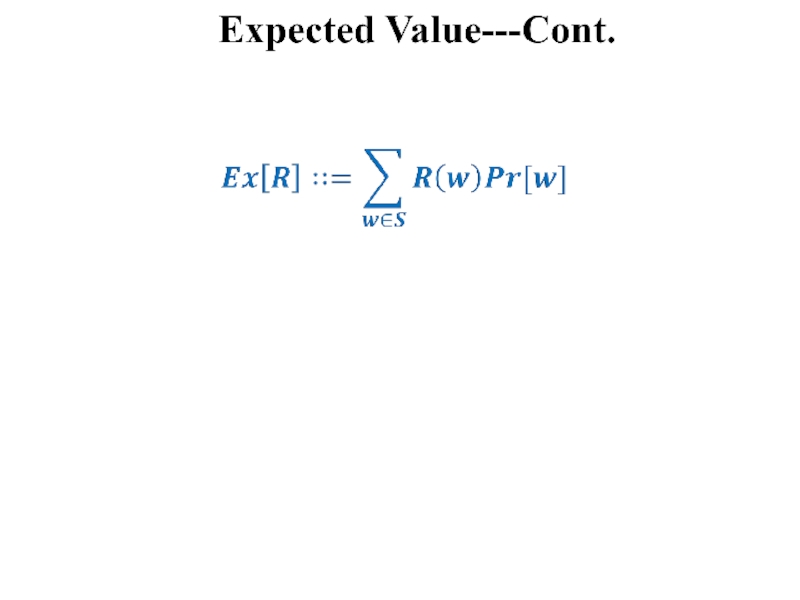
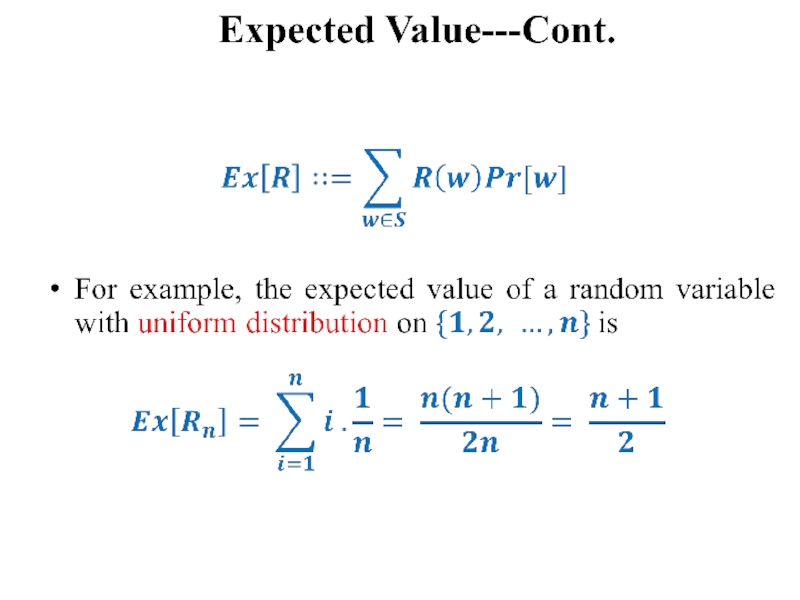
Слайд 63Expected Value
Weighted average of the values of a random variable
Provides a
central point for the distribution of the values of a random variable
We can solve many problems using the notion of expected values
How many heads are expected to appear if a coin is tossed 100 times?
What is the expected number of comparisons used to find an element in a list using the linear search?
We can solve many problems using the notion of expected values
How many heads are expected to appear if a coin is tossed 100 times?
What is the expected number of comparisons used to find an element in a list using the linear search?

Слайд 66Variance
Consider the following two gambling games:
Game A: You win $2
with probability 2/3 and lose $1 with probability 1/3.
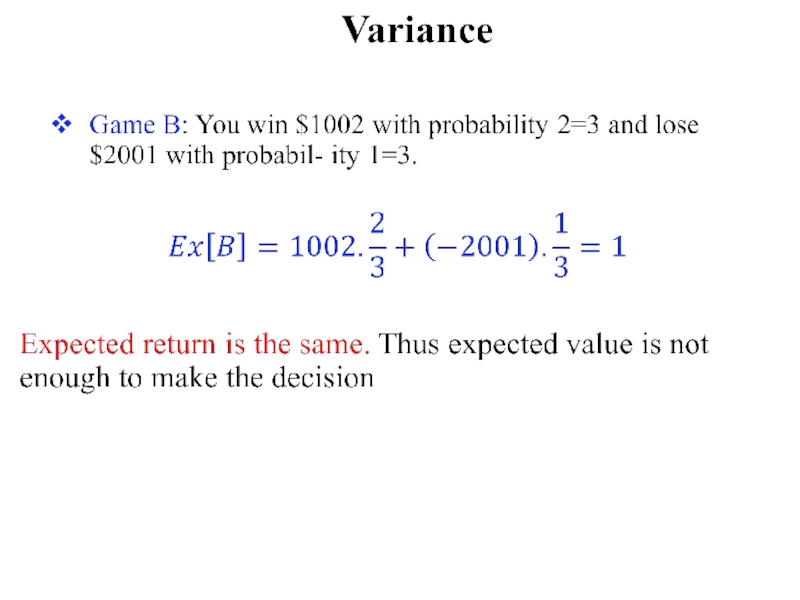
Game B: You win $1002 with probability 2=3 and lose $2001 with probabil- ity 1=3.
Which game would you play?
Game B: You win $1002 with probability 2=3 and lose $2001 with probabil- ity 1=3.
Which game would you play?


Слайд 72Variance
For game B
Intuitively, this means that the payoff in Game
A is usually close to the expected value of $1, but the payoff in Game B can deviate very far from this expected value – high variance means high risk.

Слайд 73Standard Deviation
Because of its definition in terms of the square
of a random variable, the variance of a random variable may be very far from a typical deviation from the mean.

Слайд 74Standard Deviation
For example, in Game B above, the deviation from
the mean is 1001 in one outcome and -2002 in the other. But the variance is a whopping 2,004,002
The problem is with the “units” of variance.
If a random variable is in dollars, then the expected value is also in dollars, but the variance is in square dollars
The problem is with the “units” of variance.
If a random variable is in dollars, then the expected value is also in dollars, but the variance is in square dollars