- Главная
- Разное
- Дизайн
- Бизнес и предпринимательство
- Аналитика
- Образование
- Развлечения
- Красота и здоровье
- Финансы
- Государство
- Путешествия
- Спорт
- Недвижимость
- Армия
- Графика
- Культурология
- Еда и кулинария
- Лингвистика
- Английский язык
- Астрономия
- Алгебра
- Биология
- География
- Детские презентации
- Информатика
- История
- Литература
- Маркетинг
- Математика
- Медицина
- Менеджмент
- Музыка
- МХК
- Немецкий язык
- ОБЖ
- Обществознание
- Окружающий мир
- Педагогика
- Русский язык
- Технология
- Физика
- Философия
- Химия
- Шаблоны, картинки для презентаций
- Экология
- Экономика
- Юриспруденция
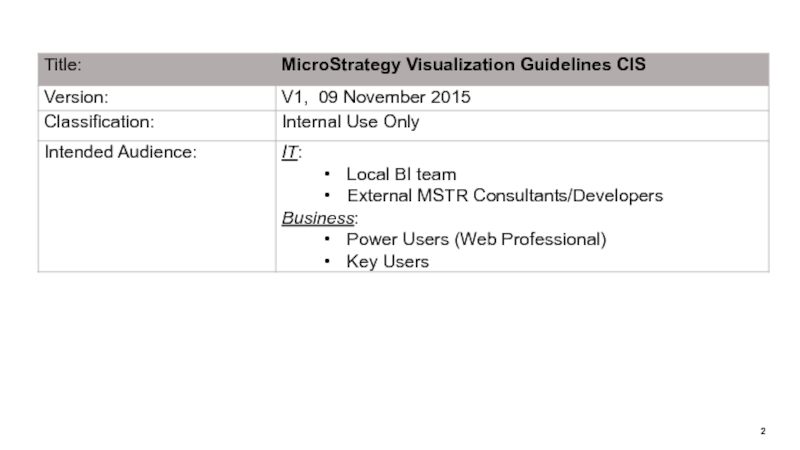
Microstrategy visualization guidelines презентация
Содержание
- 1. Microstrategy visualization guidelines
- 3. REVISION HISTORY
- 4. GOAL OF THIS DOCUMENT The Visualization Guideline
- 5. GENERAL SETTINGS Font: Trebuchet
- 6. DASHBOARD DESIGN PRINCIPLES
- 7. MSTR DOCUMENT TEMPLATE Every Dashboard
- 8. NAVIGATION ICONS In the MSTR documents the
- 9. HEADER FONTS Trebuchet 14pt Bold #FFFFFF Trebuchet
- 10. AREA Orange line on the top of
- 11. GRIDS Thresholds To high lite of groups
- 12. Graph HEADER Orange line 3px on the
- 13. Traffic light colors for thresholds (background)
- 14. AREA Rectangle ##FAFAFA Line thick #C0C0C0 FILTERS
- 15. AREA Rectangle #FFFFFFF No lines FILTERS
- 16. Trebuchet 12pt Regular #FFFFFF Lines 3px #F8BB00 #F8BB00 SELECTORS
- 17. Trebuchet 8- 12pt Regular #333333 Lines 3px
- 18. HEADER SIZES
- 19. TITLE SIZES
- 20. HELP
- 21. OTHER SIZES
- 22. EXAMPLES
- 23. EXAMPLES
- 24. EXAMPLES


Слайд 4GOAL OF THIS DOCUMENT
The Visualization Guideline intends to describe standard ways
Dashboard development should become leaner and more efficient being able to use standard colors, fonts, rules aligned with the adidas Design and Usability team.
In the following document the following types of reports will be described:
Grid report
Dashboard = MSTR Document (MicroStrategy notion)
Visual Insight report
The Visualization guideline is considered a living document which should reflect always the latest status of data visualization.

Слайд 5GENERAL SETTINGS
Font:
Trebuchet MS as a default font of Microstrategy
Resolution:
Main format designed both for Web & iPad users: 1024 x 748 px
Mobile iPhone 5 & iPhone 6: 640 x 1116 px
* In some rare specific cases (e.g. big grid reports) we can create other formats not adapted for iPad (to be validated case by case!). Before creating it, make sure it will never be used at iPad.
Background:
Background of the dashboard should be white - Hex: #e2e2e2
Only elements that “matter” have a color (header, navigation buttons, selectors, data & grids)
Easy for printing on PDF & Paper


Слайд 7MSTR DOCUMENT TEMPLATE
Every Dashboard in MSTR should contain the following areas:
Title, Navigation and Selectors areas should be designed with standards for all Dashboards.
The Content area can differ per Use Case.
Link to MSTR template

Слайд 8NAVIGATION ICONS
In the MSTR documents the following icons (as buttons) should
Availability of Icons dependent on use case:
Home: Brings you back to the Landing page
Help: Provides an explanation on the current document
* Comment for Mobile only (tbc)
* Re-prompt (tbc)
Report: Provides an overview on related reports & documents (where applicable)
Filter: Used to indicate if there is a filter set in pop-up selector
See links to these Icons at next page
 should be used for Navigation")
Слайд 9HEADER
FONTS
Trebuchet 14pt Bold #FFFFFF
Trebuchet 8pt Bold #FFFFFF
ICONS
https://deheremap4312.emea.adsint.biz/MicroStrategy/_custom/cis/img/common/group_logo_alive.png
https://deheremap4312.emea.adsint.biz/MicroStrategy/_custom/cis/img/common/icon_home.png
https://deheremap4312.emea.adsint.biz/MicroStrategy/_custom/cis/img/common/icon_help.png
https://deheremap4312.emea.adsint.biz/MicroStrategy/_custom/cis/img/common/icon_comment.png
https://deheremap4312.emea.adsint.biz/MicroStrategy/_custom/cis/img/common/icon_report.png
https://deheremap4312.emea.adsint.biz/MicroStrategy/_custom/cis/img/common/filter_orange.png
COLORS
#6C6F70

Слайд 10AREA
Orange line on the top of rectangle #F8BB00
Rectangle #FFFFFF
Grid HEADER
VALUES AND
Trebuchet 14pt Regular #333333
Trebuchet 8-12pt Regular #FFFFFF
Color #2883BF
Thick #FFFFFF
Trebuchet 8-12pt Regular #333333
Banding #F6F6F6 (246,246,246)
Lines #E2E2E2
Use thin lines or banding to separate row\columns
Trebuchet 8-12pt Regular #FFFFFF
Background #6C6F70
GRIDS

Слайд 11GRIDS
Thresholds
To high lite of groups of columns use gray color or
For thresholds use colors from color palettes

Слайд 12Graph HEADER
Orange line 3px on the top of rectangle #F8BB00
Rectangle #FFFFFF
VALUES
Trebuchet 14pt Regular #333333
Trebuchet 8-12pt Regular #333333
Bar chart – use color from palette (see next page)
Trebuchet 8-12pt Regular #333333
Lines color #E6E6E6 (230,230,230)
Remove unnecessary lines
GRAPHS

Слайд 13Traffic light colors for thresholds
(background)
#f8696b
#ffeb84
#5abe7b
Color palette for Graphs
#75B6A4
#DFCC80
#769796
#345678
COLOR PALETTES
#fbaa77
#b1d580
#2B84BF
#3498DB
#7DBEEA
#9FCEED
#C1DFF3
RGB 248,
RGB 255, 235, 132
RGB 99, 190, 123
RGB 117,182,164
RGB 223,204,128
RGB 118,151,150
RGB 52,86,120
RGB43,132,191
RGB 52,152,219
RGB 125,190,234
RGB 159,206,237
RGB 193,223,243
RGB 251, 170, 119
RGB 177, 213, 128
 #f8696b#ffeb84#5abe7bColor palette for Graphs#75B6A4#DFCC80#769796#345678COLOR PALETTES#fbaa77#b1d580#2B84BF#3498DB#7DBEEA#9FCEED#C1DFF3RGB 248, 105, 107RGB 255, 235,")
Слайд 14AREA
Rectangle ##FAFAFA
Line thick #C0C0C0
FILTERS
Trebuchet 10pt Bold #333333
Trebuchet 9pt Regular #333333
FILTERS PANEL
If

Слайд 15AREA
Rectangle #FFFFFFF
No lines
FILTERS
FILTERS AT DASHBOARD PANEL
Trebuchet 10pt Regular #333333
Line color
Trebuchet 10pt Regular #333333
No Color (on iPad it’s Gray)


Слайд 17Trebuchet 8- 12pt Regular #333333
Lines 3px #C0C0C0
Background #E2E2E2
HELP
Color #6C6F70
Trebuchet 12 #FFFFFF
Color