- Главная
- Разное
- Дизайн
- Бизнес и предпринимательство
- Аналитика
- Образование
- Развлечения
- Красота и здоровье
- Финансы
- Государство
- Путешествия
- Спорт
- Недвижимость
- Армия
- Графика
- Культурология
- Еда и кулинария
- Лингвистика
- Английский язык
- Астрономия
- Алгебра
- Биология
- География
- Детские презентации
- Информатика
- История
- Литература
- Маркетинг
- Математика
- Медицина
- Менеджмент
- Музыка
- МХК
- Немецкий язык
- ОБЖ
- Обществознание
- Окружающий мир
- Педагогика
- Русский язык
- Технология
- Физика
- Философия
- Химия
- Шаблоны, картинки для презентаций
- Экология
- Экономика
- Юриспруденция
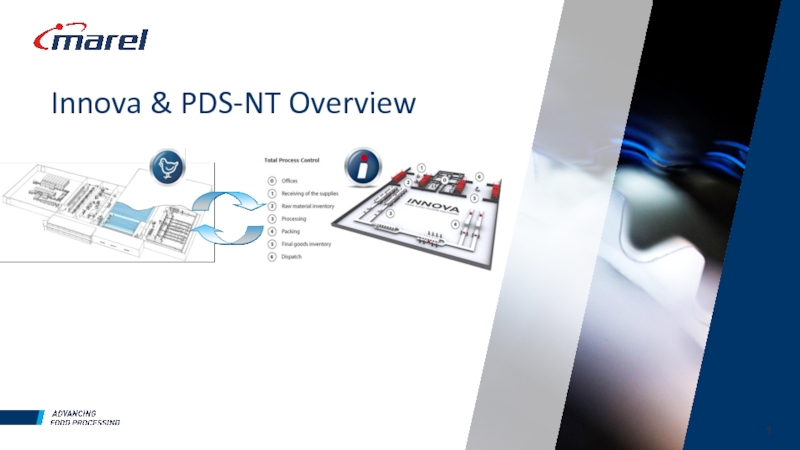
Innova & PDS-NT Overview презентация
Содержание
- 1. Innova & PDS-NT Overview
- 2. Tabel of content Why Innova & PDS-NT
- 3. Innova and PDS-NT: Why? Maximize added value
- 6. Effective and efficient product allocation Deliver your
- 7. Supply versus Demand Growing product assortment Flock
- 8. Supply ?? Demand
- 9. Tabel of content Why Innova & PDS-NT
- 10. Empowers food processors Device & Process Control
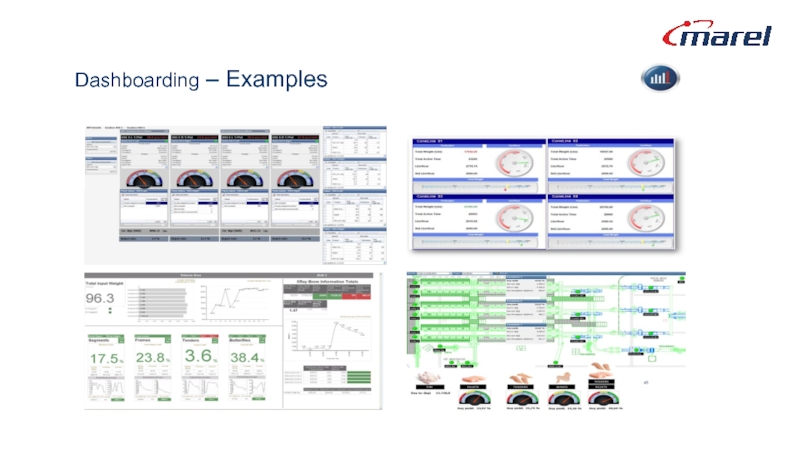
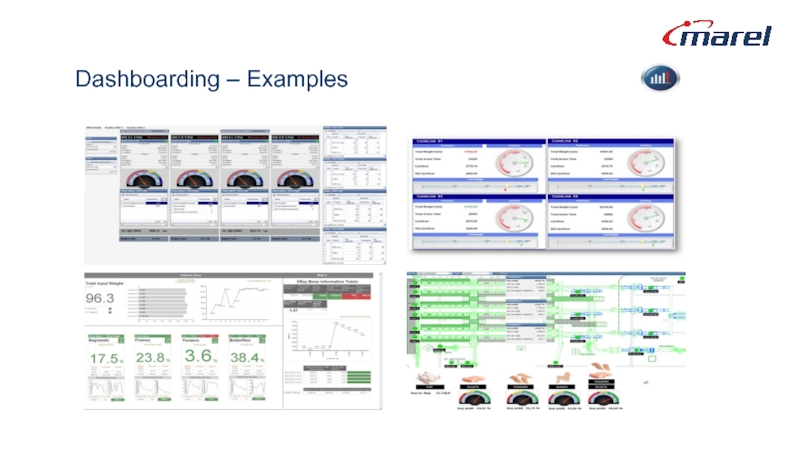
- 14. Dashboarding – Examples
- 15. Why Implement MES ? Specifically designed for
- 16. Integrated solutions – horizontal integration Linking processing steps together Prevent sub optimization
- 17. Integrated solutions – vertical integration Link with
- 18. Innova – Modules & Processes Grading Sensor-X
- 20. Innova base
- 21. Innova Administration Kernel of the Innova system
- 22. Innova Packing
- 23. Innova Packing Innova offers simple as well
- 24. Packing stations
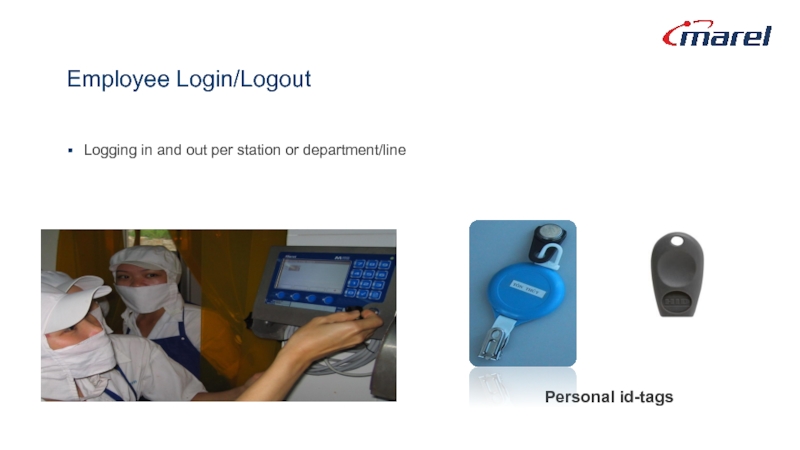
- 25. Personal id-tags Logging in and out per station or department/line Employee Login/Logout
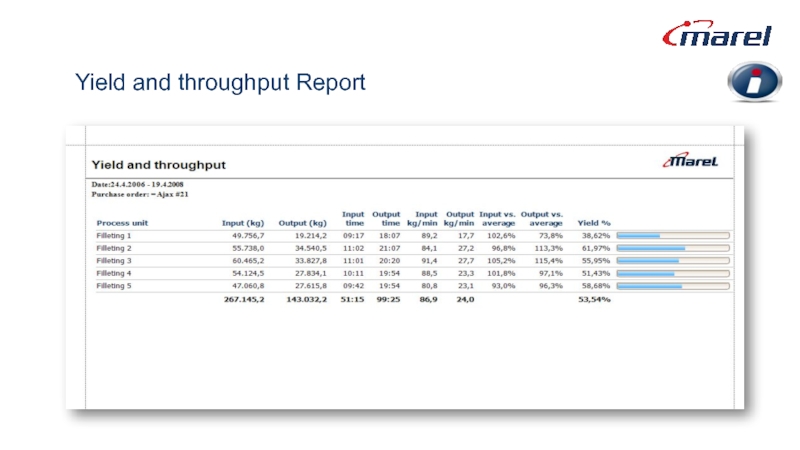
- 26. Yield and throughput Report
- 27. Innova Label management
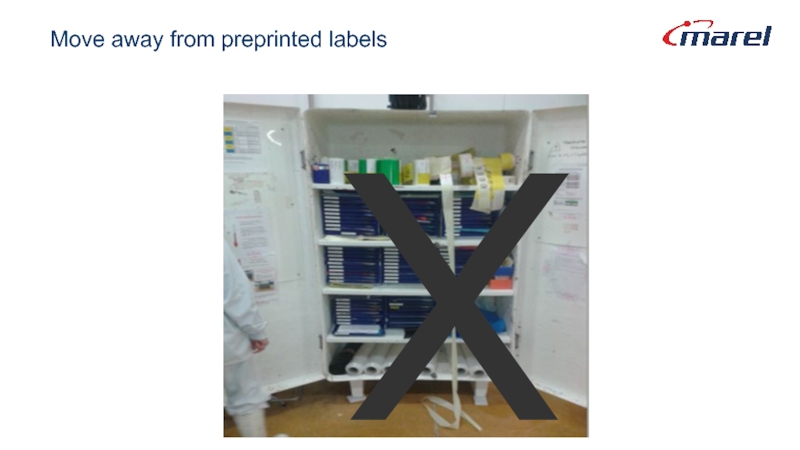
- 28. Move away from preprinted labels X
- 29. Main features Labeling Easy to design labels
- 30. Label designer – WYSIWYG and „drag & drop“
- 31. Printer support Intermec, Sato, Datamax & Zebra
- 32. Innova Grading & Batching
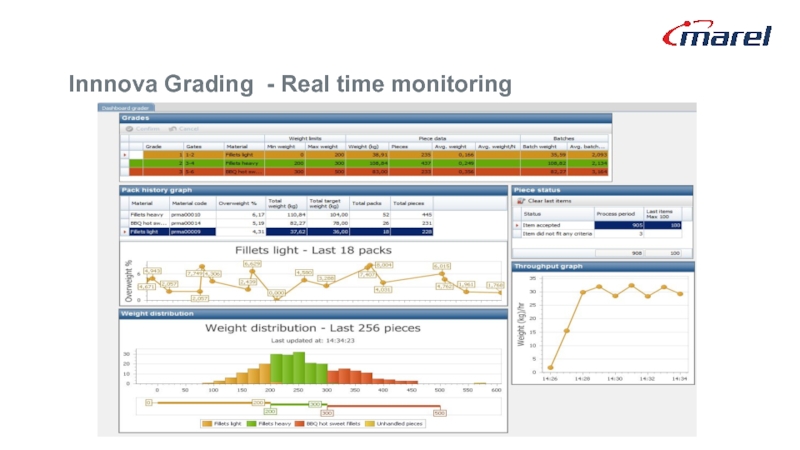
- 33. Innova Grading Main Purpose Controls and monitors
- 34. Innnova Grading - Real time monitoring
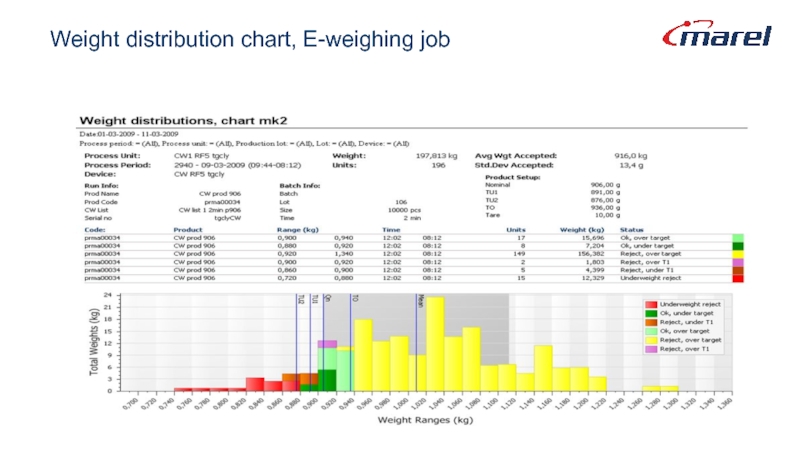
- 35. Innova Checkweighing
- 36. Key benefits Real-time monitoring allows for
- 37. E-weighing overview
- 38. Weight distribution chart, E-weighing job
- 39. Innova Weight Price Labeler
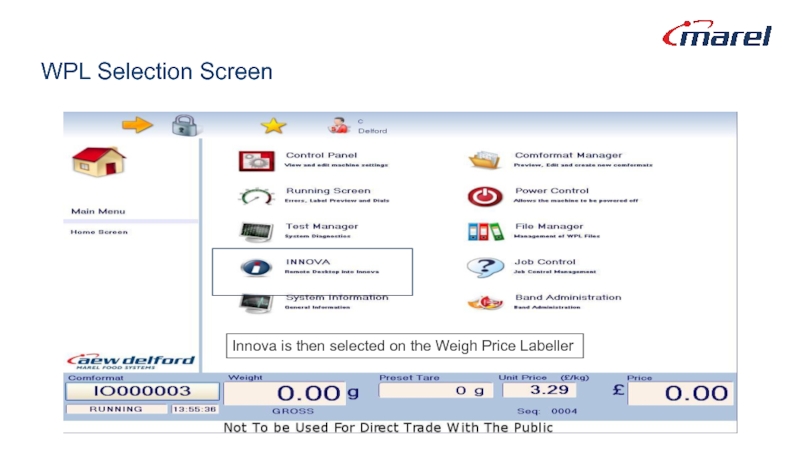
- 40. WPL Selection Screen Innova is then selected on the Weigh Price Labeller
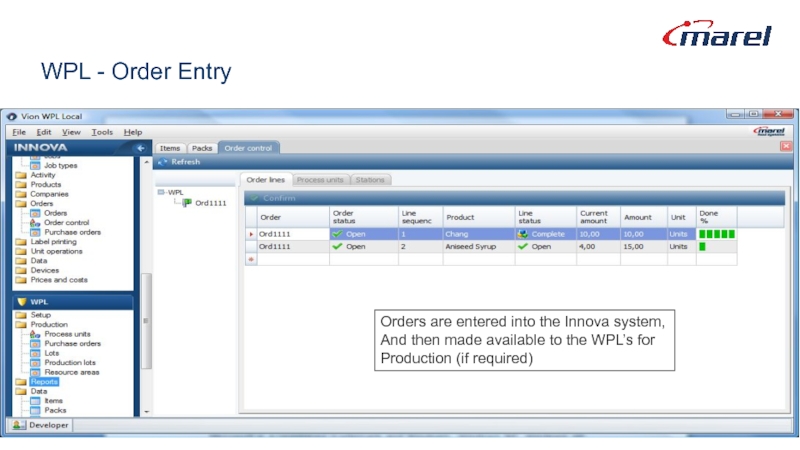
- 41. WPL - Order Entry Orders are entered
- 42. Order Entry The production order is then
- 43. In Production Screen on WPL If no
- 44. Individual Pack Records Individual pack records are
- 45. Innova Portioning
- 46. Main purpose Controls and monitors
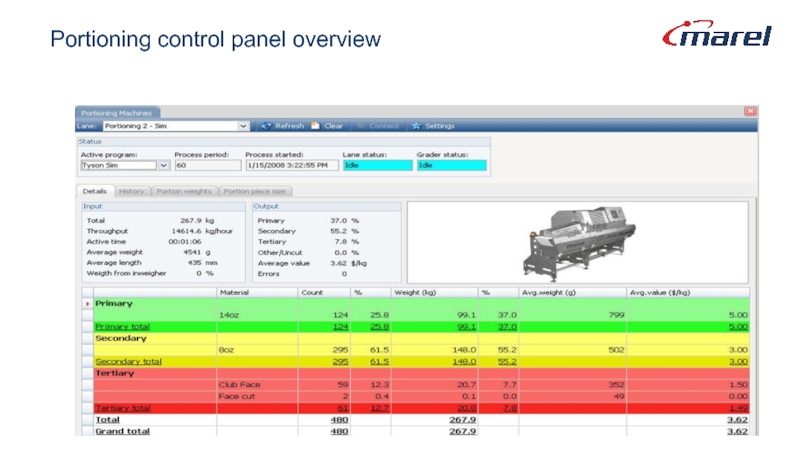
- 47. Portioning control panel overview
- 48. Innova Order Management
- 49. Innova Orders & shipment Order management:
- 50. Innova orders & shipment Packing to orders
- 51. Order Control – By Orders
- 52. Order Control – By Status
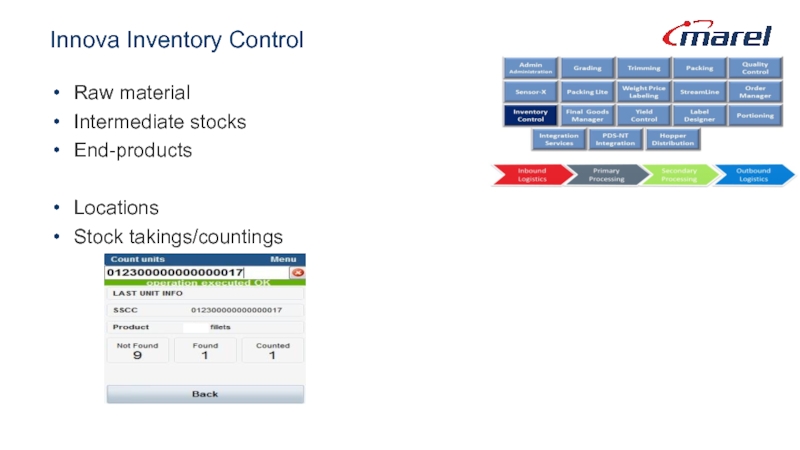
- 53. Innova Inventory Control Raw material Intermediate stocks End-products Locations Stock takings/countings
- 54. Innova Final Goods Management
- 55. Palletizing/Order Picking/Dispatch Innova makes the delivery
- 56. Order Picking/Assign to Order & Assign to
- 57. Innova Inventory Control
- 58. Innova Inventory Control Raw material Intermediate stocks End-products Locations Stock takings/countings
- 59. Raw material inventory Raw material stock levels
- 60. Finished Goods Inventory Finished goods are moved
- 61. Innova Quality Control
- 62. INNOVA Weight Price Labeler
- 64. INNOVA Gain quality control at
- 65. Innova QC – the benefits Paperless inspections
- 66. Innova QC – the benefits Easy access
- 67. INNOVA Customize inspection lists
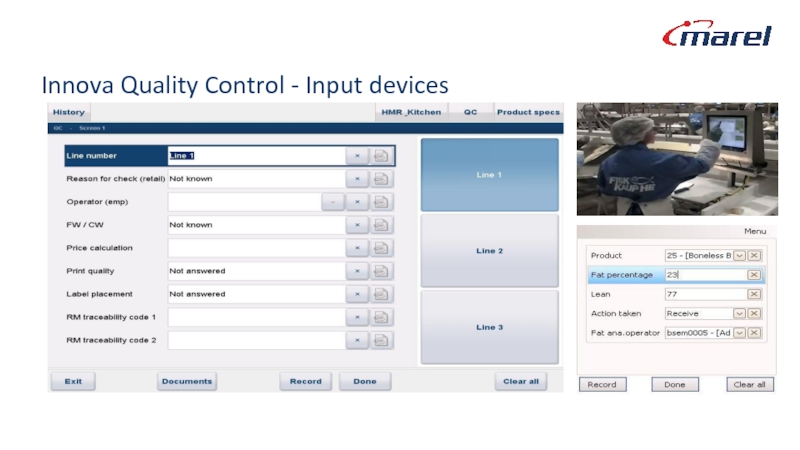
- 68. Innova Quality Control - Input devices
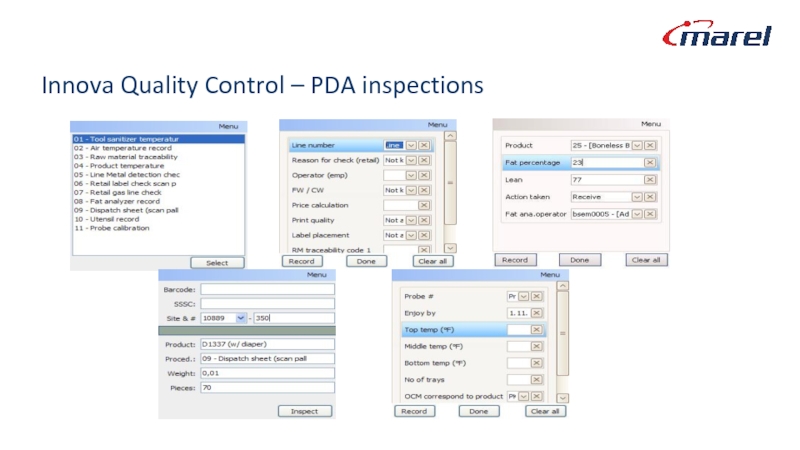
- 69. Innova Quality Control – PDA inspections
- 70. Traceability
- 71. Documentation system Documentation repository Document viewers,
- 72. Innova Dashboarding & Reporting
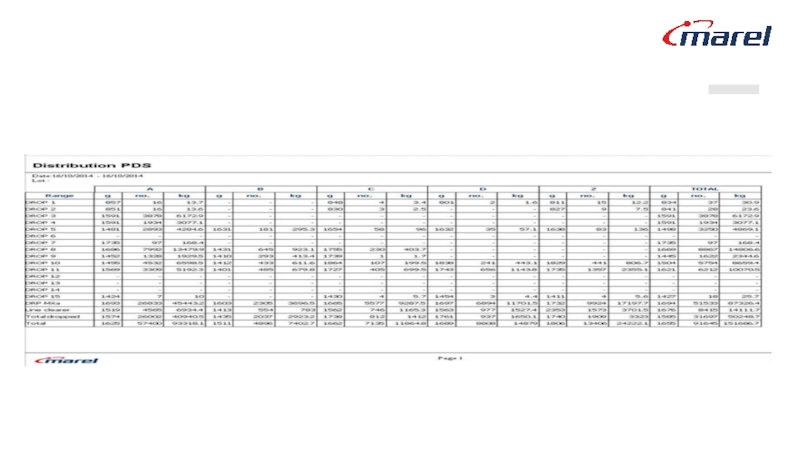
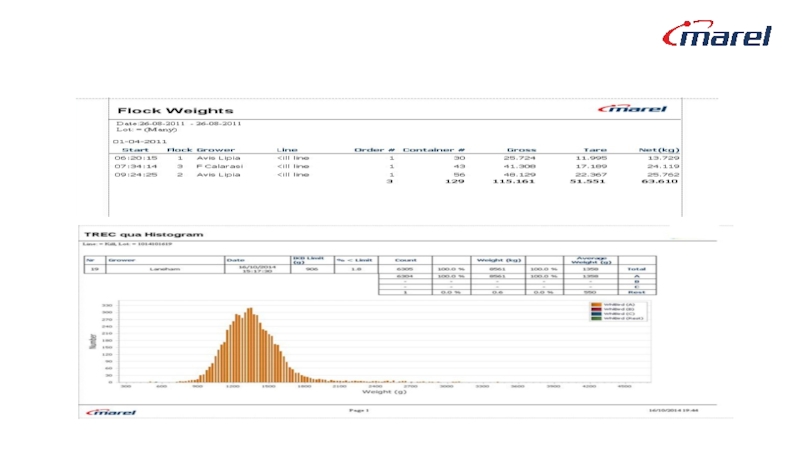
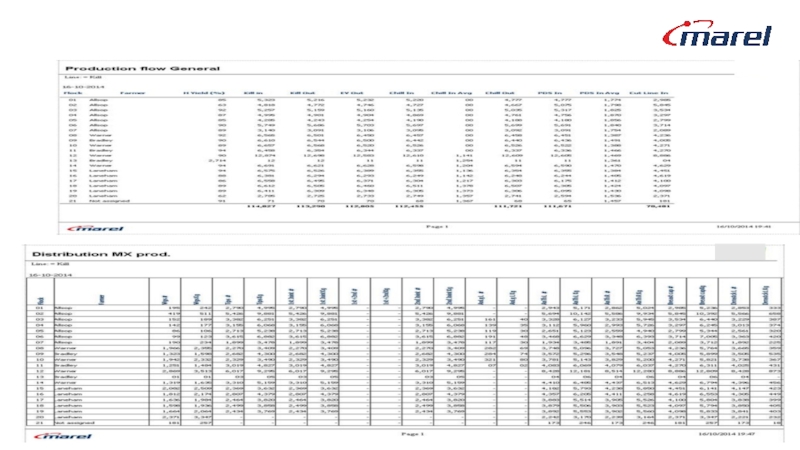
- 73. Reporting Examples
- 74. Dashboarding – Examples
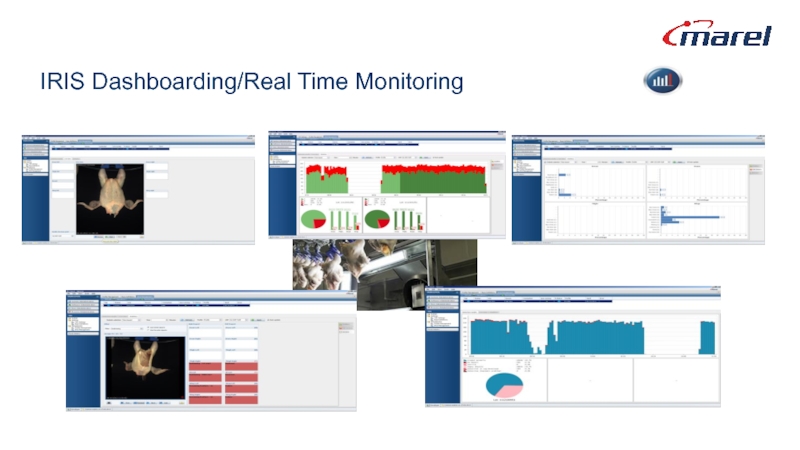
- 75. IRIS Dashboarding/Real Time Monitoring
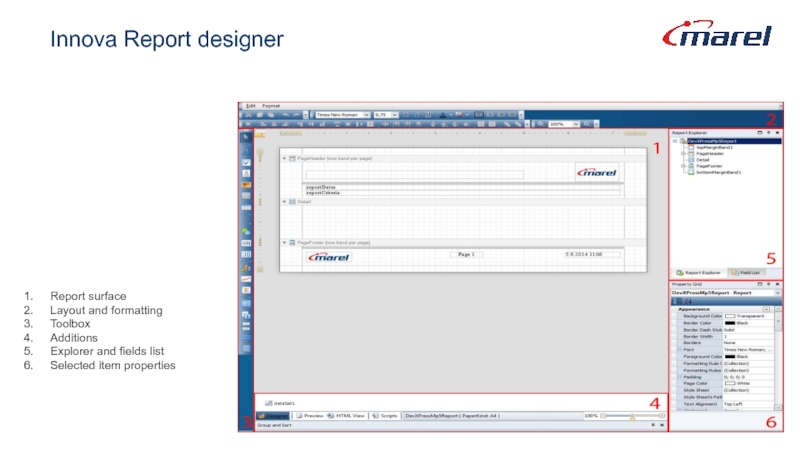
- 76. Innova Report designer Report surface Layout and
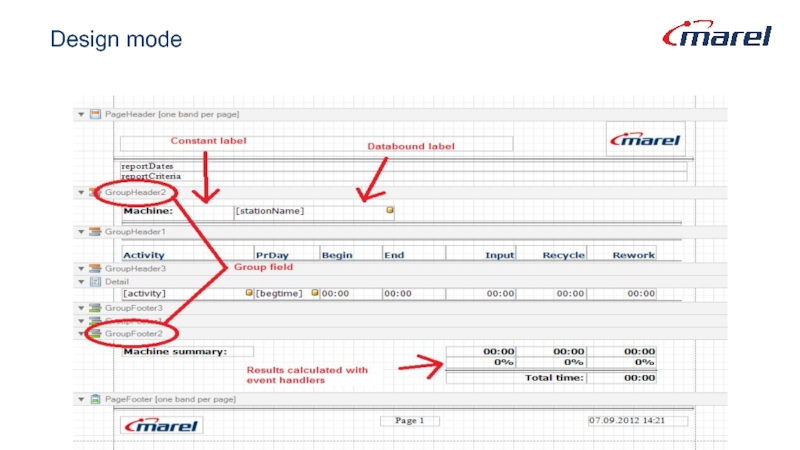
- 77. Design mode
- 78. Innova Integration Services
- 79. Innova Integration Services Transfer product definition from
- 80. Export Engine (Innova -> ERP) Configurable transfer
- 81. Import Engine (ERP -> Innova) Configurable transfer
- 82. Innova OEE
- 83. INNOVA How effectively are your production lines
- 84. Potential production time Actual production time Availability
- 85. Potential production time Actual production time Availability
- 86. Overall Equipment Effectiveness X
- 87. Elements of OEE INNOVA Availability % = Actual
- 88. Improve Performance with Innova OEE
- 89. Collection of reasons for shop
- 90. Innova OEE – Primary Processing OEE Primary Processing
- 91. INNOVA
- 92. Event status and stop reasons INNOVA
- 93. Fast and easy problem identification with
- 94. Track the effects of implemented process improvements
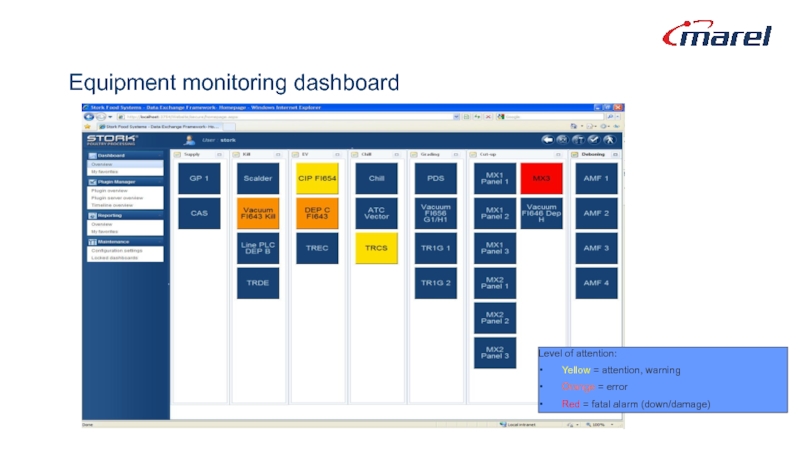
- 95. Equipment monitoring - why and how? Maximise
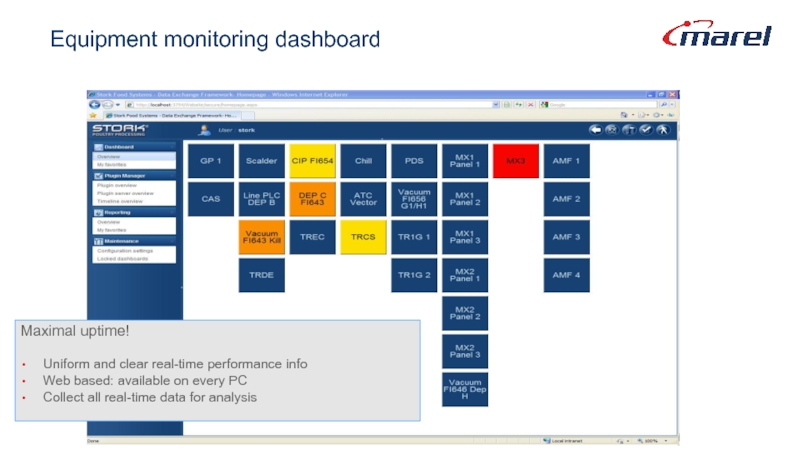
- 96. Equipment monitoring dashboard Level of attention: Yellow
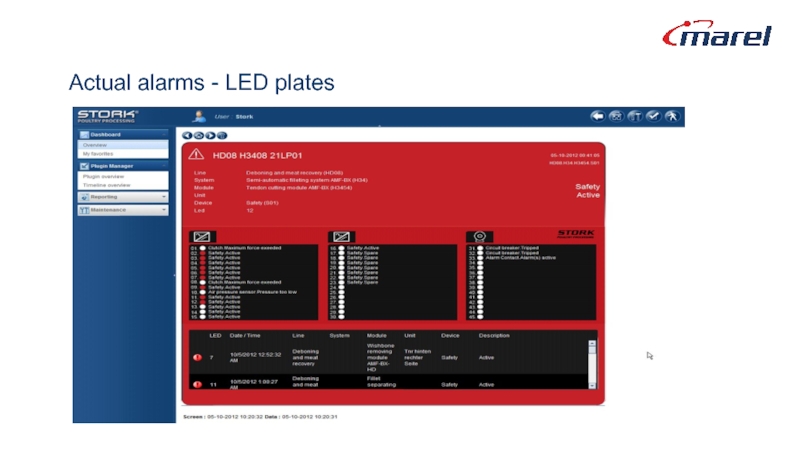
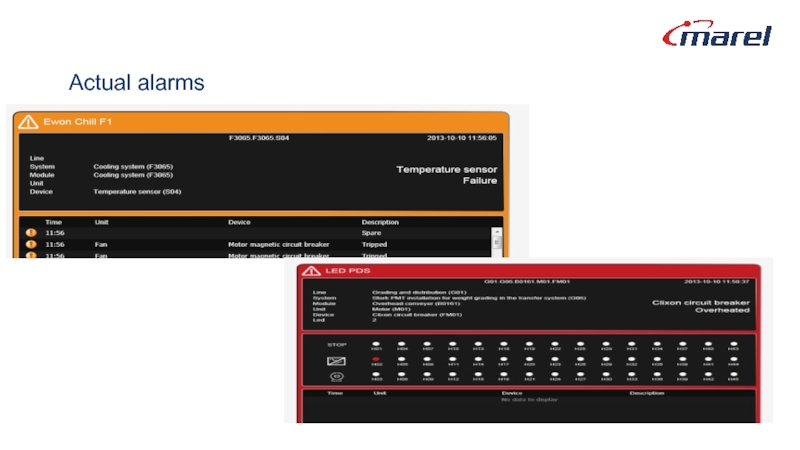
- 97. Actual alarms - LED plates
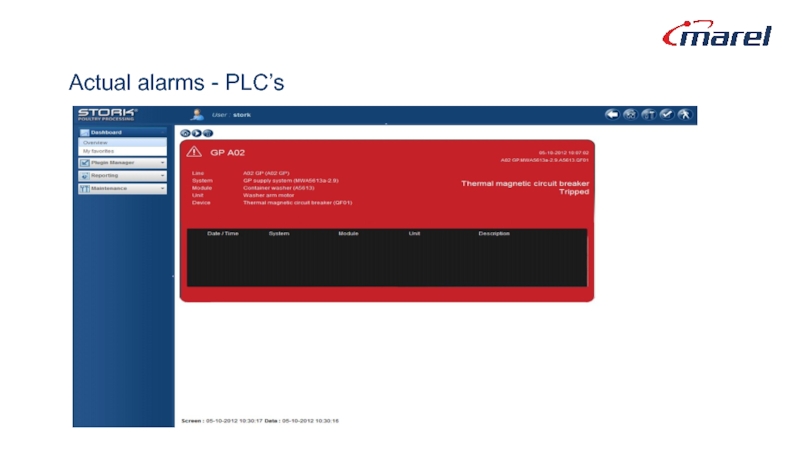
- 98. Actual alarms - PLC’s
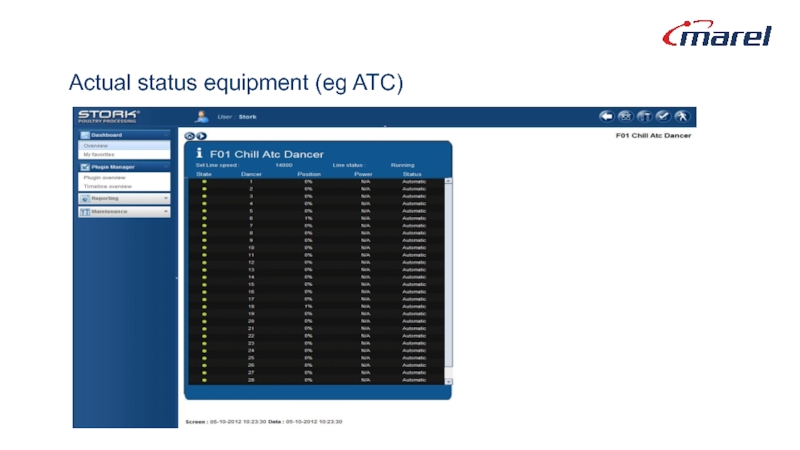
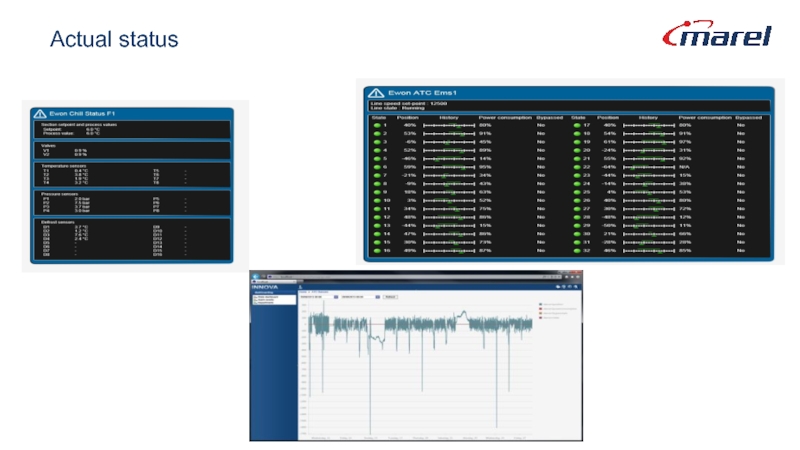
- 99. Actual status equipment (eg ATC)
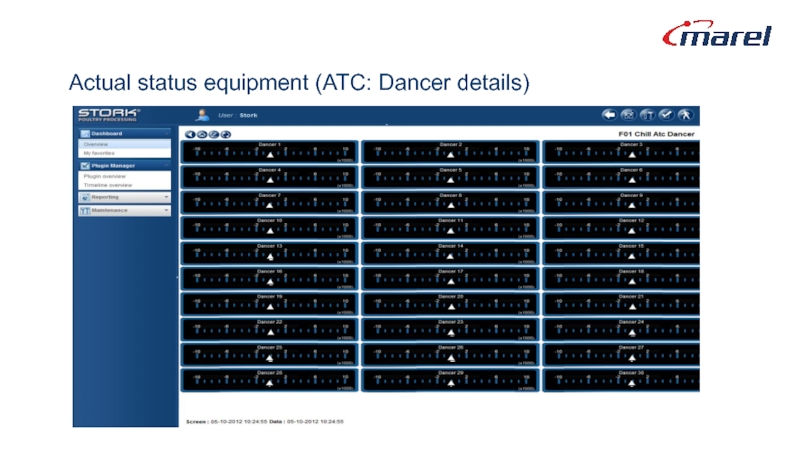
- 100. Actual status equipment (ATC: Dancer details)
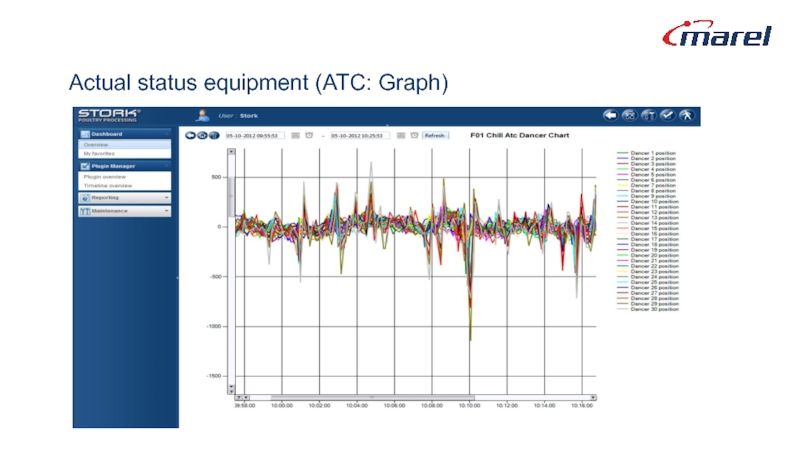
- 101. Actual status equipment (ATC: Graph)
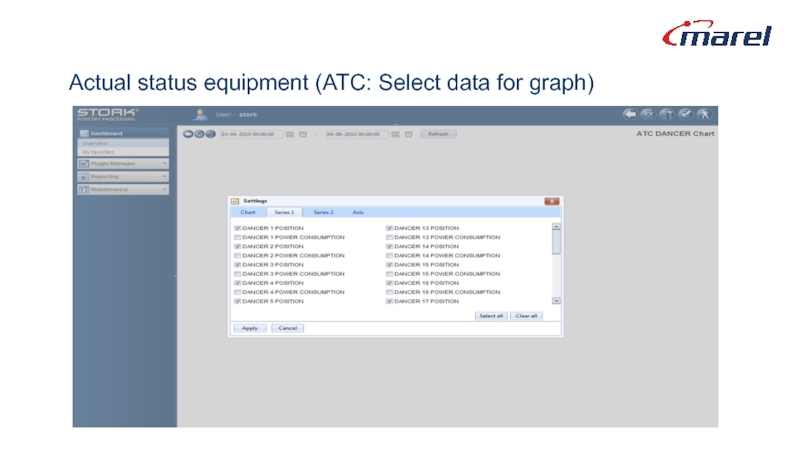
- 102. Actual status equipment (ATC: Select data for graph)
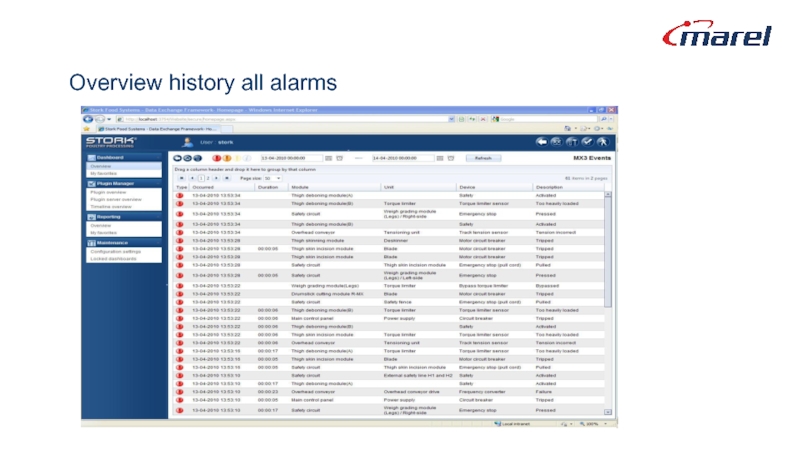
- 103. Overview history all alarms
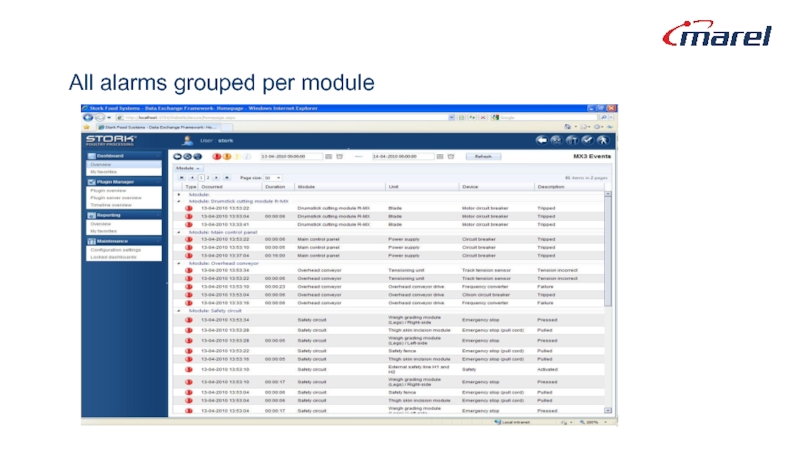
- 104. All alarms grouped per module
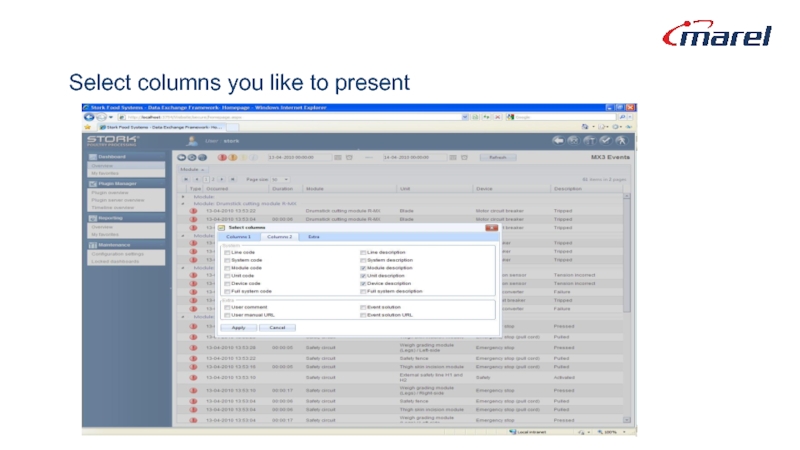
- 105. Select columns you like to present
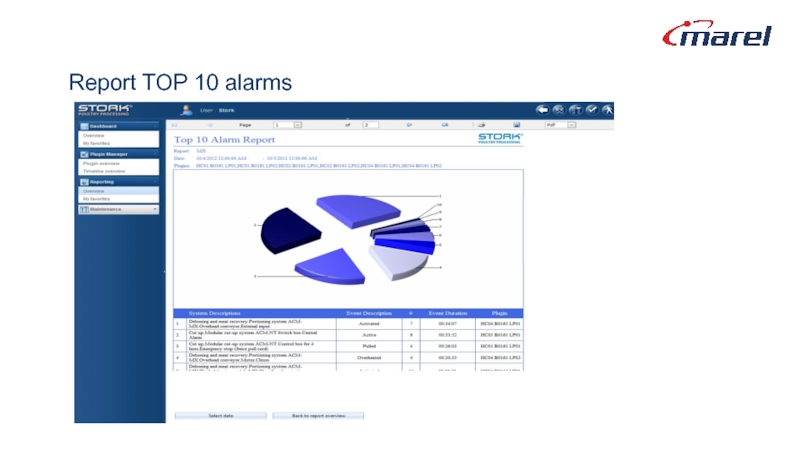
- 106. Report TOP 10 alarms
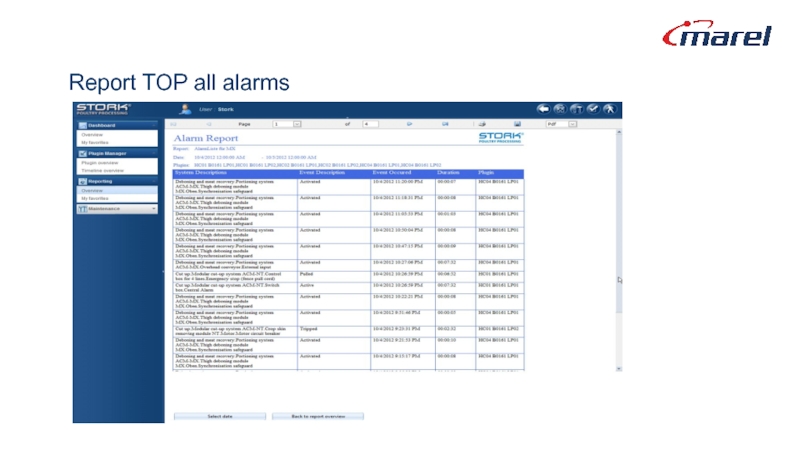
- 107. Report TOP all alarms
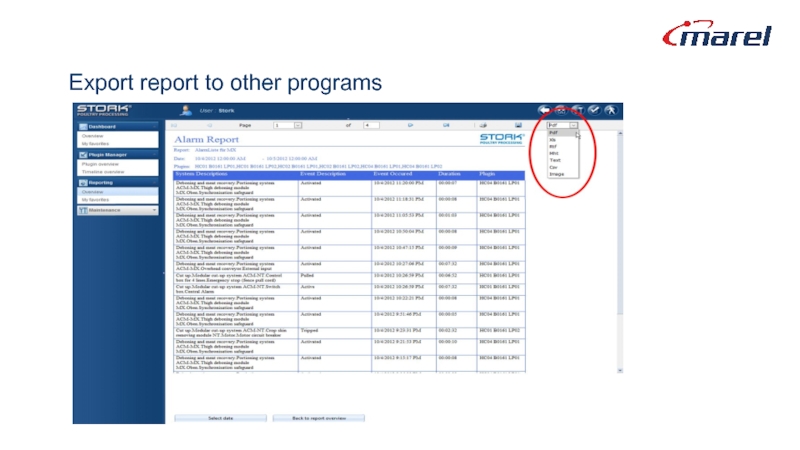
- 108. Export report to other programs
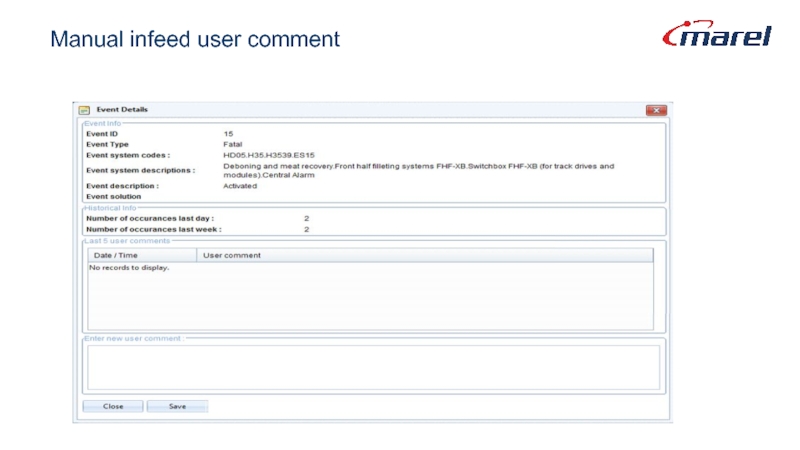
- 109. Manual infeed user comment
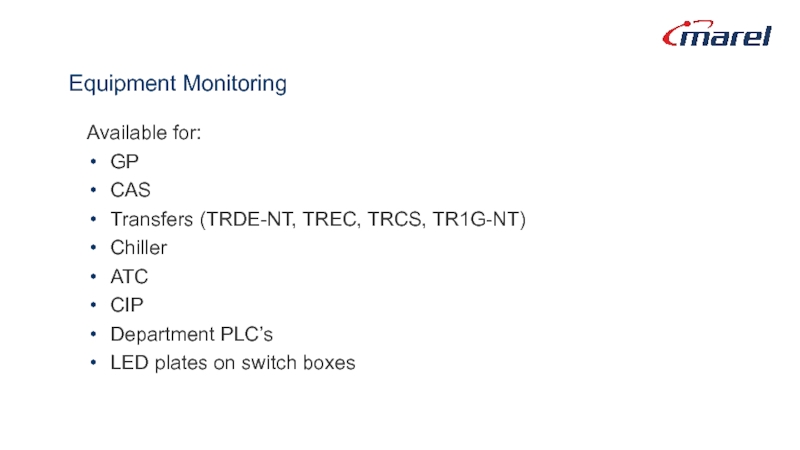
- 110. Equipment Monitoring Available for: GP CAS Transfers
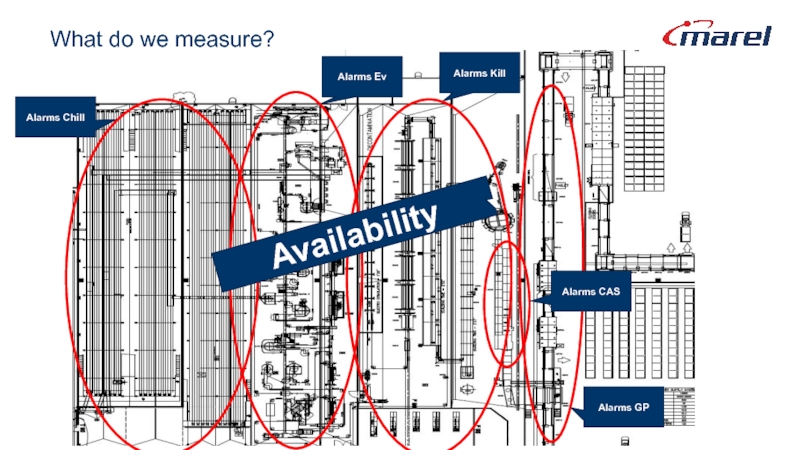
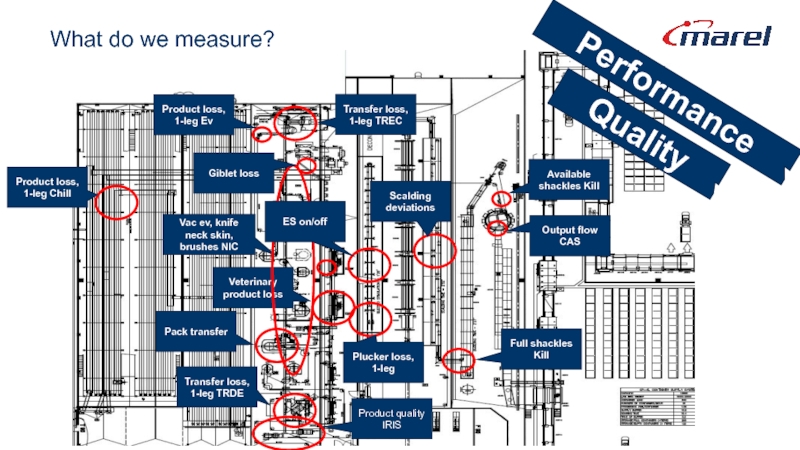
- 111. What do we measure? Availability
- 112. What do we measure? Quality Performance
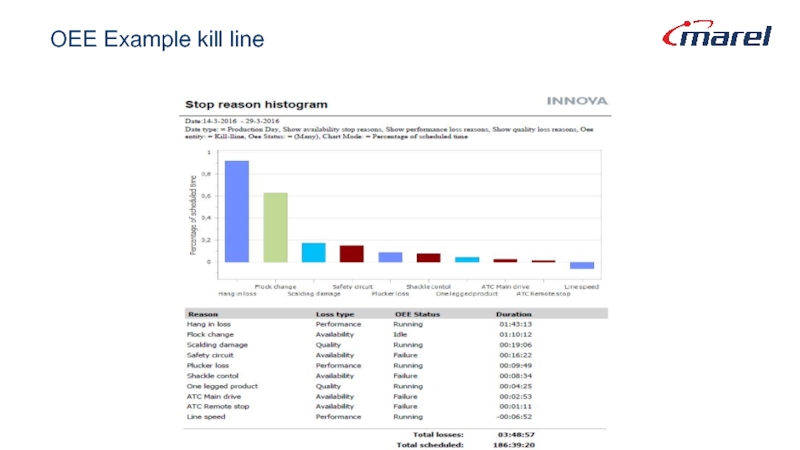
- 113. OEE Example kill line
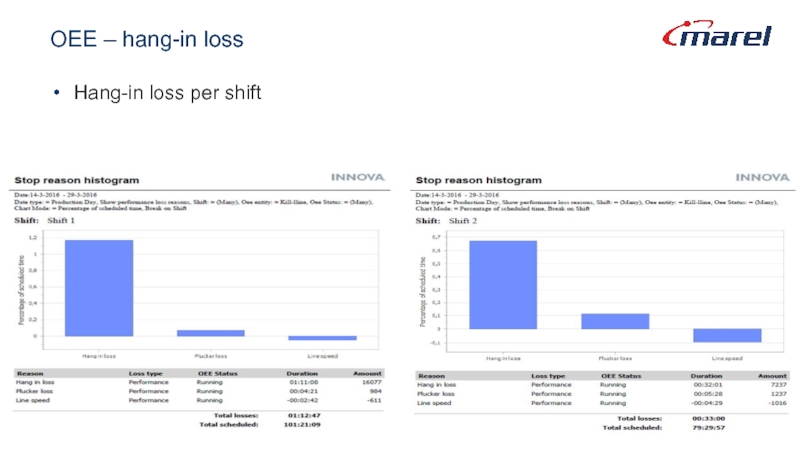
- 114. OEE – hang-in loss Hang-in loss per shift
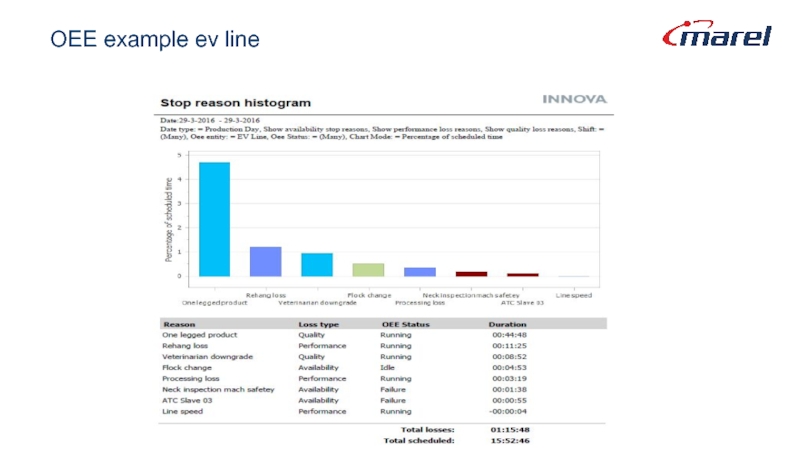
- 115. OEE example ev line
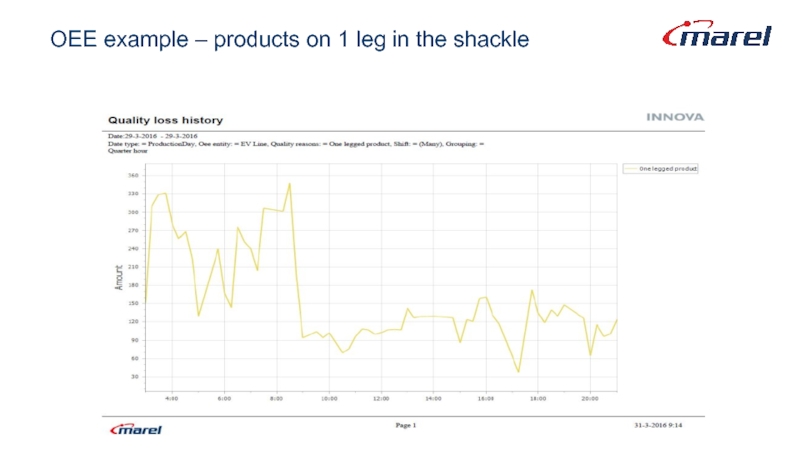
- 116. OEE example – products on 1 leg in the shackle
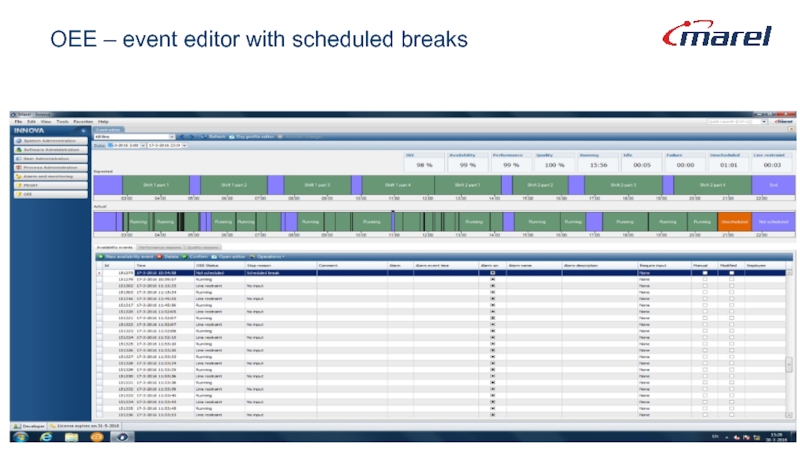
- 117. OEE – event editor with scheduled breaks
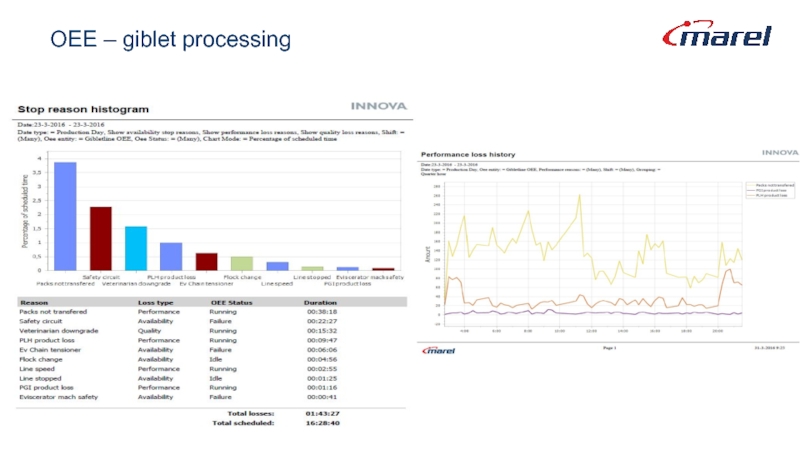
- 118. OEE – giblet processing
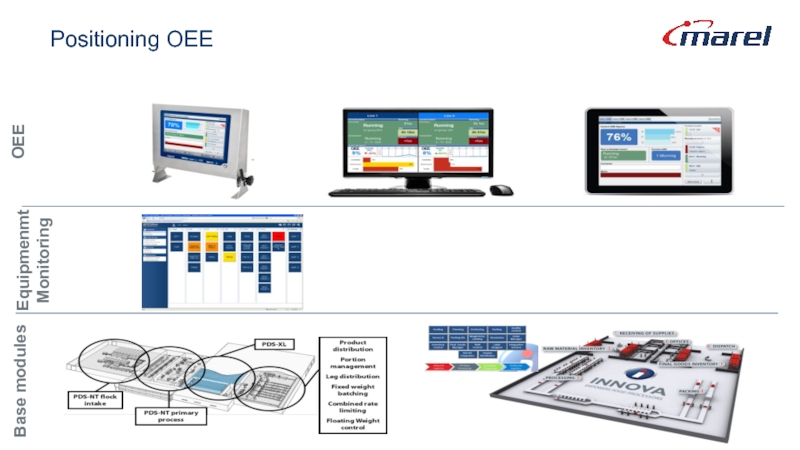
- 119. Positioning OEE
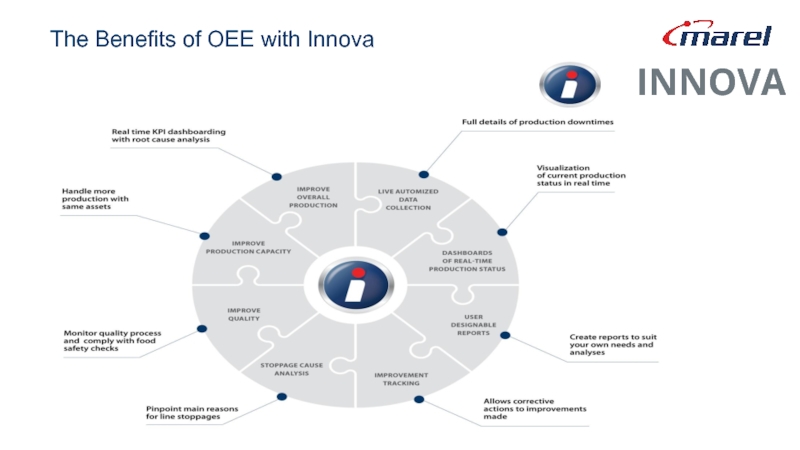
- 120. The Benefits of OEE with Innova INNOVA
- 121. Innova Service Portfolio
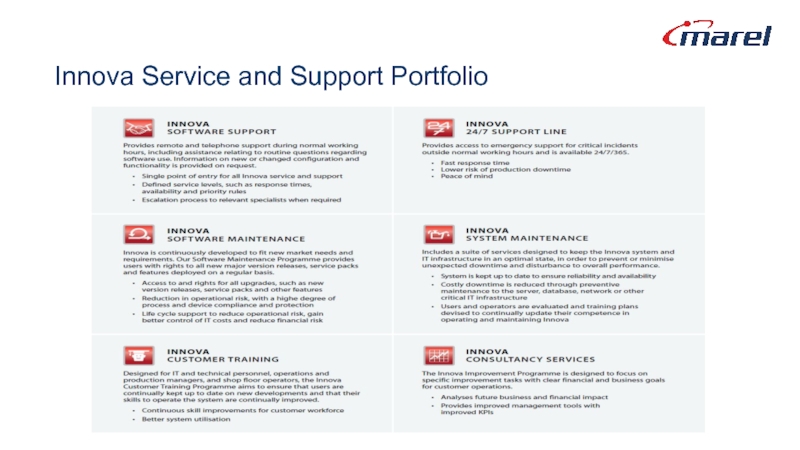
- 122. Innova Service and Support Portfolio
- 123. Tabel of content Why Innova & PDS-NT
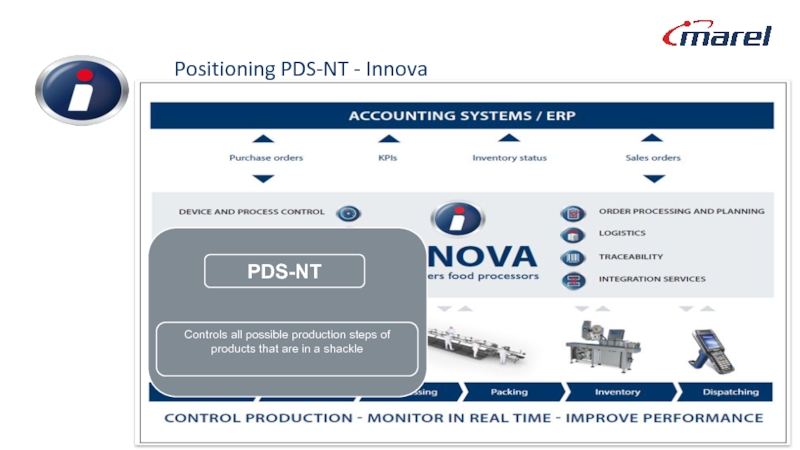
- 124. General introduction - What is PDS-NT PDS-NT:
- 125. Positioning PDS-NT - Innova s
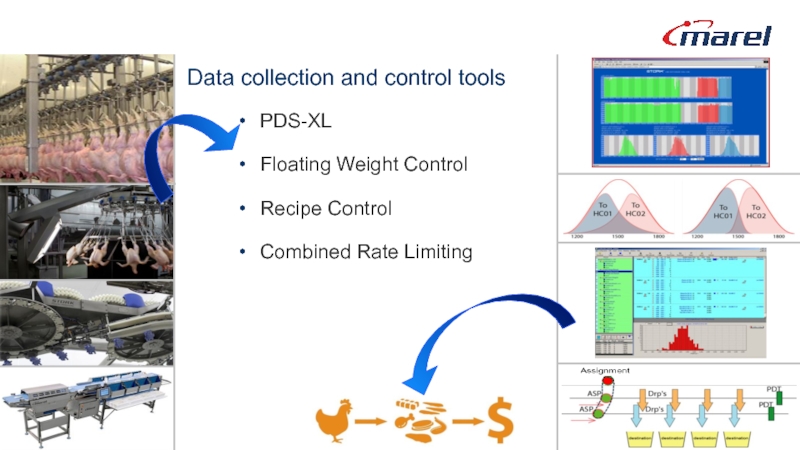
- 126. Data collection and control tools PDS-XL Floating
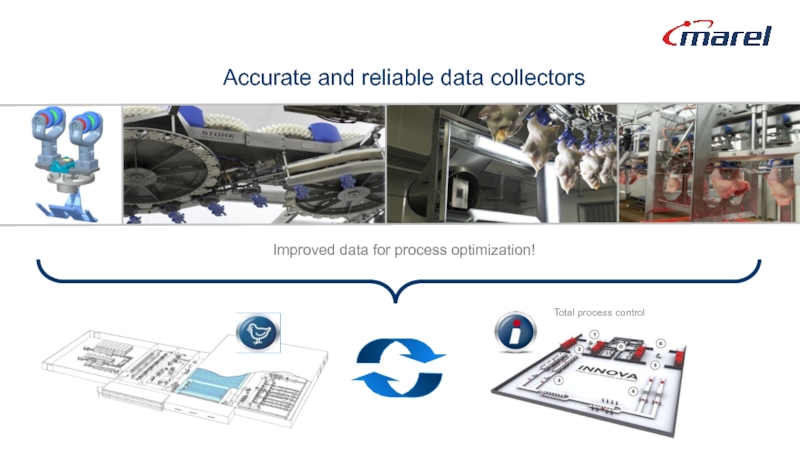
- 127. Accurate and reliable data collectors Improved data for process optimization!
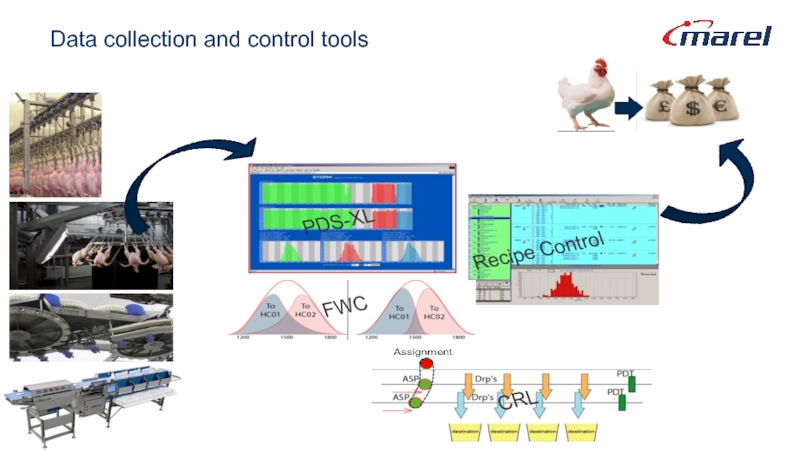
- 128. Data collection and control tools
- 129. PDS-NT – Standard modules PDS-NT: Logistic information
- 130. PDS-NT: Primary processing Flock switch - Traceability
- 131. PDS-NT: PDS-XL Reliable shackle identification to follow
- 132. PDS-XL information Individual flock histograms Position of
- 133. PDS-NT: Product distribution & portioning management Whole
- 134. Recipe control (Pre-) define orders per processing
- 135. Products physically divided over
- 136. No lightweight products in the line for
- 137. Floating weight range making use of the
- 138. Control strategy Past Individual line control Raw
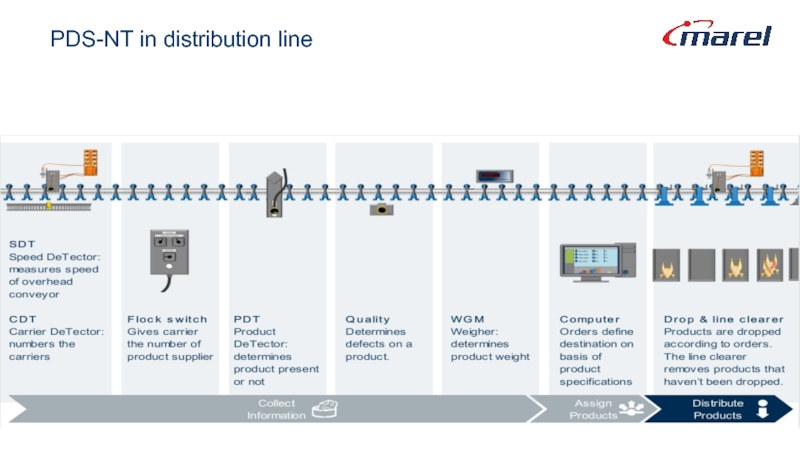
- 144. PDS-NT in distribution line
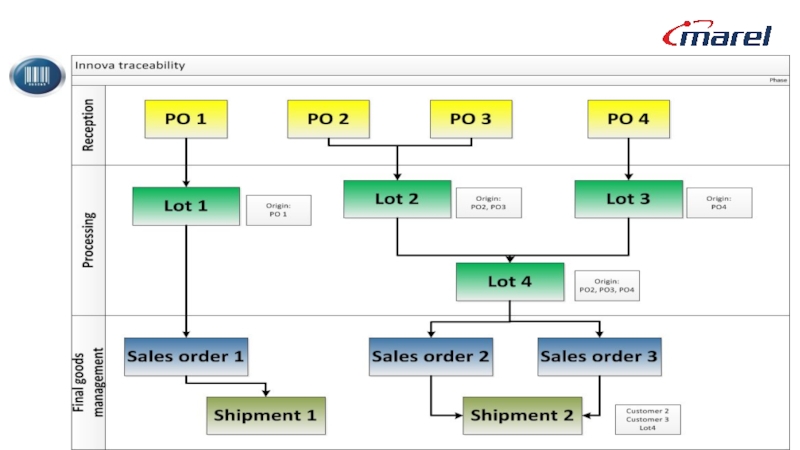
- 145. Innova Traceability
- 146. Traceability in the supply chain Intake:
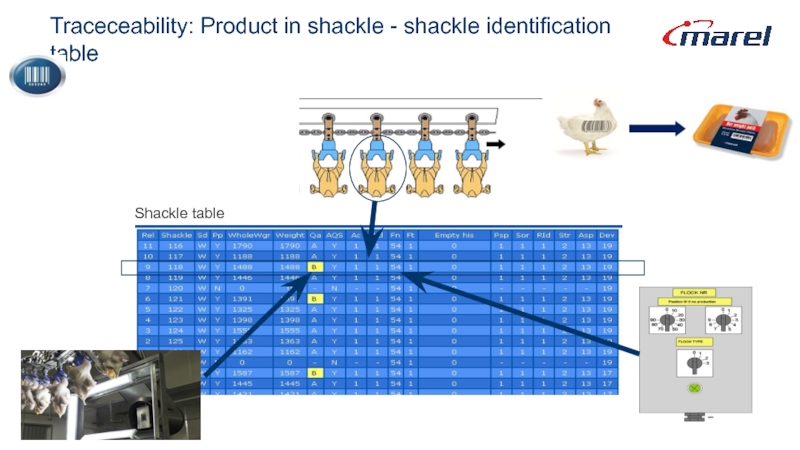
- 147. Traceceability: Product in shackle - shackle identification table Shackle table
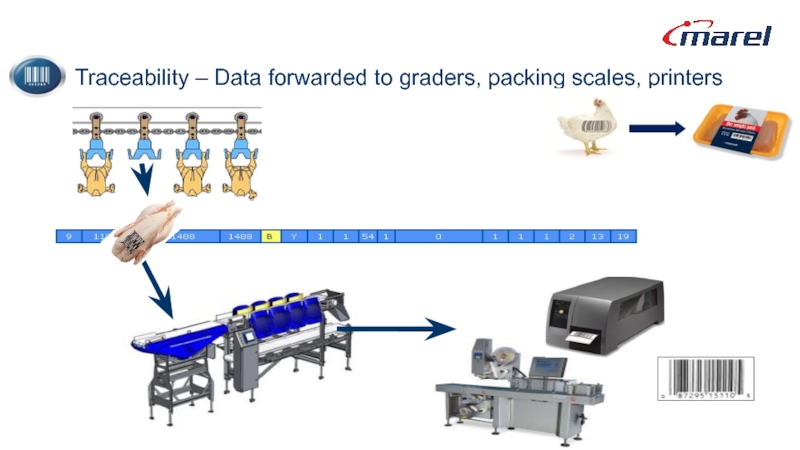
- 148. Traceability – Data forwarded to graders, packing scales, printers
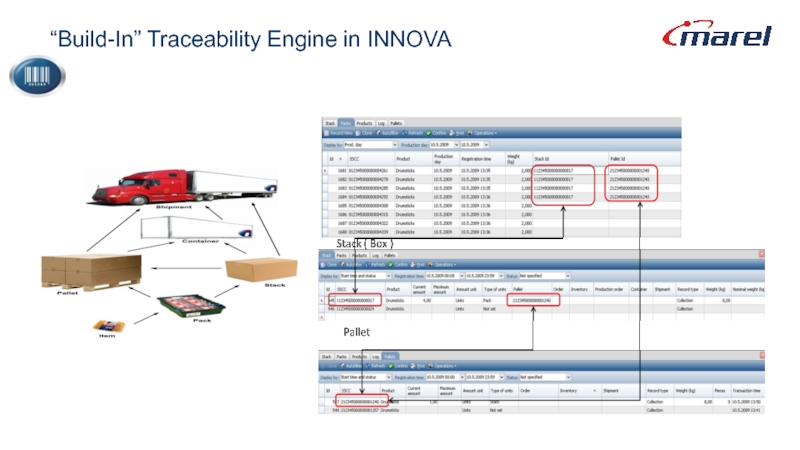
- 150. “Build-In” Traceability Engine in INNOVA
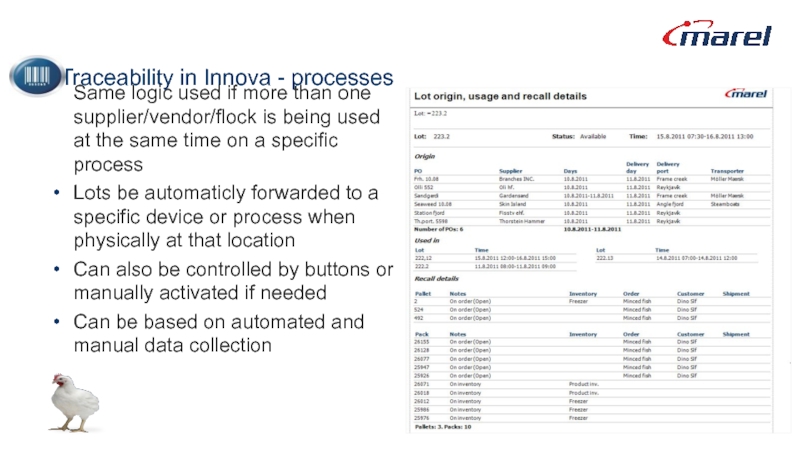
- 151. Traceability in Innova - processes Same logic
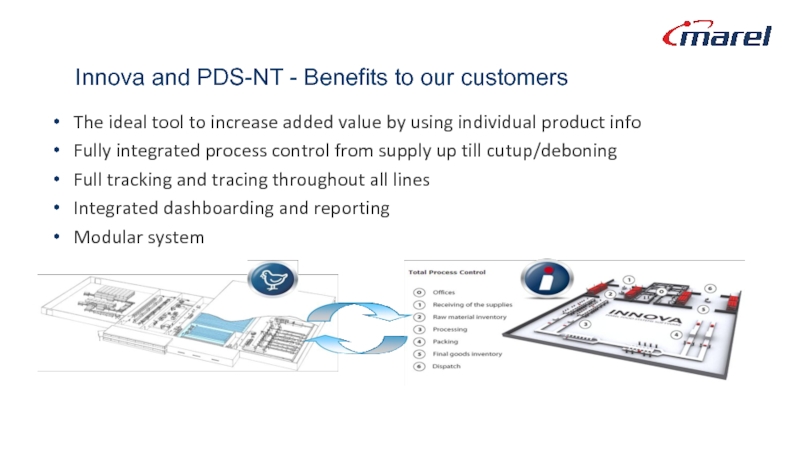
- 152. Innova and PDS-NT - Benefits to our
- 153. Tabel of content Why Innova & PDS-NT
- 154. Equipment monitoring dashboard Maximal uptime! Uniform
- 155. Actual alarms
- 156. Actual status
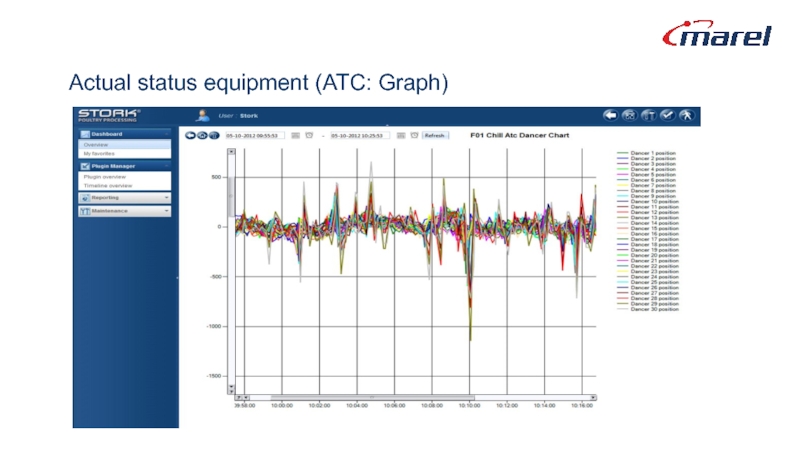
- 157. Actual status equipment (ATC: Graph)
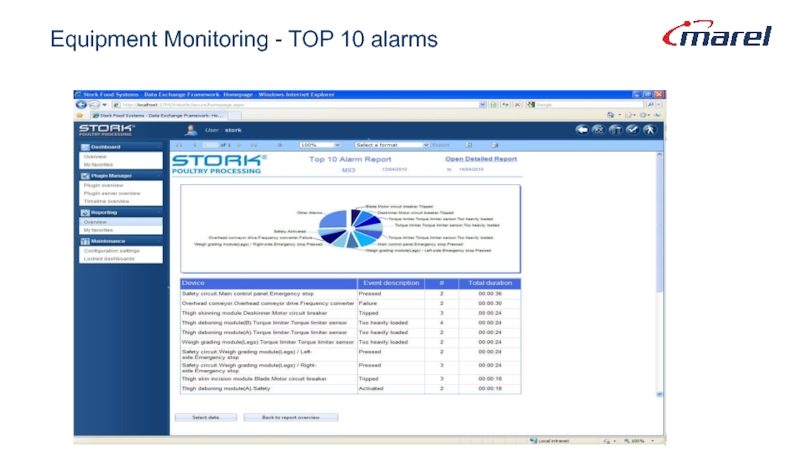
- 158. Equipment Monitoring - TOP 10 alarms
- 159. Tabel of content Why Innova & PDS-NT
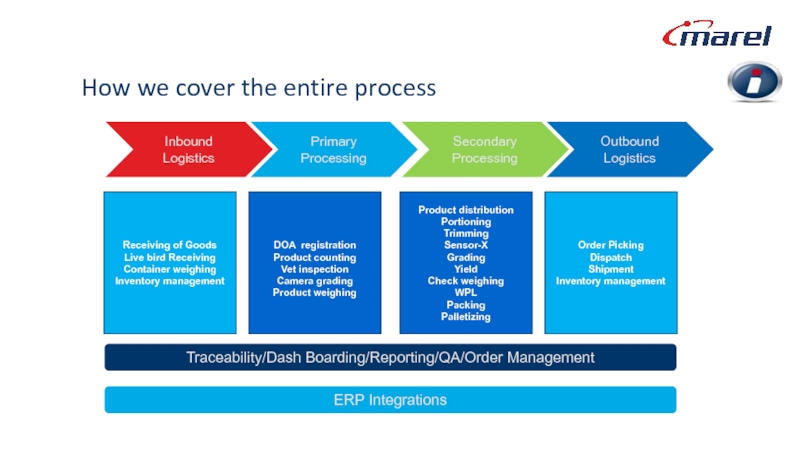
- 160. How we cover the entire process Inbound
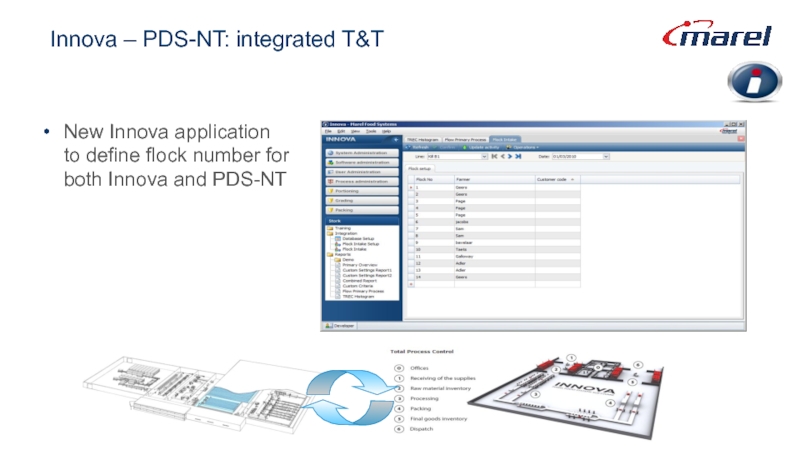
- 161. Innova – PDS-NT: integrated T&T New Innova
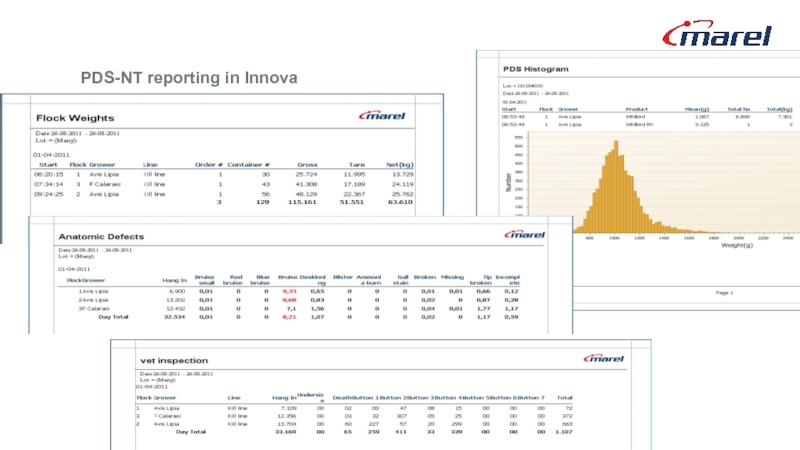
- 162. PDS-NT reporting in Innova
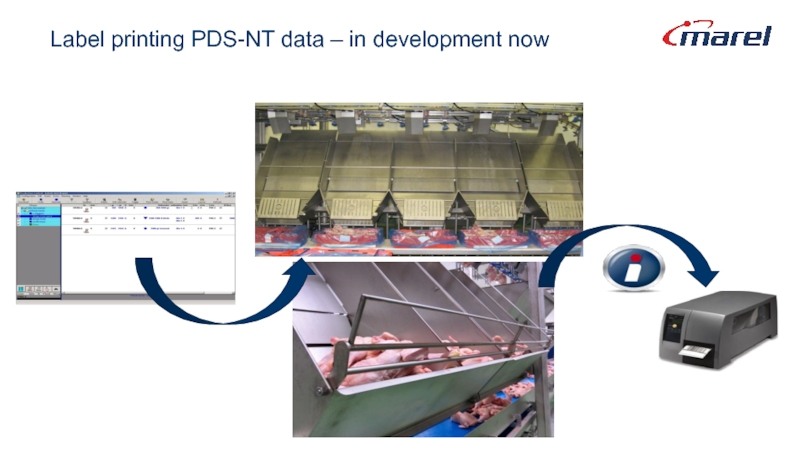
- 163. Label printing PDS-NT data – in development now
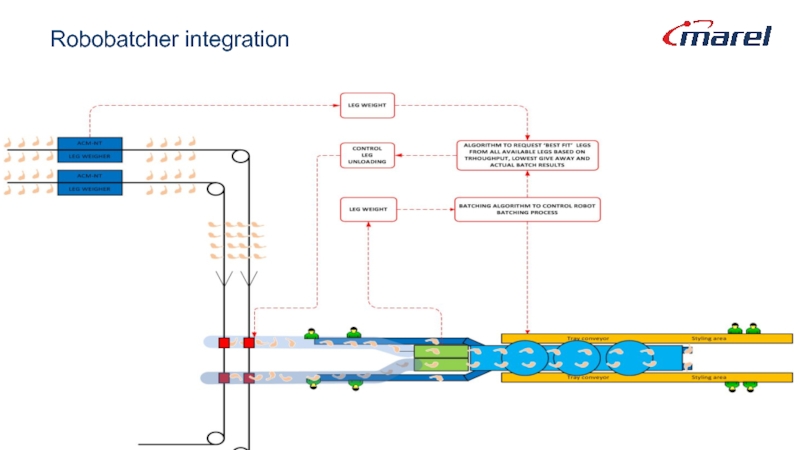
- 164. Robobatcher integration
- 165. With Innova & PDS-NT you get…
- 166. Thank you!
Слайд 2Tabel of content
Why Innova & PDS-NT
Overview Innova
Overview PDS-NT
Equipment Monitoring
Integration & customer
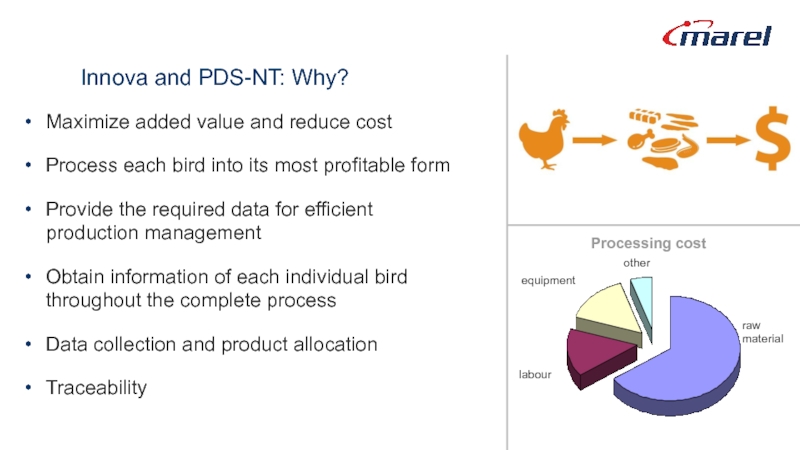
Слайд 3Innova and PDS-NT: Why?
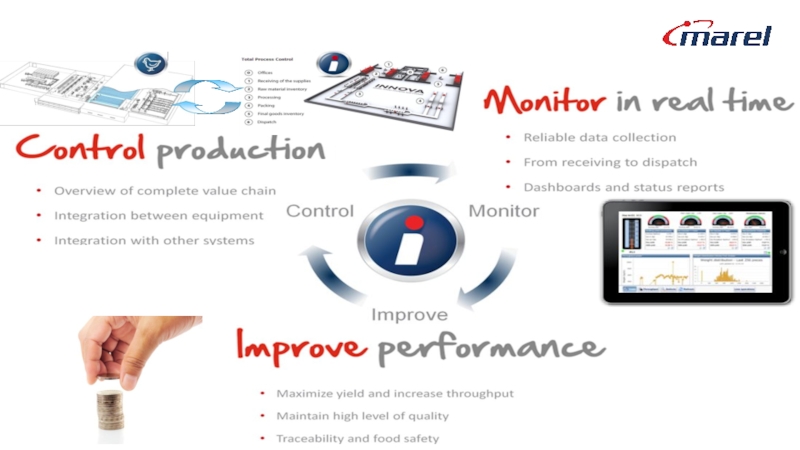
Maximize added value and reduce cost
Process each bird
Provide the required data for efficient production management
Obtain information of each individual bird throughout the complete process
Data collection and product allocation
Traceability
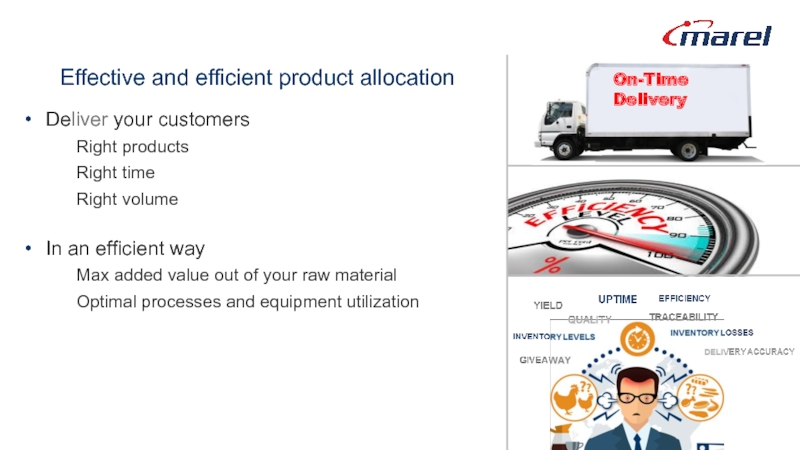
Слайд 6Effective and efficient product allocation
Deliver your customers
Right products
Right time
Right volume
In an
Max added value out of your raw material
Optimal processes and equipment utilization
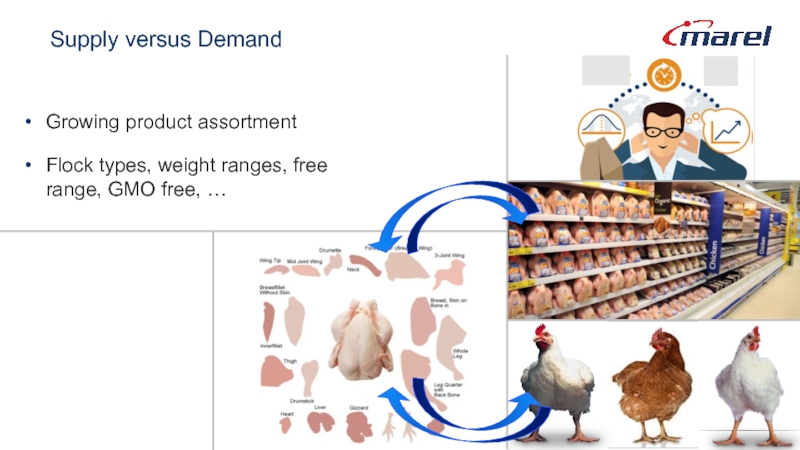
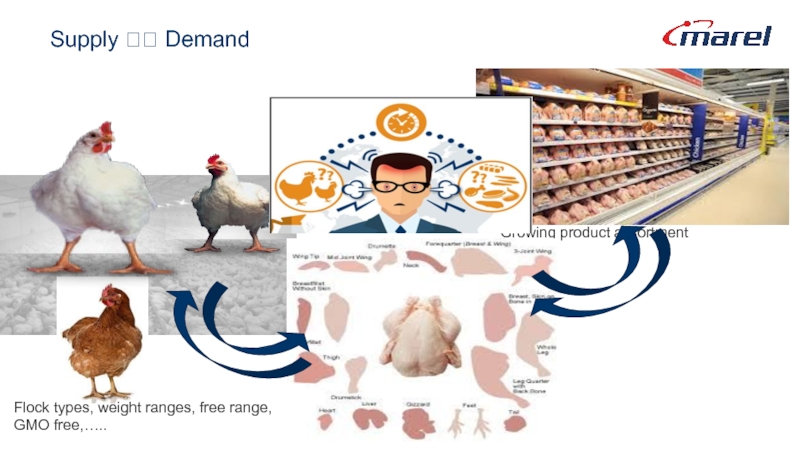
Слайд 7Supply versus Demand
Growing product assortment
Flock types, weight ranges, free range, GMO
Слайд 9Tabel of content
Why Innova & PDS-NT
Overview Innova
Overview PDS-NT
Equipment Monitoring
Integration & customer
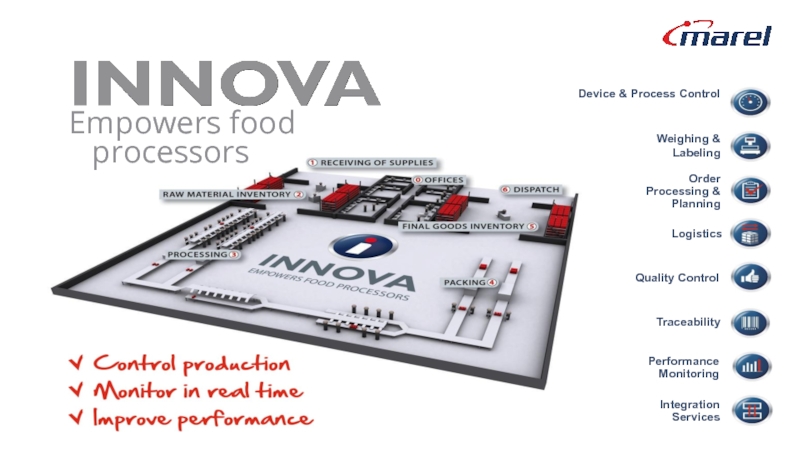
Слайд 10Empowers food processors
Device & Process Control
Weighing &
Labeling
Quality Control
Performance
Monitoring
Order
Processing &
Planning
Traceability
Integration
Services
Logistics
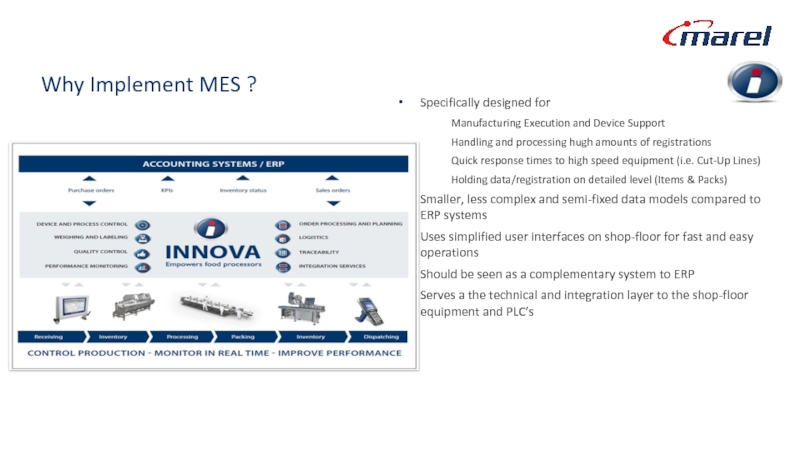
Слайд 15Why Implement MES ?
Specifically designed for
Manufacturing Execution and Device Support
Handling
Quick response times to high speed equipment (i.e. Cut-Up Lines)
Holding data/registration on detailed level (Items & Packs)
Smaller, less complex and semi-fixed data models compared to ERP systems
Uses simplified user interfaces on shop-floor for fast and easy operations
Should be seen as a complementary system to ERP
Serves a the technical and integration layer to the shop-floor equipment and PLC’s
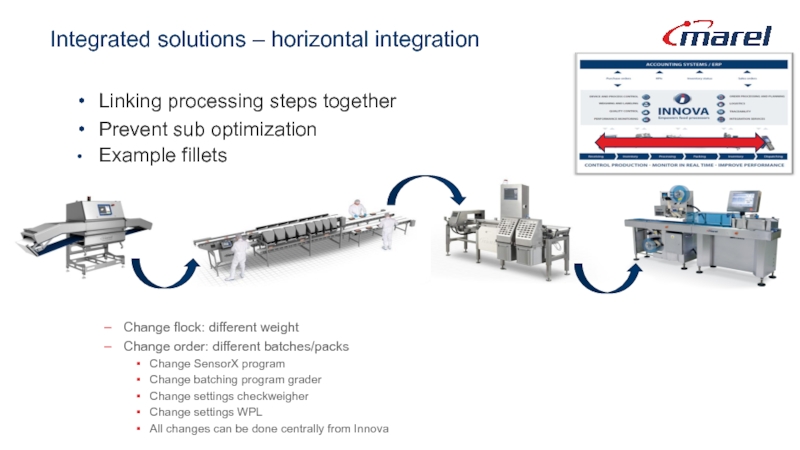
Слайд 16Integrated solutions – horizontal integration
Linking processing steps together
Prevent sub optimization
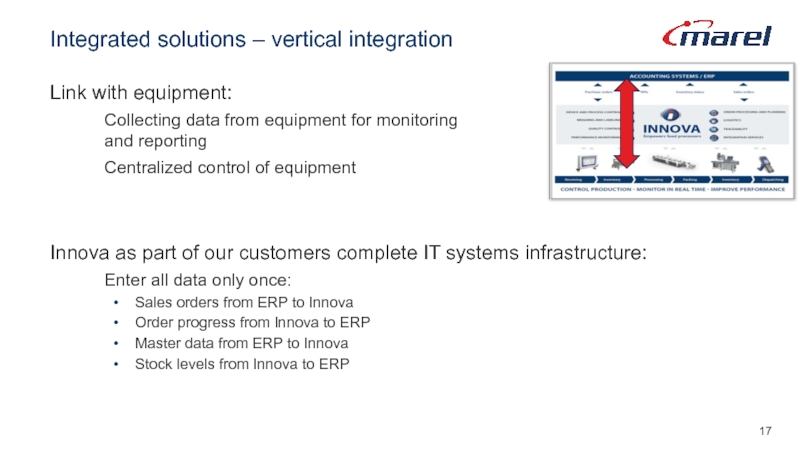
Слайд 17Integrated solutions – vertical integration
Link with equipment:
Collecting data from equipment for
Centralized control of equipment
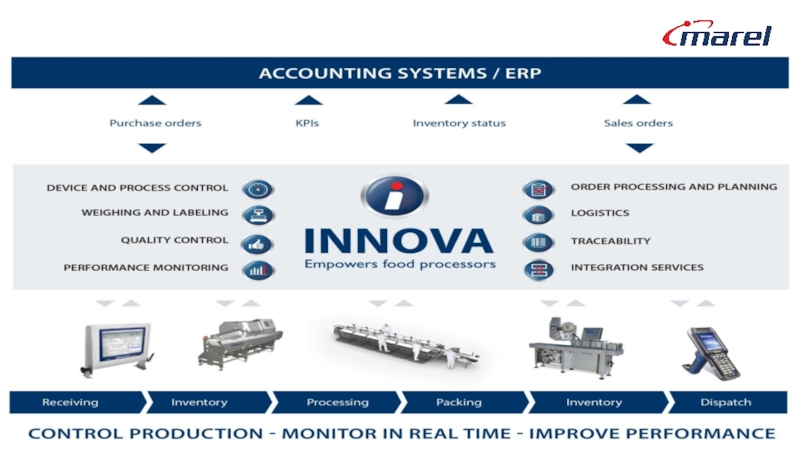
Innova as part of our customers complete IT systems infrastructure:
Enter all data only once:
Sales orders from ERP to Innova
Order progress from Innova to ERP
Master data from ERP to Innova
Stock levels from Innova to ERP
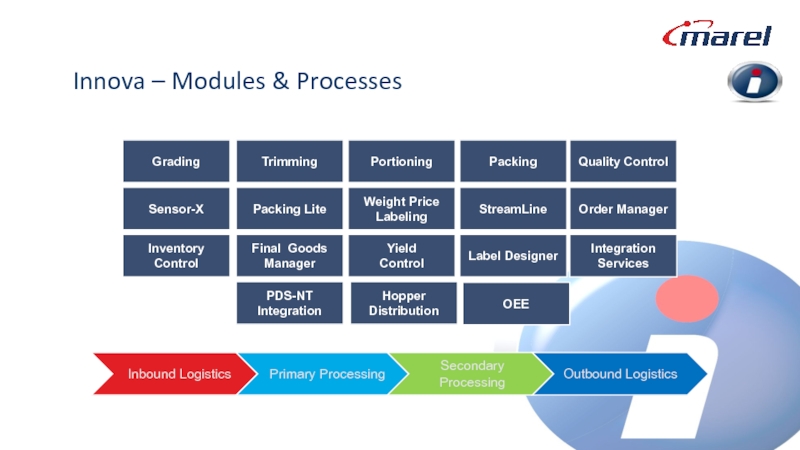
Слайд 18Innova – Modules & Processes
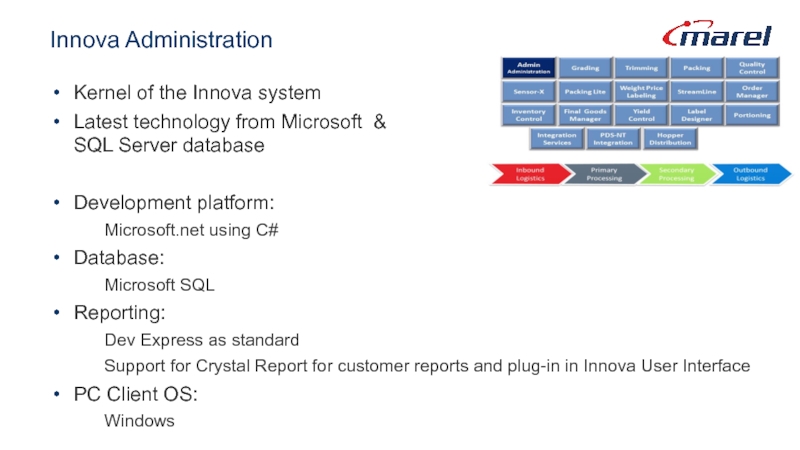
Grading
Sensor-X
Inventory Control
Trimming
Packing Lite
Final Goods Manager
Portioning
Weight Price Labeling
Yield
Control
Packing
StreamLine
Label Designer
Quality Control
Order Manager
Integration Services
PDS-NT Integration
Hopper Distribution
Inbound Logistics
Primary Processing
Secondary Processing
Outbound Logistics
OEE
Слайд 21Innova Administration
Kernel of the Innova system
Latest technology from Microsoft &
SQL
Development platform:
Microsoft.net using C#
Database:
Microsoft SQL
Reporting:
Dev Express as standard
Support for Crystal Report for customer reports and plug-in in Innova User Interface
PC Client OS:
Windows
Слайд 23Innova Packing
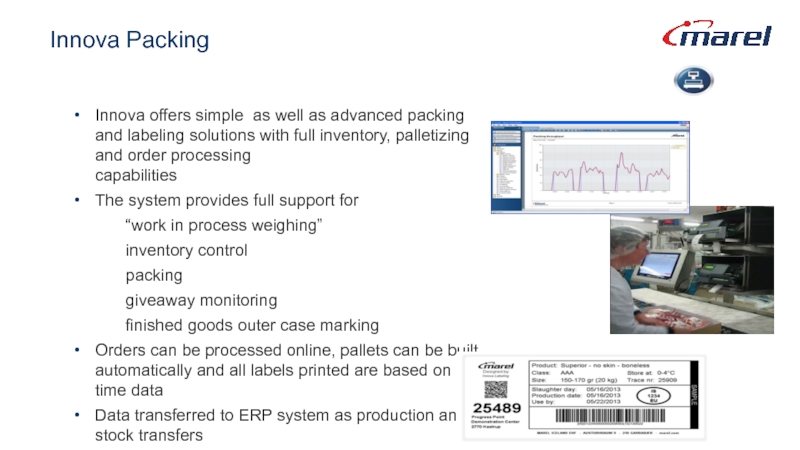
Innova offers simple as well as advanced packing and labeling
The system provides full support for
“work in process weighing”
inventory control
packing
giveaway monitoring
finished goods outer case marking
Orders can be processed online, pallets can be built automatically and all labels printed are based on real time data
Data transferred to ERP system as production and stock transfers
Слайд 29Main features Labeling
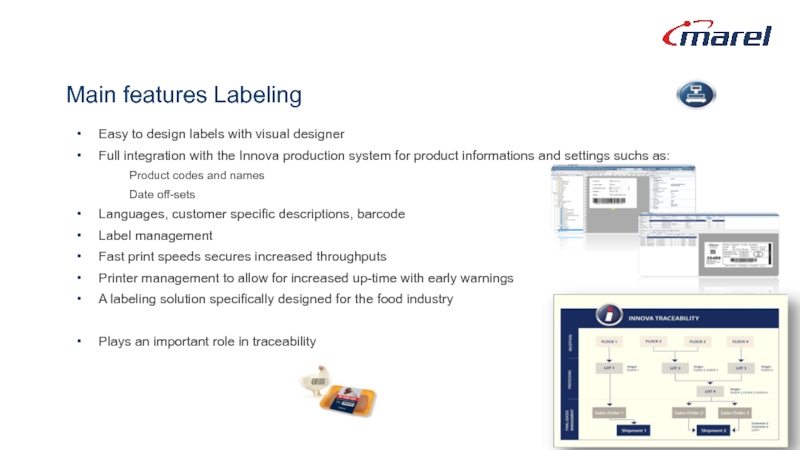
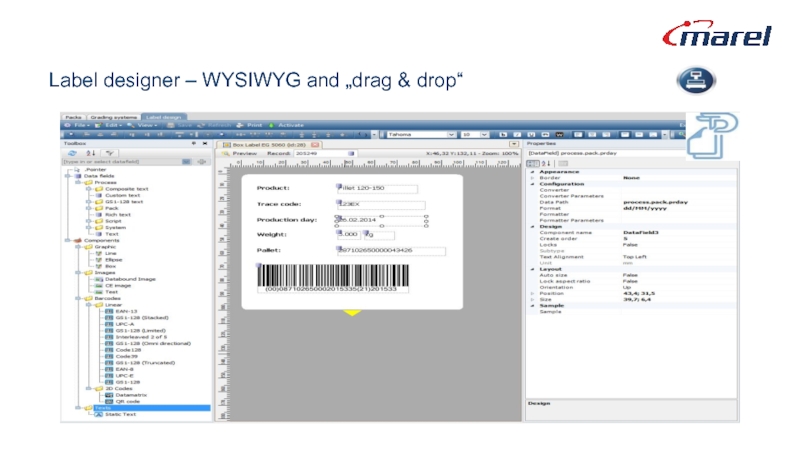
Easy to design labels with visual designer
Full integration with
Product codes and names
Date off-sets
Languages, customer specific descriptions, barcode
Label management
Fast print speeds secures increased throughputs
Printer management to allow for increased up-time with early warnings
A labeling solution specifically designed for the food industry
Plays an important role in traceability
Слайд 31Printer support
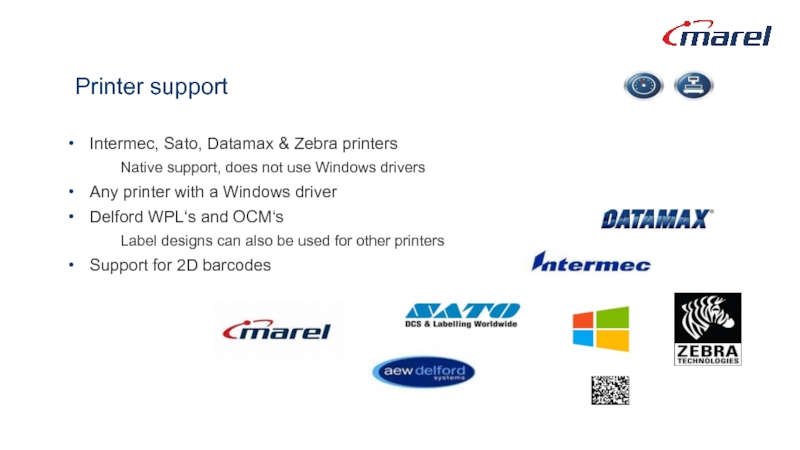
Intermec, Sato, Datamax & Zebra printers
Native support, does not use
Any printer with a Windows driver
Delford WPL‘s and OCM‘s
Label designs can also be used for other printers
Support for 2D barcodes
Слайд 33Innova Grading
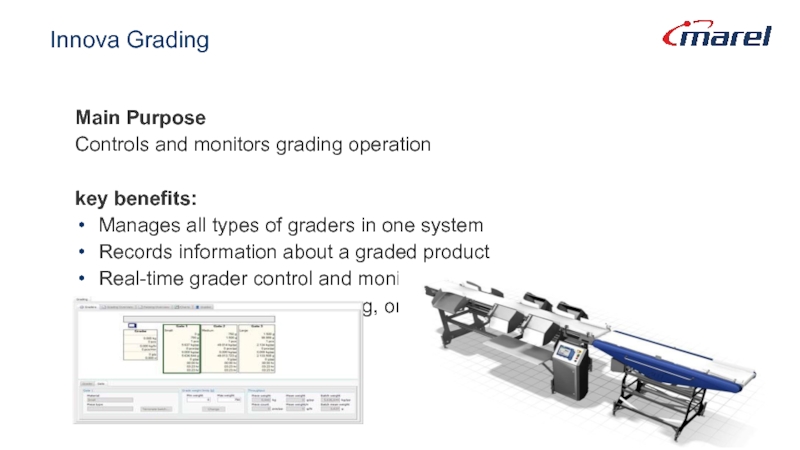
Main Purpose
Controls and monitors grading operation
key benefits:
Manages all types
Records information about a graded product
Real-time grader control and monitoring
Can be integrated with labeling, order processing, palletizing, and stock control for produced batches
Слайд 36Key benefits
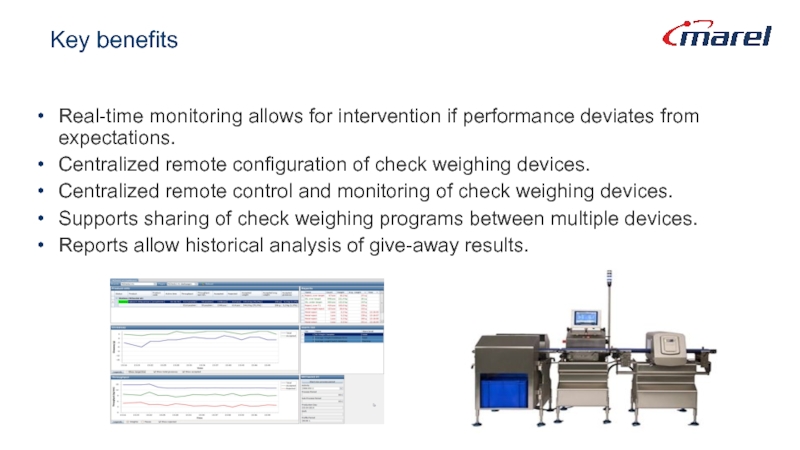
Real-time monitoring allows for intervention if performance deviates from
Centralized remote configuration of check weighing devices.
Centralized remote control and monitoring of check weighing devices.
Supports sharing of check weighing programs between multiple devices.
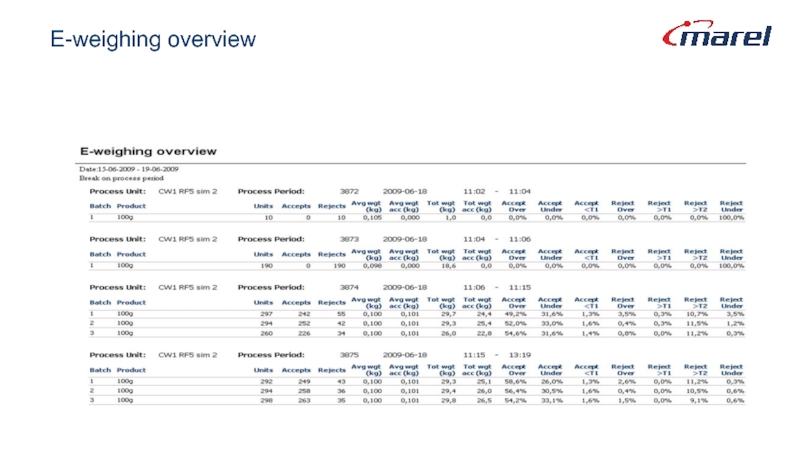
Reports allow historical analysis of give-away results.
Слайд 41WPL - Order Entry
Orders are entered into the Innova system,
And then
Production (if required)
Слайд 42Order Entry
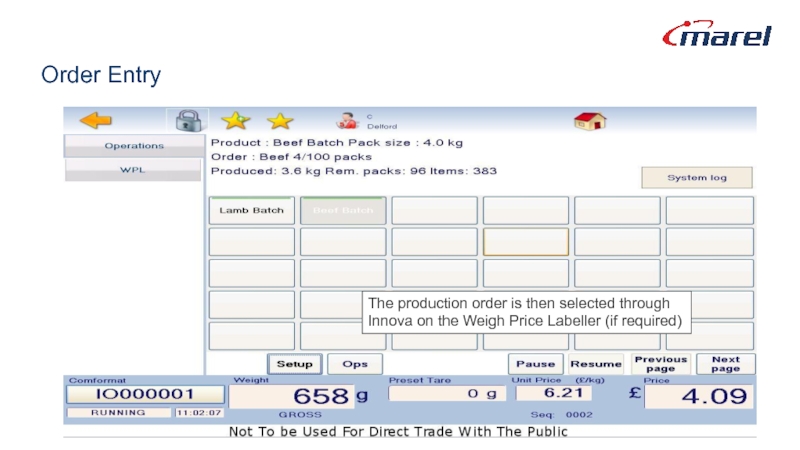
The production order is then selected through
Innova on the Weigh
Слайд 43In Production Screen on WPL
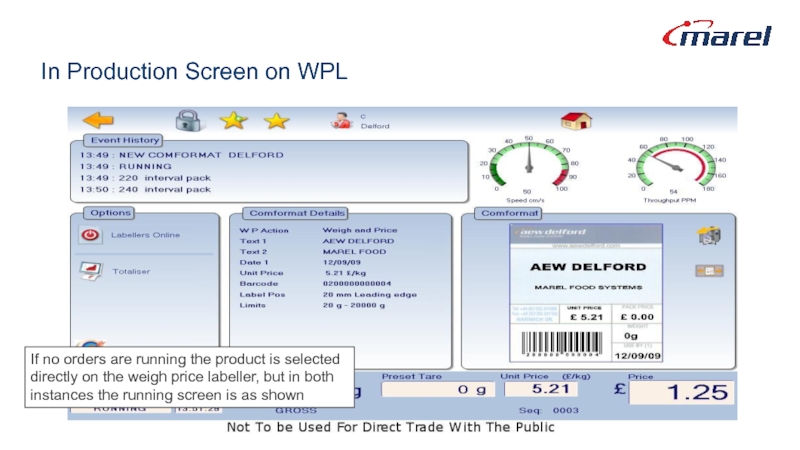
If no orders are running the product
directly on the weigh price labeller, but in both
instances the running screen is as shown
Слайд 44Individual Pack Records
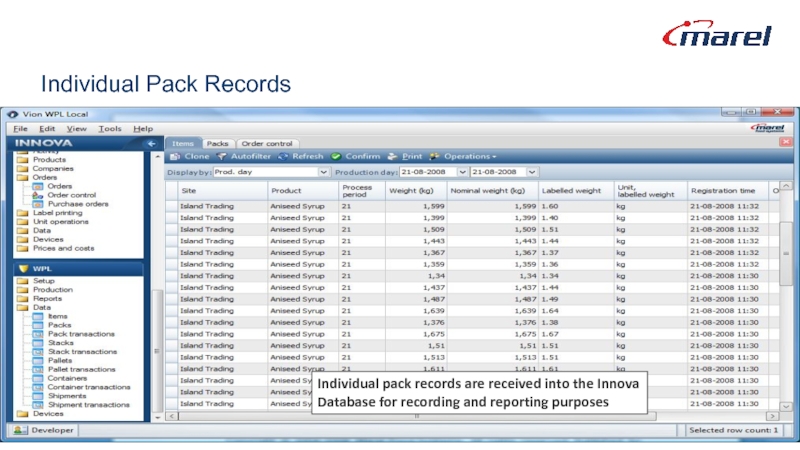
Individual pack records are received into the Innova
Database for
Слайд 46Main purpose
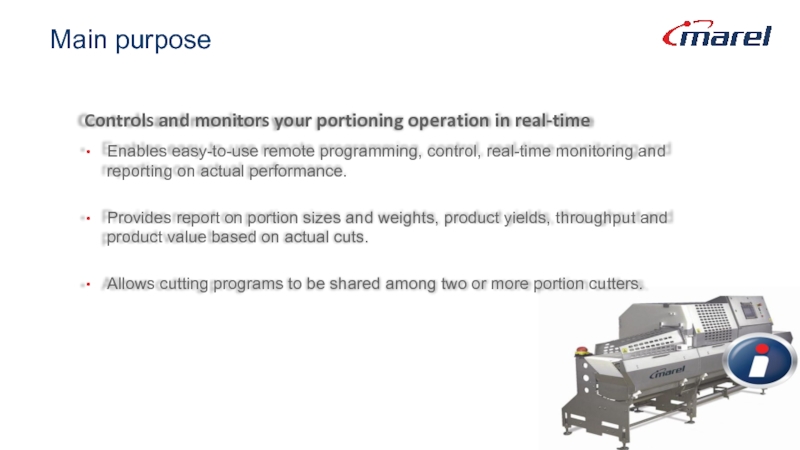
Controls and monitors your portioning operation in real-time
Enables easy-to-use remote
Provides report on portion sizes and weights, product yields, throughput and product value based on actual cuts.
Allows cutting programs to be shared among two or more portion cutters.
Слайд 49Innova Orders & shipment
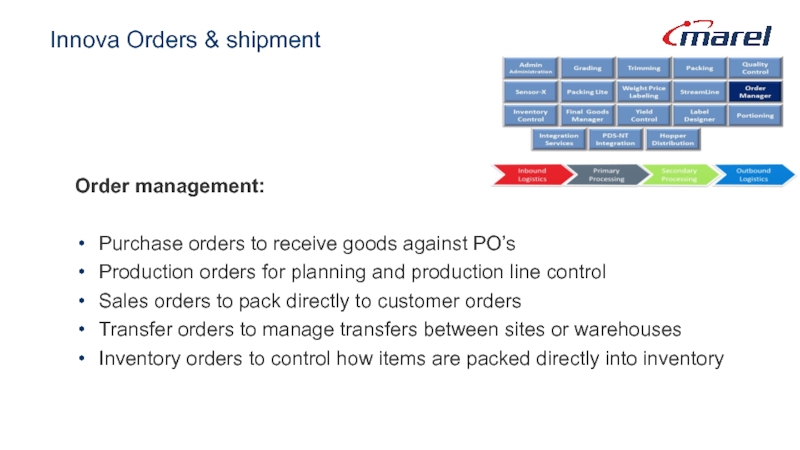
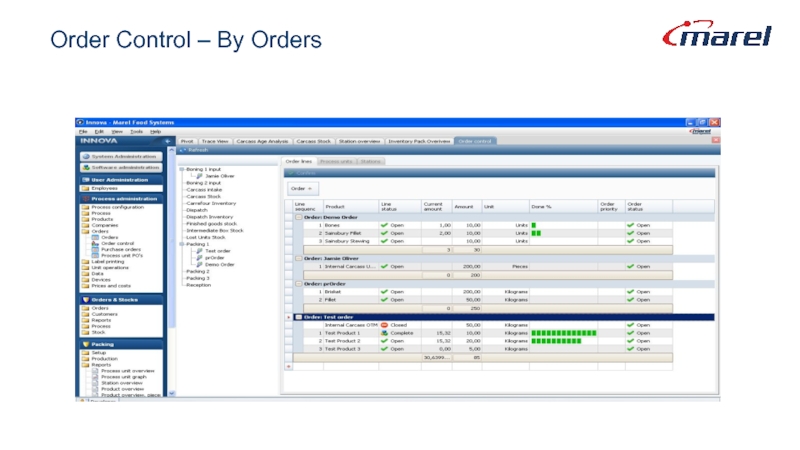
Order management:
Purchase orders to receive goods against PO’s
Production
Sales orders to pack directly to customer orders
Transfer orders to manage transfers between sites or warehouses
Inventory orders to control how items are packed directly into inventory
Слайд 50Innova orders & shipment
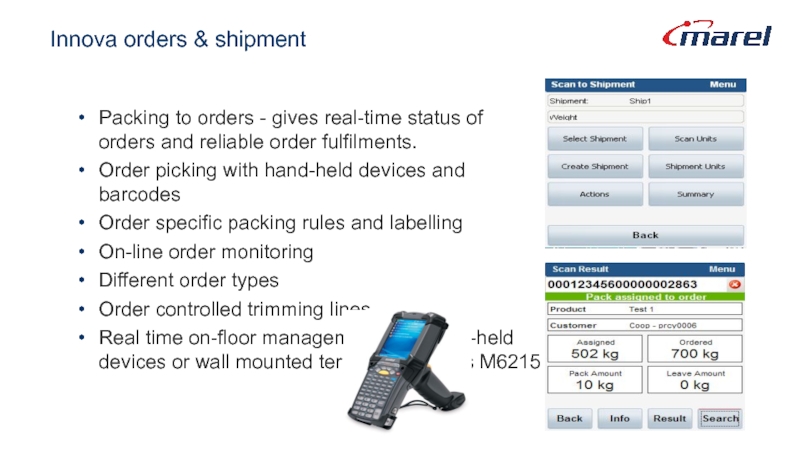
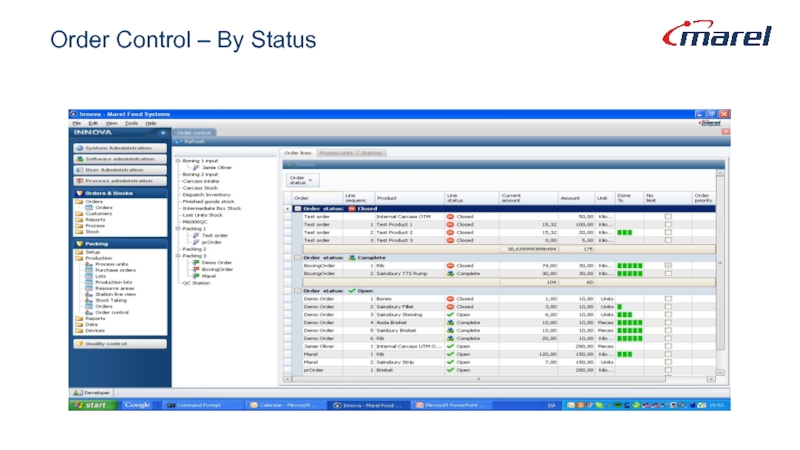
Packing to orders - gives real-time status of
Order picking with hand-held devices and barcodes
Order specific packing rules and labelling
On-line order monitoring
Different order types
Order controlled trimming lines
Real time on-floor management with hand-held devices or wall mounted terminals such as M6215
Слайд 53Innova Inventory Control
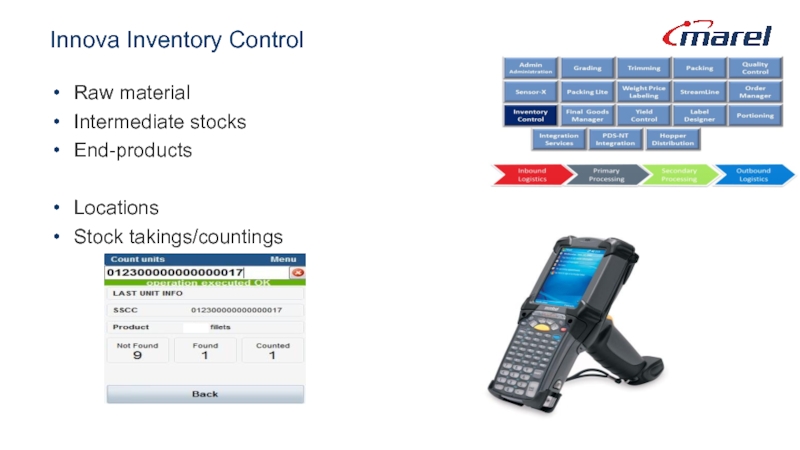
Raw material
Intermediate stocks
End-products
Locations
Stock takings/countings
Слайд 55Palletizing/Order Picking/Dispatch
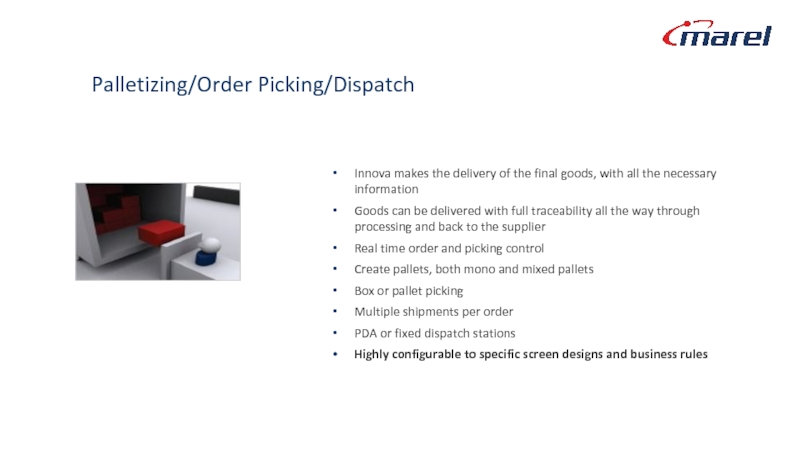
Innova makes the delivery of the final goods, with
Goods can be delivered with full traceability all the way through processing and back to the supplier
Real time order and picking control
Create pallets, both mono and mixed pallets
Box or pallet picking
Multiple shipments per order
PDA or fixed dispatch stations
Highly configurable to specific screen designs and business rules
Слайд 56Order Picking/Assign to Order & Assign to Shipment
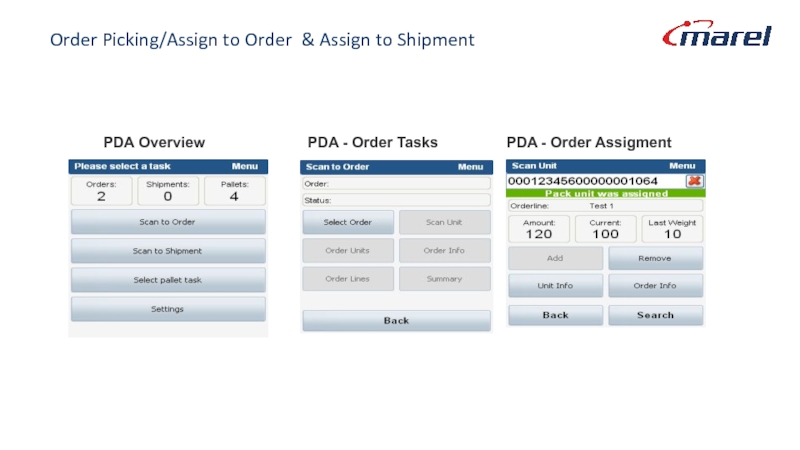
PDA Overview
PDA - Order
PDA - Order Assigment
Слайд 58Innova Inventory Control
Raw material
Intermediate stocks
End-products
Locations
Stock takings/countings
Слайд 59Raw material inventory
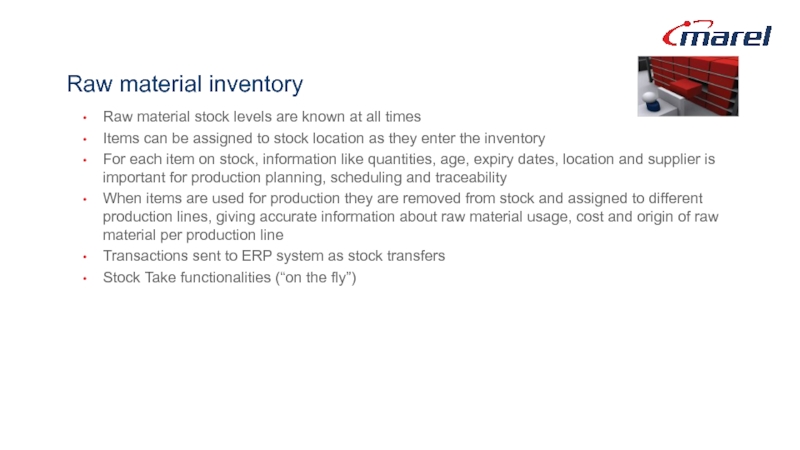
Raw material stock levels are known at all times
Items
For each item on stock, information like quantities, age, expiry dates, location and supplier is important for production planning, scheduling and traceability
When items are used for production they are removed from stock and assigned to different production lines, giving accurate information about raw material usage, cost and origin of raw material per production line
Transactions sent to ERP system as stock transfers
Stock Take functionalities (“on the fly”)
Слайд 60Finished Goods Inventory
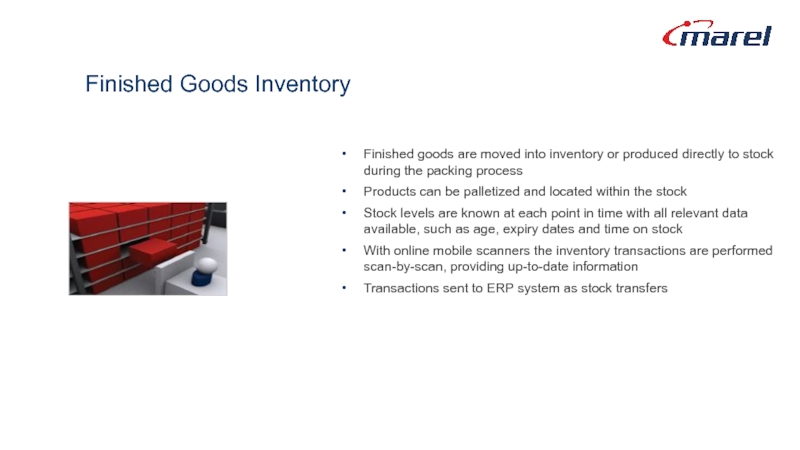
Finished goods are moved into inventory or produced directly
Products can be palletized and located within the stock
Stock levels are known at each point in time with all relevant data available, such as age, expiry dates and time on stock
With online mobile scanners the inventory transactions are performed scan-by-scan, providing up-to-date information
Transactions sent to ERP system as stock transfers
Слайд 62
INNOVA
Weight Price Labeler
Allocation
Checkweigher
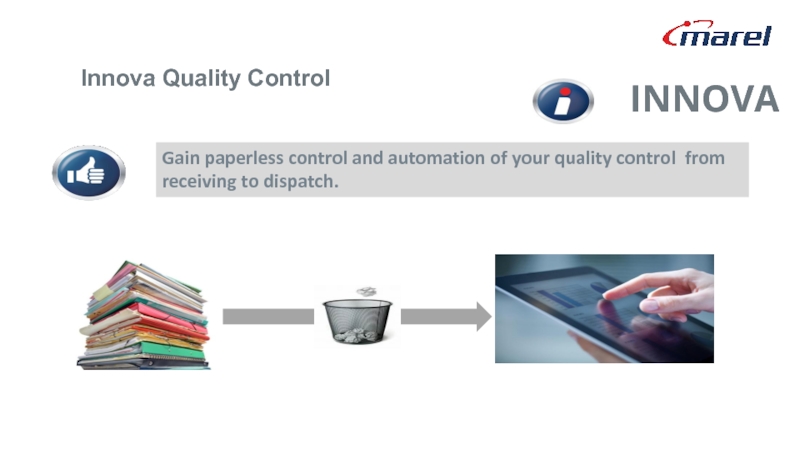
Gain paperless control and automation of your quality
Innova Quality Control
Слайд 64
INNOVA
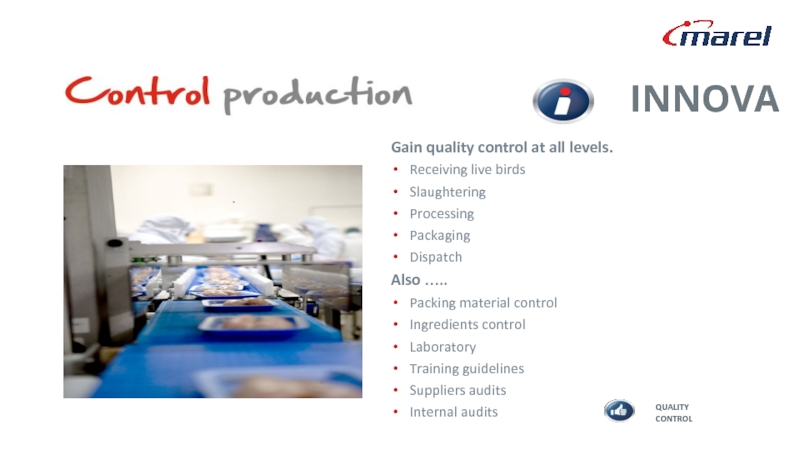
Gain quality control at all levels.
Receiving live birds
Slaughtering
Processing
Packaging
Dispatch
Also …..
Packing material control
Ingredients
Laboratory
Training guidelines
Suppliers audits
Internal audits
Слайд 65Innova QC – the benefits
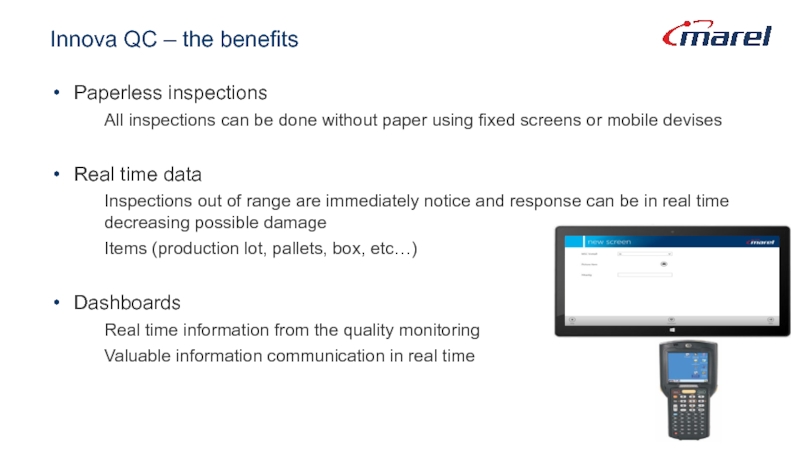
Paperless inspections
All inspections can be done
Real time data
Inspections out of range are immediately notice and response can be in real time decreasing possible damage
Items (production lot, pallets, box, etc…)
Dashboards
Real time information from the quality monitoring
Valuable information communication in real time
Слайд 66Innova QC – the benefits
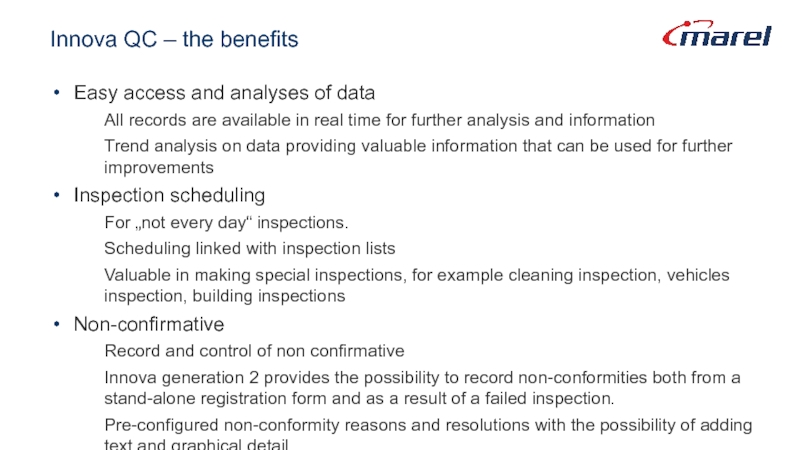
Easy access and analyses of data
All records
Trend analysis on data providing valuable information that can be used for further improvements
Inspection scheduling
For „not every day“ inspections.
Scheduling linked with inspection lists
Valuable in making special inspections, for example cleaning inspection, vehicles inspection, building inspections
Non-confirmative
Record and control of non confirmative
Innova generation 2 provides the possibility to record non-conformities both from a stand-alone registration form and as a result of a failed inspection.
Pre-configured non-conformity reasons and resolutions with the possibility of adding text and graphical detail.
Слайд 67
INNOVA
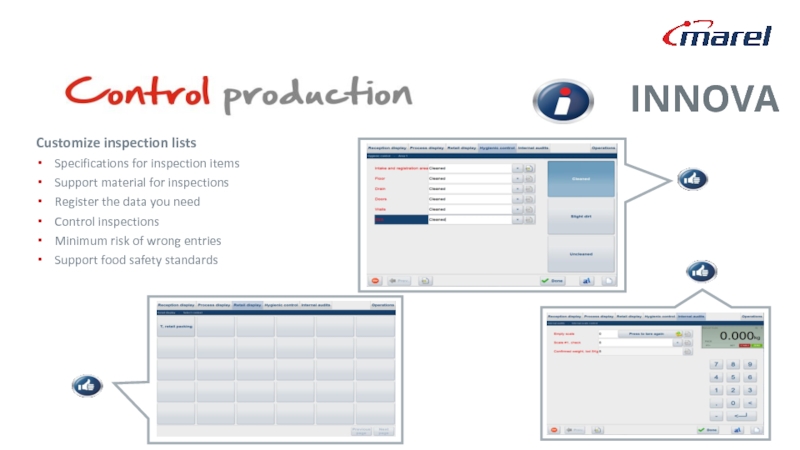
Customize inspection lists
Specifications for inspection items
Support material for inspections
Register the
Control inspections
Minimum risk of wrong entries
Support food safety standards
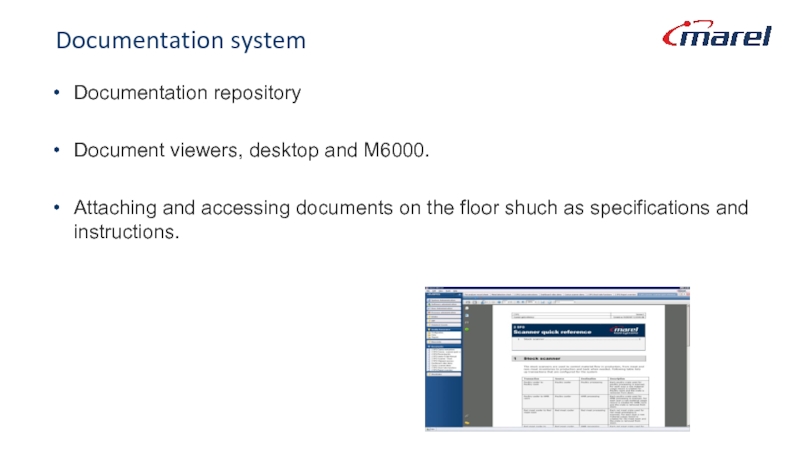
Слайд 71Documentation system
Documentation repository
Document viewers, desktop and M6000.
Attaching and accessing documents on
Слайд 76Innova Report designer
Report surface
Layout and formatting
Toolbox
Additions
Explorer and fields list
Selected item properties
Слайд 79Innova Integration Services
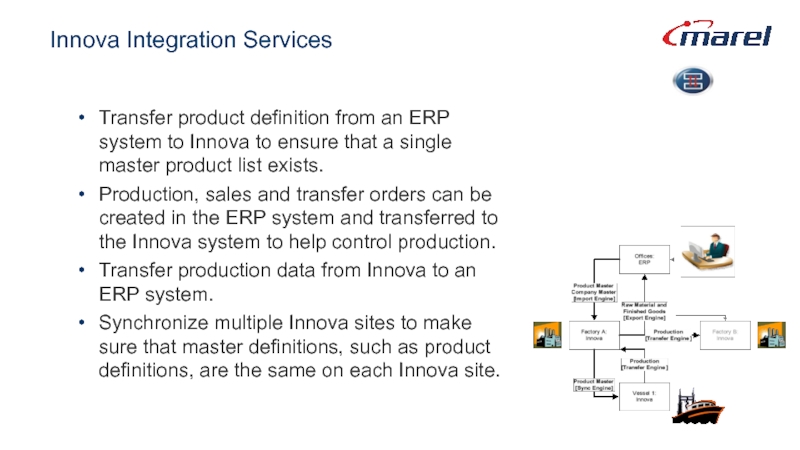
Transfer product definition from an ERP system to Innova
Production, sales and transfer orders can be created in the ERP system and transferred to the Innova system to help control production.
Transfer production data from Innova to an ERP system.
Synchronize multiple Innova sites to make sure that master definitions, such as product definitions, are the same on each Innova site.
Слайд 80Export Engine (Innova -> ERP)
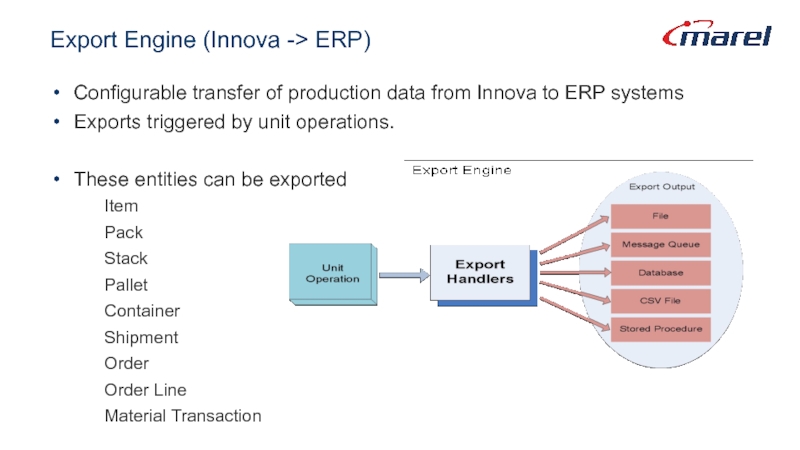
Configurable transfer of production data from Innova
Exports triggered by unit operations.
These entities can be exported
Item
Pack
Stack
Pallet
Container
Shipment
Order
Order Line
Material Transaction
Data pushed to the ERP system
Слайд 81Import Engine (ERP -> Innova)
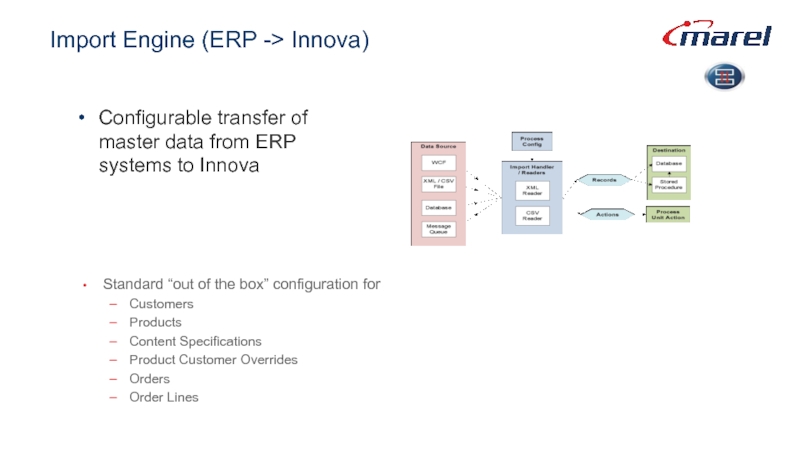
Configurable transfer of master data from ERP
Standard “out of the box” configuration for
Customers
Products
Content Specifications
Product Customer Overrides
Orders
Order Lines
Слайд 83INNOVA
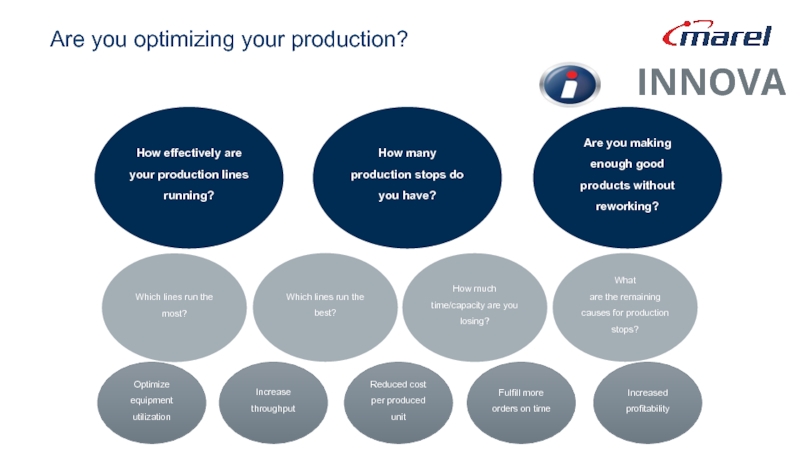
How effectively are your production lines running?
How many production stops do
Are you making enough good products without reworking?
Which lines run the most?
Which lines run the best?
How much time/capacity are you losing?
What
are the remaining causes for production stops?
Are you optimizing your production?
Optimize equipment utilization
Increase throughput
Reduced cost per produced unit
Fulfill more orders on time
Increased profitability
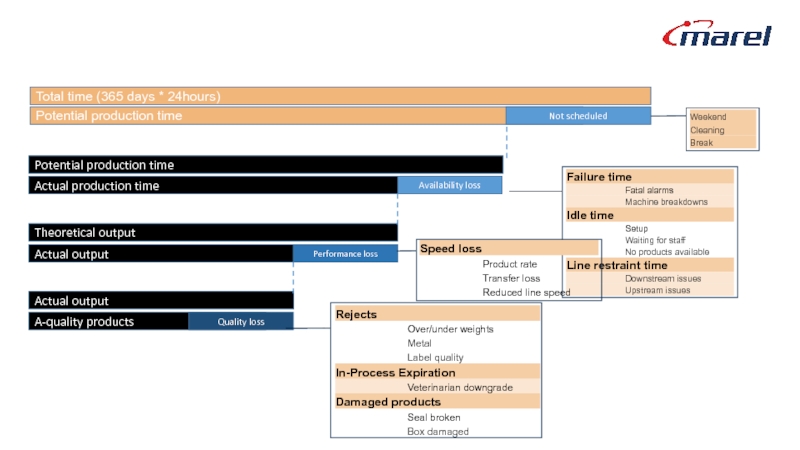
Слайд 84Potential production time
Actual production time
Availability loss
Actual output
Performance loss
A-quality products
Quality loss
Theoretical output
Actual
Total time (365 days * 24hours)
Potential production time
Not scheduled
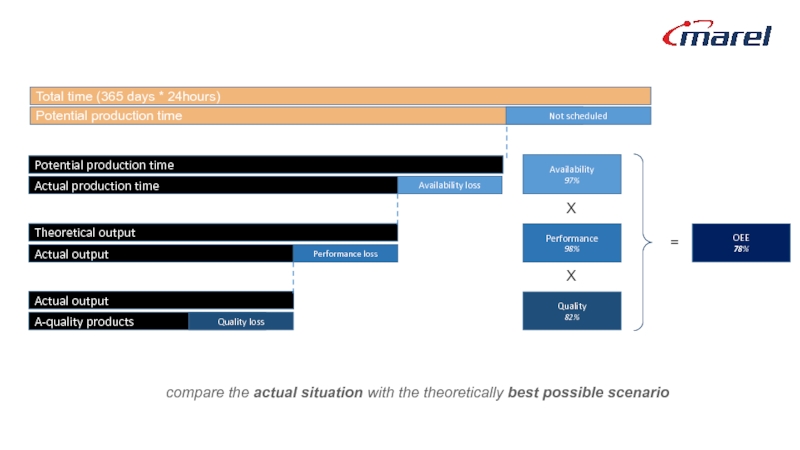
Слайд 85Potential production time
Actual production time
Availability loss
Actual output
Performance loss
A-quality products
Quality loss
Theoretical output
Actual
Availability
97%
Performance
98%
Quality
82%
Total time (365 days * 24hours)
Potential production time
Not scheduled
X
X
=
OEE
78%
compare the actual situation with the theoretically best possible scenario
Слайд 86
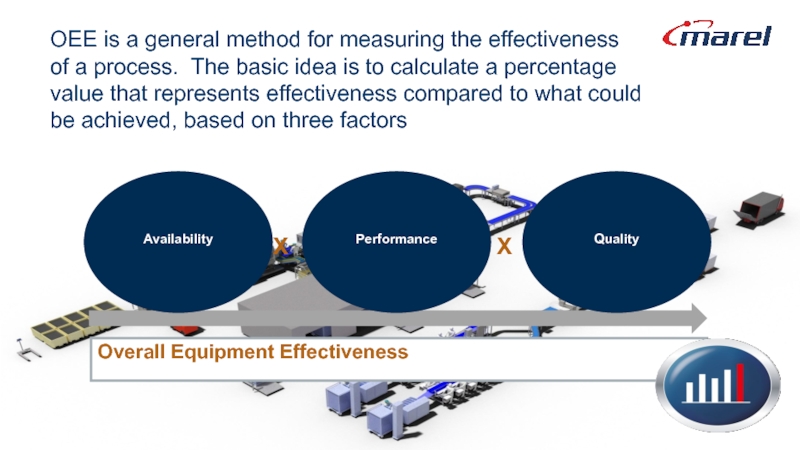
Overall Equipment Effectiveness
X
X
Availability
Performance
Quality
OEE is a general method for measuring the effectiveness
Слайд 87Elements of OEE
INNOVA
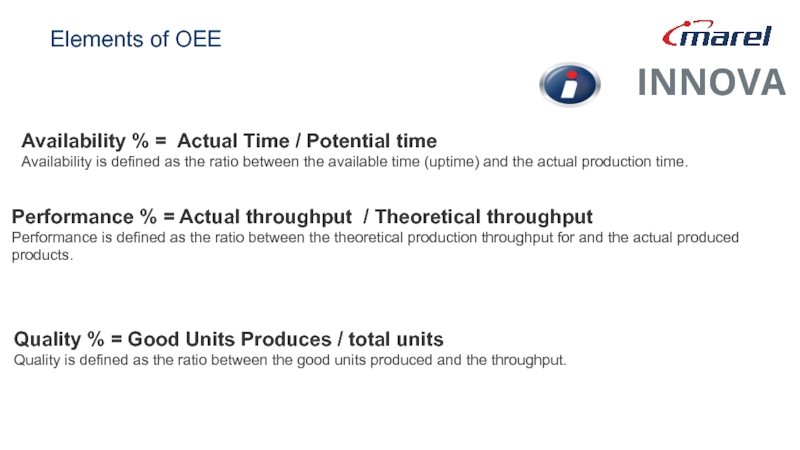
Availability % = Actual Time / Potential time
Availability is defined
Performance % = Actual throughput / Theoretical throughput
Performance is defined as the ratio between the theoretical production throughput for and the actual produced products.
Quality % = Good Units Produces / total units
Quality is defined as the ratio between the good units produced and the throughput.
Слайд 88Improve Performance with Innova OEE
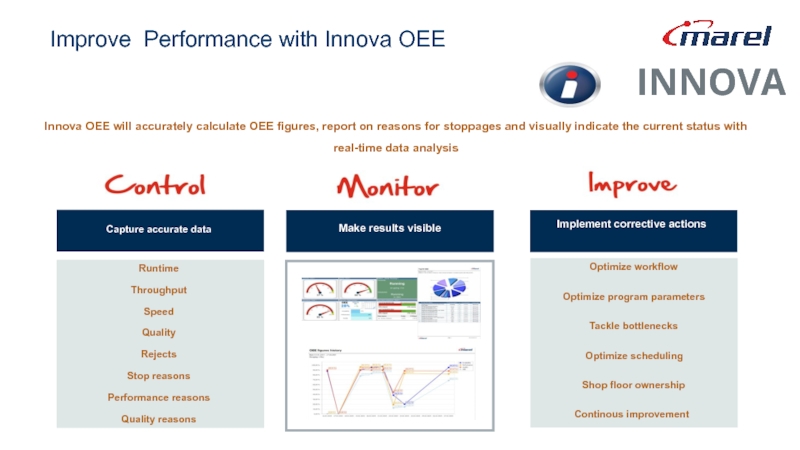
Innova OEE will accurately calculate OEE figures,
Capture accurate data
Implement corrective actions
Make results visible
Runtime
Throughput
Speed
Quality
Optimize workflow
Optimize program parameters
Rejects
Stop reasons
Quality reasons
INNOVA
Performance reasons
Tackle bottlenecks
Optimize scheduling
Shop floor ownership
Continous improvement
Слайд 89
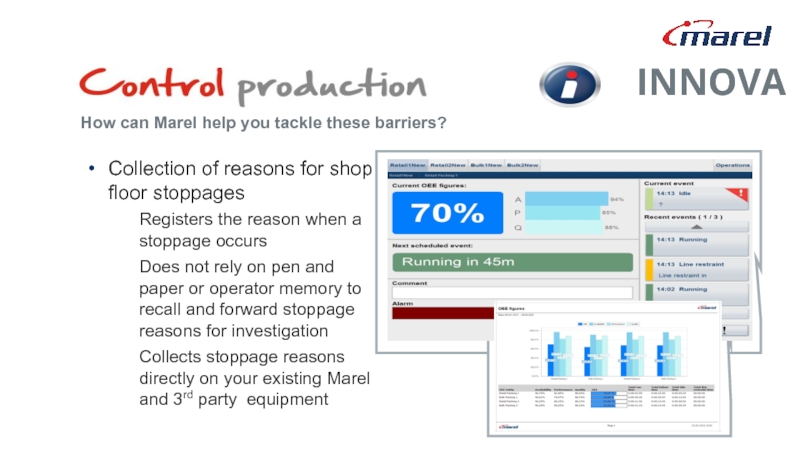
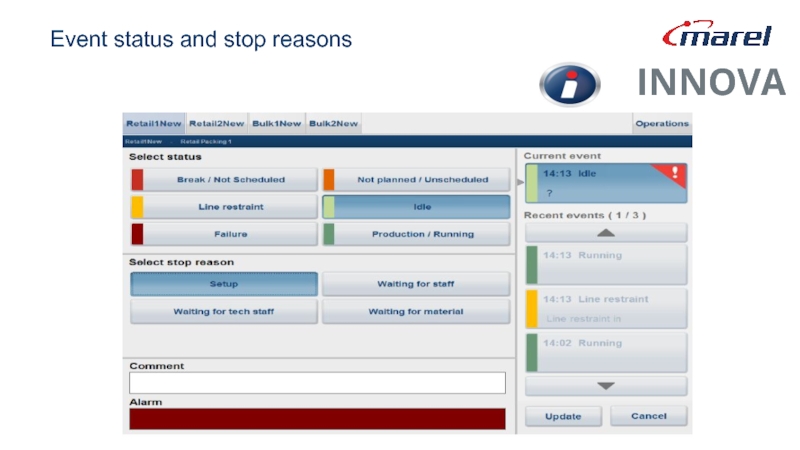
Collection of reasons for shop floor stoppages
Registers the reason when a
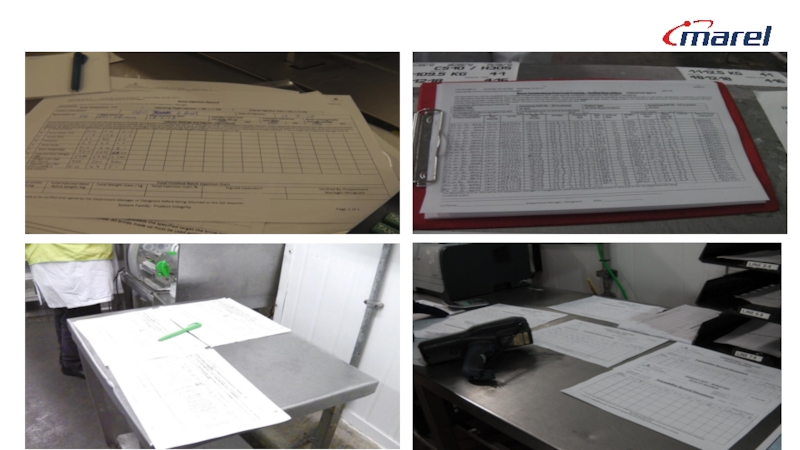
Does not rely on pen and paper or operator memory to recall and forward stoppage reasons for investigation
Collects stoppage reasons directly on your existing Marel and 3rd party equipment
How can Marel help you tackle these barriers?
INNOVA
Слайд 93
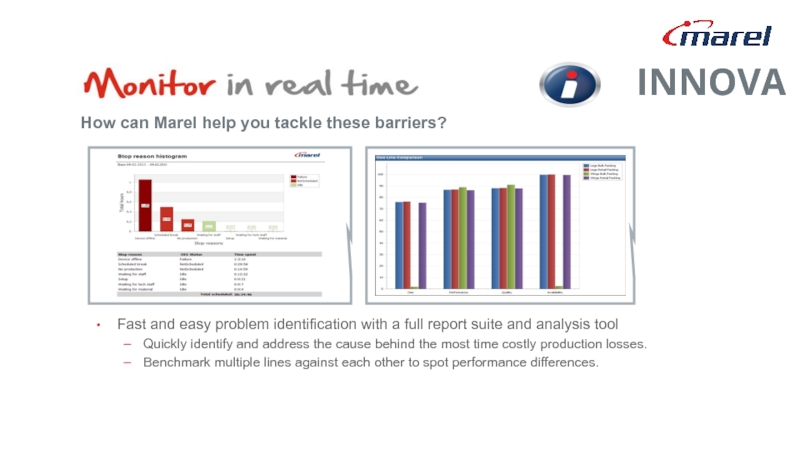
Fast and easy problem identification with a full report suite and
Quickly identify and address the cause behind the most time costly production losses.
Benchmark multiple lines against each other to spot performance differences.
How can Marel help you tackle these barriers?
INNOVA
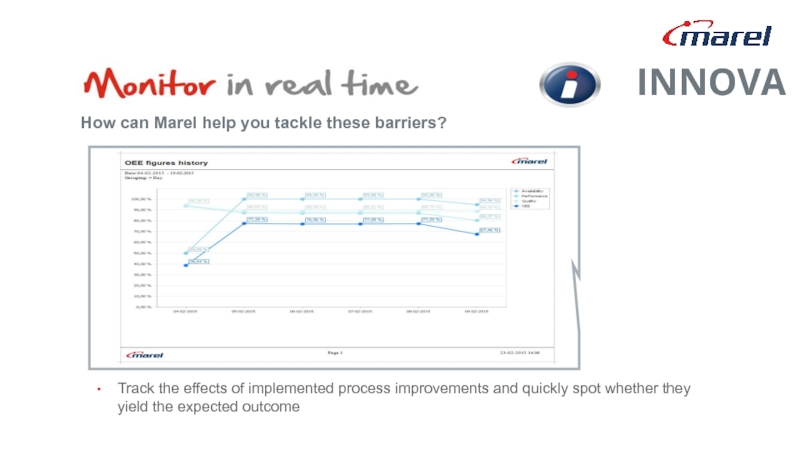
Слайд 94Track the effects of implemented process improvements and quickly spot whether
How can Marel help you tackle these barriers?
INNOVA
Слайд 95Equipment monitoring - why and how?
Maximise uptime!
In case of downtime: reduce
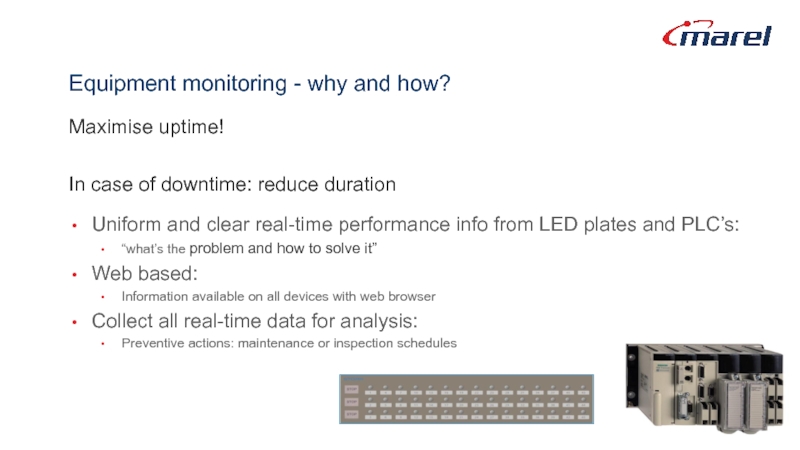
Uniform and clear real-time performance info from LED plates and PLC’s:
“what’s the problem and how to solve it”
Web based:
Information available on all devices with web browser
Collect all real-time data for analysis:
Preventive actions: maintenance or inspection schedules
Слайд 96Equipment monitoring dashboard
Level of attention:
Yellow = attention, warning
Orange = error
Red =
Слайд 110Equipment Monitoring
Available for:
GP
CAS
Transfers (TRDE-NT, TREC, TRCS, TR1G-NT)
Chiller
ATC
CIP
Department PLC’s
LED plates on switch
Слайд 123Tabel of content
Why Innova & PDS-NT
Overview Innova
Overview PDS-NT
Equipment Monitoring
Integration & customer
Слайд 124General introduction - What is PDS-NT
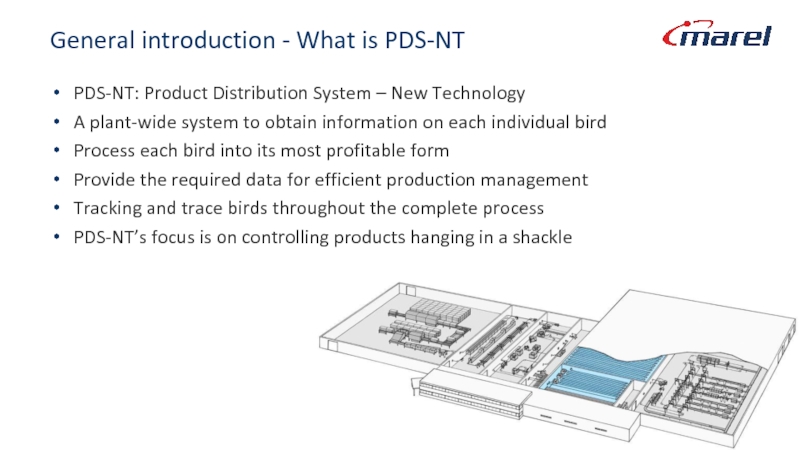
PDS-NT: Product Distribution System – New
A plant-wide system to obtain information on each individual bird
Process each bird into its most profitable form
Provide the required data for efficient production management
Tracking and trace birds throughout the complete process
PDS-NT’s focus is on controlling products hanging in a shackle
Слайд 126Data collection and control tools
PDS-XL
Floating Weight Control
Recipe Control
Combined Rate Limiting
Слайд 129PDS-NT – Standard modules
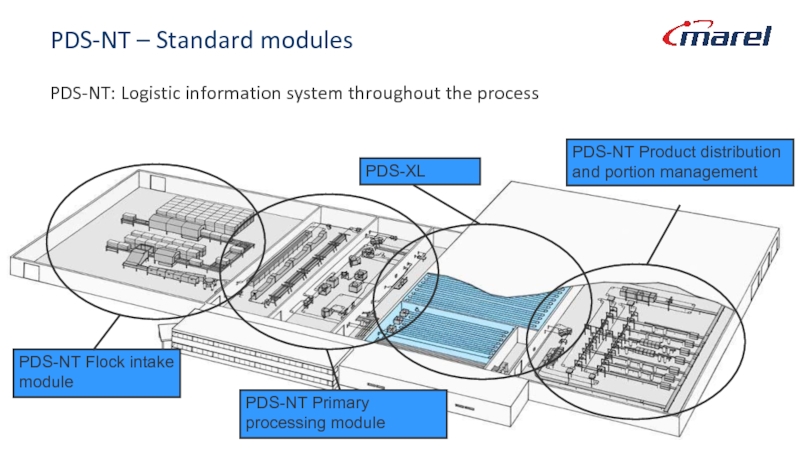
PDS-NT: Logistic information system throughout the process
PDS-NT Flock
PDS-NT Primary processing module
PDS-XL
PDS-NT Product distribution and portion management
Слайд 130PDS-NT: Primary processing
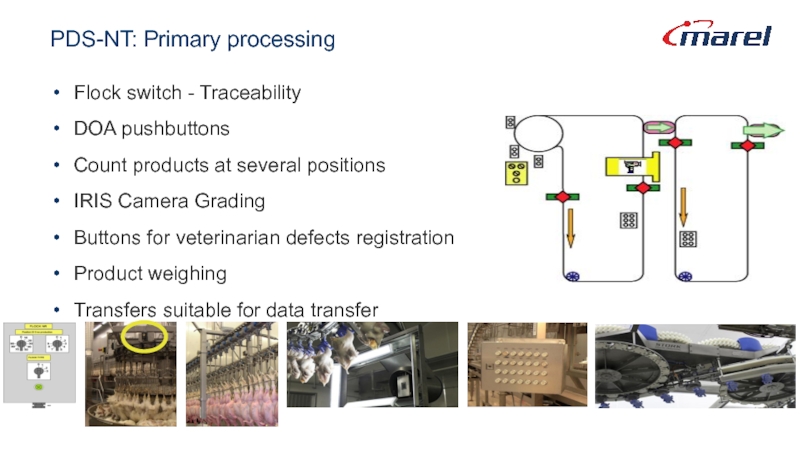
Flock switch - Traceability
DOA pushbuttons
Count products at several positions
IRIS
Buttons for veterinarian defects registration
Product weighing
Transfers suitable for data transfer
Слайд 131PDS-NT: PDS-XL
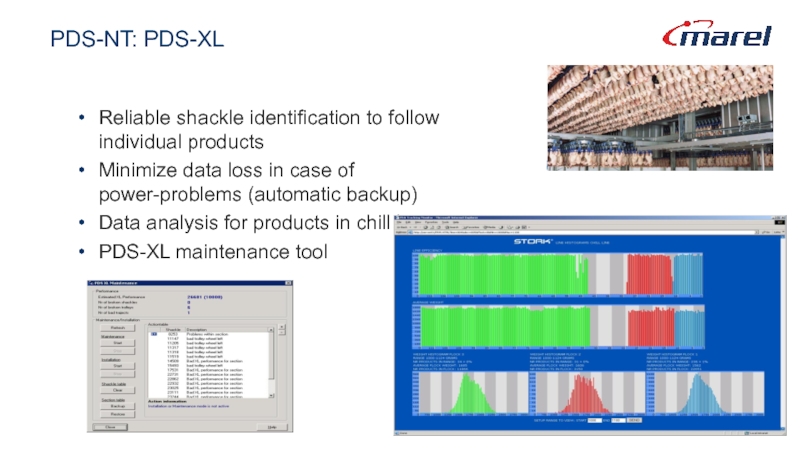
Reliable shackle identification to follow individual products
Minimize data loss
Data analysis for products in chill line
PDS-XL maintenance tool
Слайд 132PDS-XL information
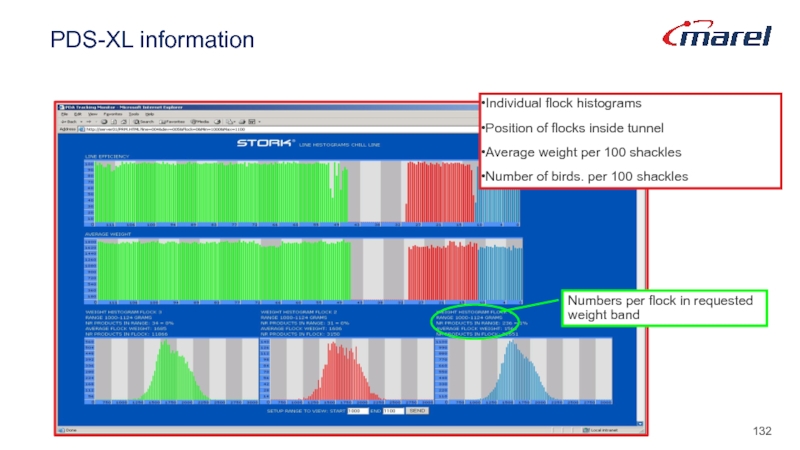
Individual flock histograms
Position of flocks inside tunnel
Average weight per 100
Number of birds. per 100 shackles
Слайд 133PDS-NT: Product distribution & portioning management
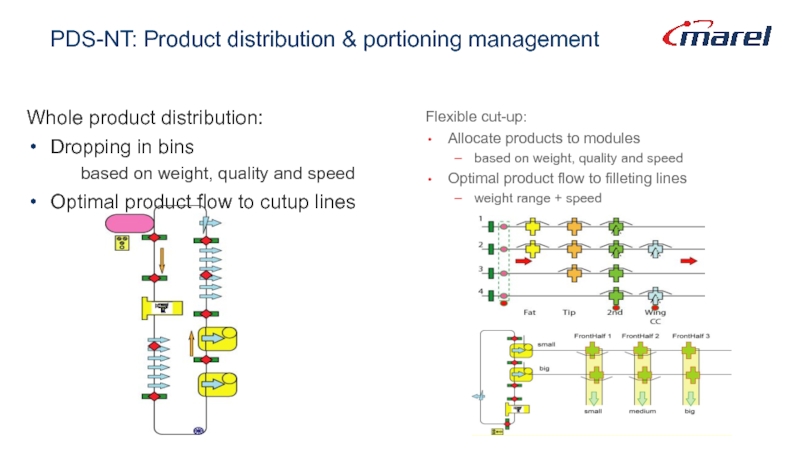
Whole product distribution:
Dropping in bins
based on
Optimal product flow to cutup lines
Flexible cut-up:
Allocate products to modules
based on weight, quality and speed
Optimal product flow to filleting lines
weight range + speed
Слайд 134Recipe control
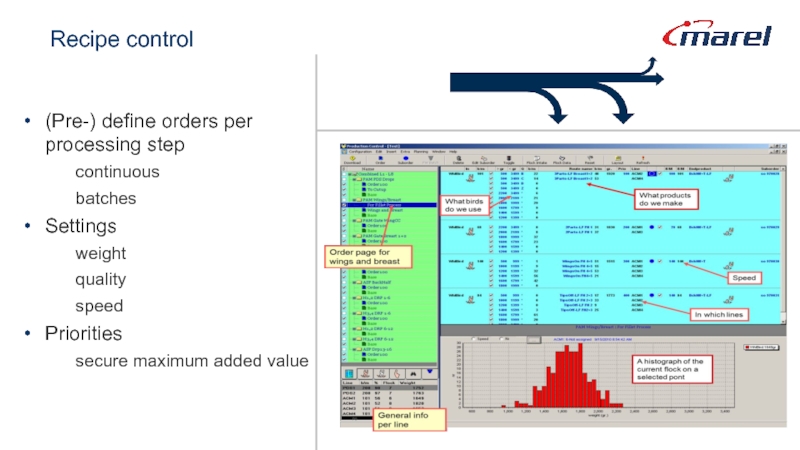
(Pre-) define orders per processing step
continuous
batches
Settings
weight
quality
speed
Priorities
secure maximum added value
Слайд 135
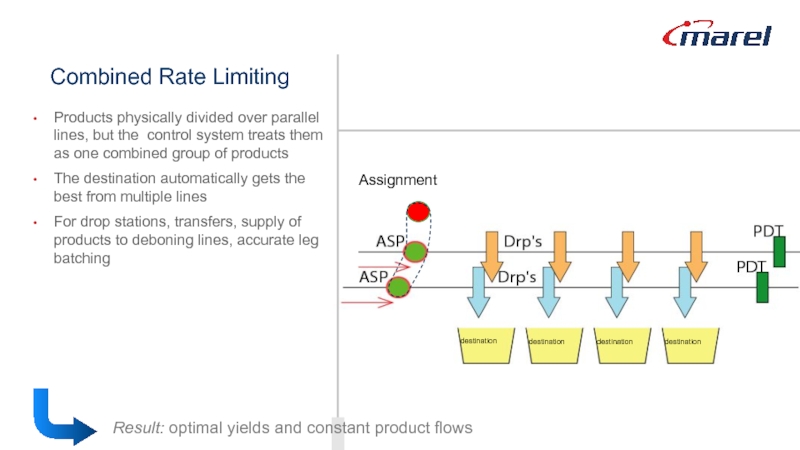
Products physically divided over parallel lines, but the control system treats
The destination automatically gets the best from multiple lines
F
For drop stations, transfers, supply of products to deboning lines, accurate leg batching
Combined Rate Limiting
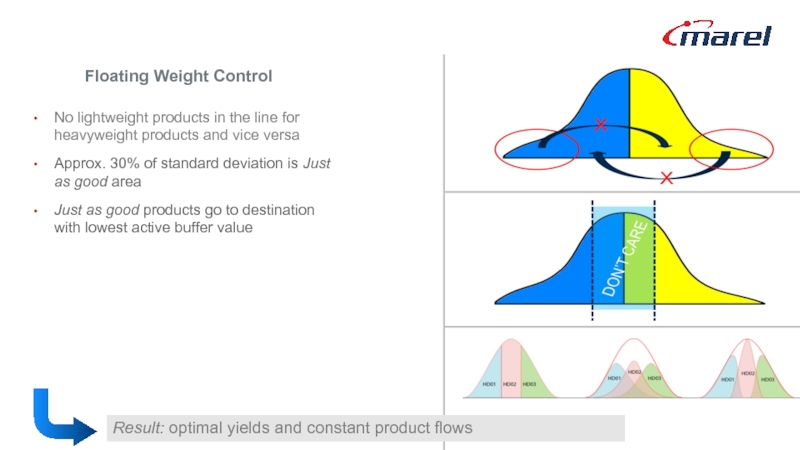
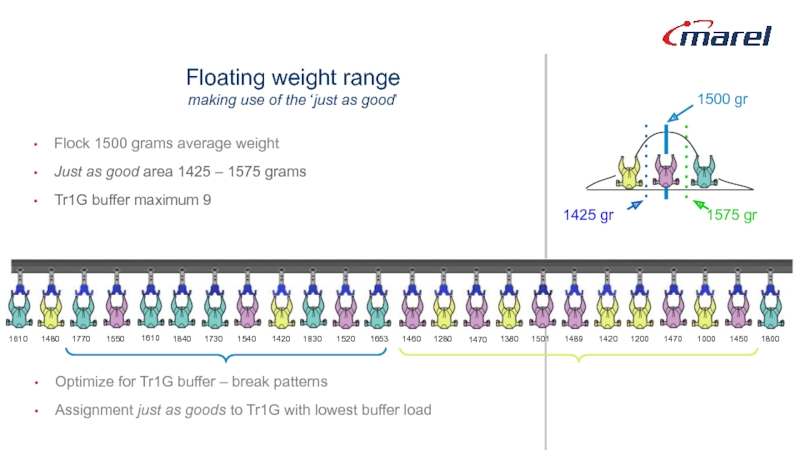
Слайд 136No lightweight products in the line for heavyweight products and vice
Approx. 30% of standard deviation is Just as good area
Just as good products go to destination with lowest active buffer value
Floating Weight Control
Слайд 137Floating weight range
making use of the ‘just as good’
1730
1540
1420
1830
1520
1653
1460
1280
1840
1610
1550
1770
1480
1610
1501
1489
1420
1200
1470
1000
1450
1800
1380
1470
Flock 1500 grams
Just as good area 1425 – 1575 grams
Tr1G buffer maximum 9
Optimize for Tr1G buffer – break patterns
Assignment just as goods to Tr1G with lowest buffer load
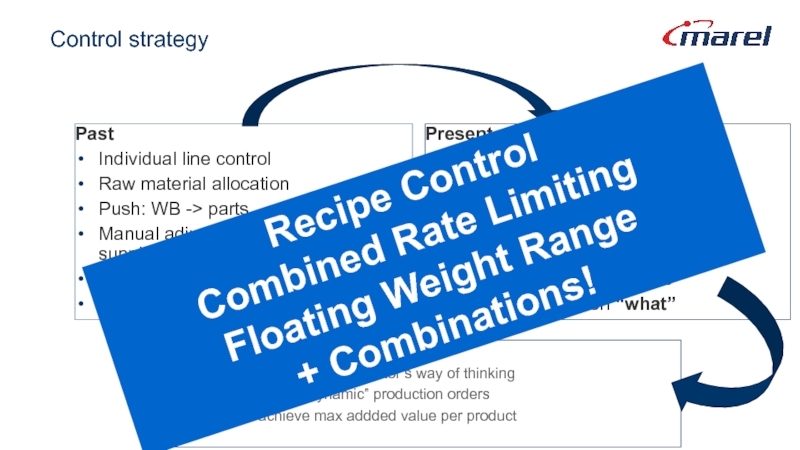
Слайд 138Control strategy
Past
Individual line control
Raw material allocation
Push: WB -> parts
Manual adjustments to
Operator decides/combines
Operator’s focus on “how”
Present and future developments
Combined multiple line control
End product control
Pull: parts -> WB
Automatic adjustments to changes in supply
Systems decides/combines
Operator’s focus on “what”
Advantages
More alligned with the operator’s way of thinking
Easier to define “dynamic” production orders
Easier to achieve max addded value per product
Recipe Control
Combined Rate Limiting
Floating Weight Range
+ Combinations!
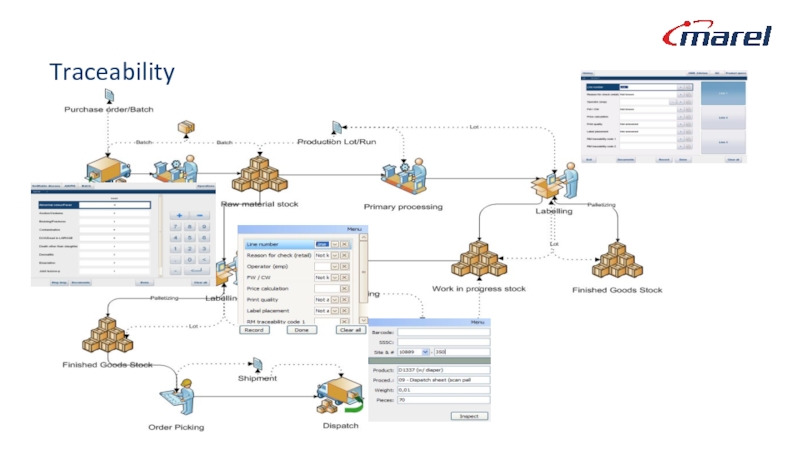
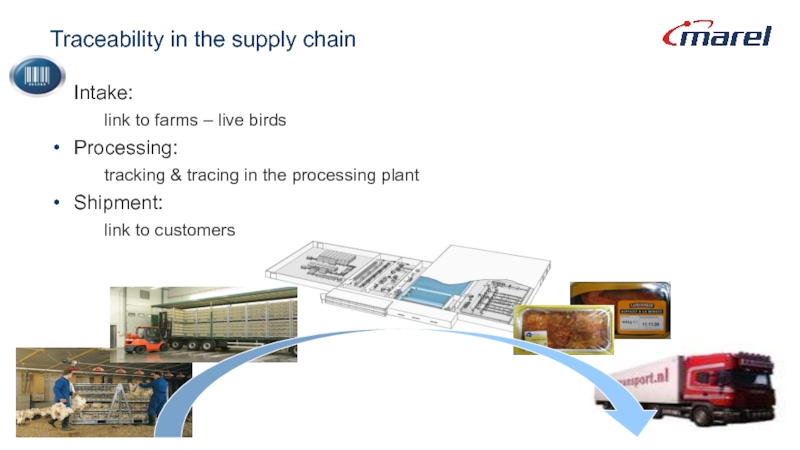
Слайд 146Traceability in the supply chain
Intake:
link to farms – live birds
Processing:
tracking & tracing in the processing plant
Shipment:
link to customers
Слайд 151Traceability in Innova - processes
Same logic used if more than one
Lots be automaticly forwarded to a specific device or process when physically at that location
Can also be controlled by buttons or manually activated if needed
Can be based on automated and manual data collection
Слайд 152Innova and PDS-NT - Benefits to our customers
The ideal tool to
Fully integrated process control from supply up till cutup/deboning
Full tracking and tracing throughout all lines
Integrated dashboarding and reporting
Modular system
Слайд 153Tabel of content
Why Innova & PDS-NT
Overview Innova
Overview PDS-NT
Equipment Monitoring
Integration & customer
Слайд 154Equipment monitoring dashboard
Maximal uptime!
Uniform and clear real-time performance info
Web based: available
Collect all real-time data for analysis
Слайд 159Tabel of content
Why Innova & PDS-NT
Overview Innova
Overview PDS-NT
Equipment Monitoring
Integration & customer
Слайд 160How we cover the entire process
Inbound Logistics
Primary Processing
Secondary Processing
Outbound Logistics
Order Picking
Dispatch
Shipment
Inventory
DOA registration
Product counting
Vet inspection
Camera grading
Product weighing
Product distribution
Portioning
Trimming
Sensor-X
Grading
Yield
Check weighing
WPL
Packing
Palletizing
Receiving of Goods
Live bird Receiving
Container weighing
Inventory management
Traceability/Dash Boarding/Reporting/QA/Order Management
ERP Integrations
Слайд 161Innova – PDS-NT: integrated T&T
New Innova application
to define flock number
Слайд 165With Innova & PDS-NT you get…
A tool to measure the
Full control over the production process
Yield monitoring
Throughput monitoring
Inventory control
Traceability
Complete order control
Integration with ERP systems
Scalability - modularity
Proven solutions based on +2,000 installations over last 15 years
