CMOS IMAGE SENSORS
- Главная
- Разное
- Дизайн
- Бизнес и предпринимательство
- Аналитика
- Образование
- Развлечения
- Красота и здоровье
- Финансы
- Государство
- Путешествия
- Спорт
- Недвижимость
- Армия
- Графика
- Культурология
- Еда и кулинария
- Лингвистика
- Английский язык
- Астрономия
- Алгебра
- Биология
- География
- Детские презентации
- Информатика
- История
- Литература
- Маркетинг
- Математика
- Медицина
- Менеджмент
- Музыка
- МХК
- Немецкий язык
- ОБЖ
- Обществознание
- Окружающий мир
- Педагогика
- Русский язык
- Технология
- Физика
- Философия
- Химия
- Шаблоны, картинки для презентаций
- Экология
- Экономика
- Юриспруденция
EMVA 1288 Standard for measurement and presentation of specifications for machine vision. Sensors and cameras презентация
Содержание
- 1. EMVA 1288 Standard for measurement and presentation of specifications for machine vision. Sensors and cameras
- 2. Why we need EMVA 1288 Standard EMVA
- 3. Motivation Existing Standards for cameras are not
- 4. The EMVA 1288 Working Group (logos status
- 5. Current status Standard Release 2.0 Covers
- 6. Illumination Setup from Module 1 Homogenous
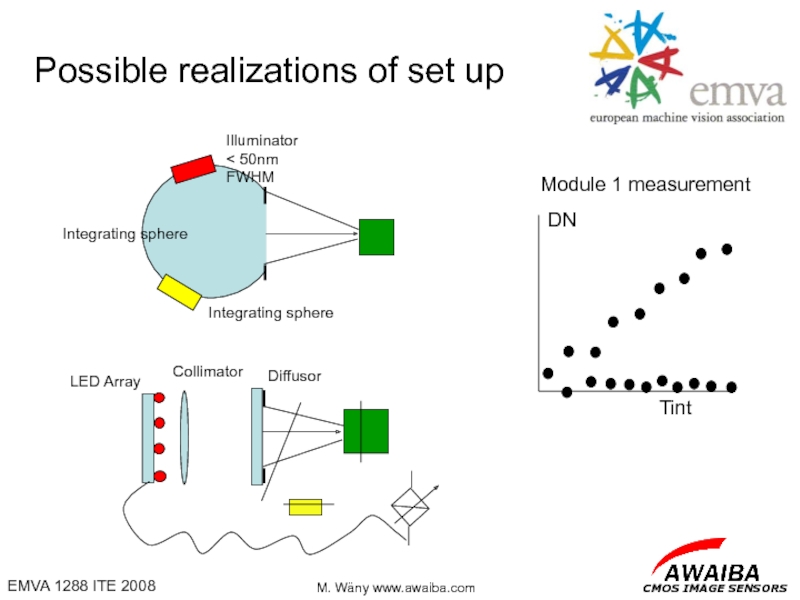
- 7. Module 1 measurement Possible realizations of set up
- 8. Outlook measurement setup variation for Color module
- 9. Camera Mathematical Model
- 10. Standard 1288 Module 1 3) Basic Information
- 11. EXAMPLE DR-4k-7 AVAILABLE under www.awaiba.com/en/products
- 12. Standard 1288 Module 1 4) Operation Point
- 13. EXAMPLE DR-4k7 AVAILABLE under www.awaiba.com/en/products
- 14. Standard 1288 Module 1 5) Measurement Scans
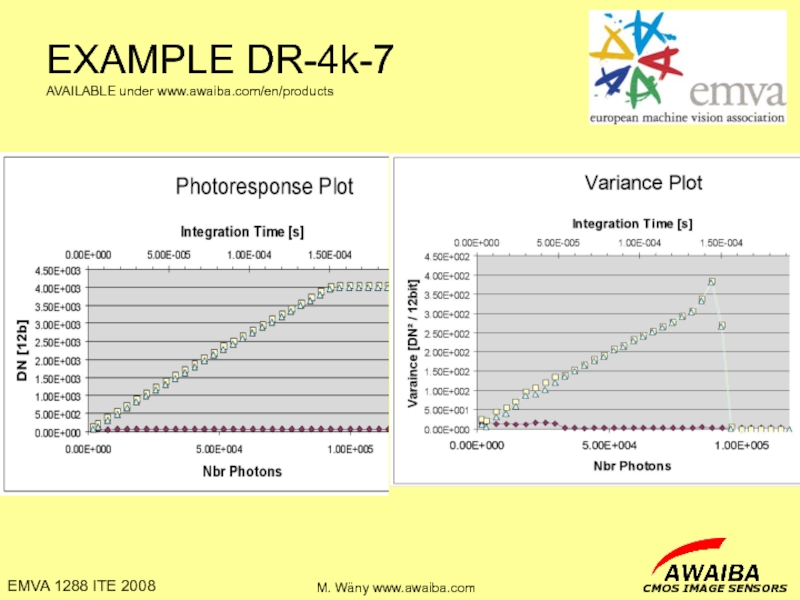
- 15. EXAMPLE DR-4k-7 AVAILABLE under www.awaiba.com/en/products
- 16. Standard 1288 Module 1 6) Photon Transfer
- 17. EXAMPLE DR-4k-7 AVAILABLE under www.awaiba.com/en/products
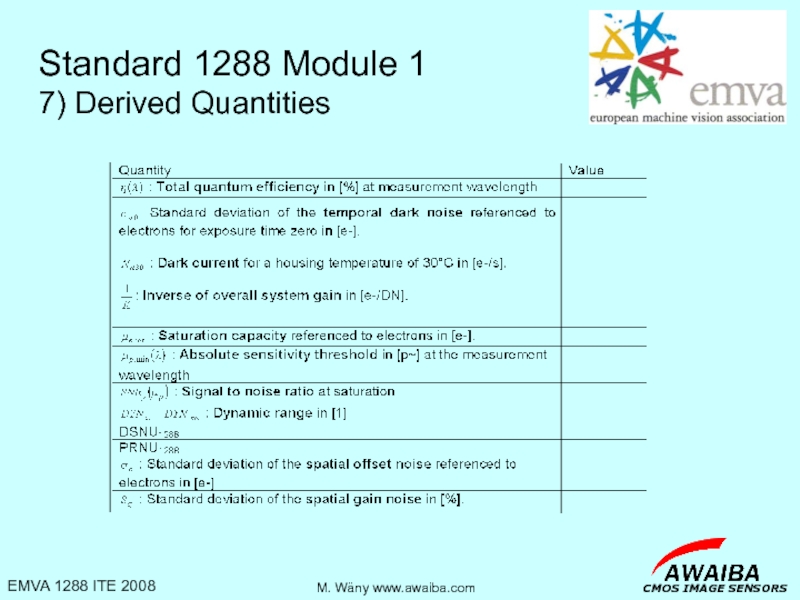
- 18. Standard 1288 Module 1 7) Derived Quantities
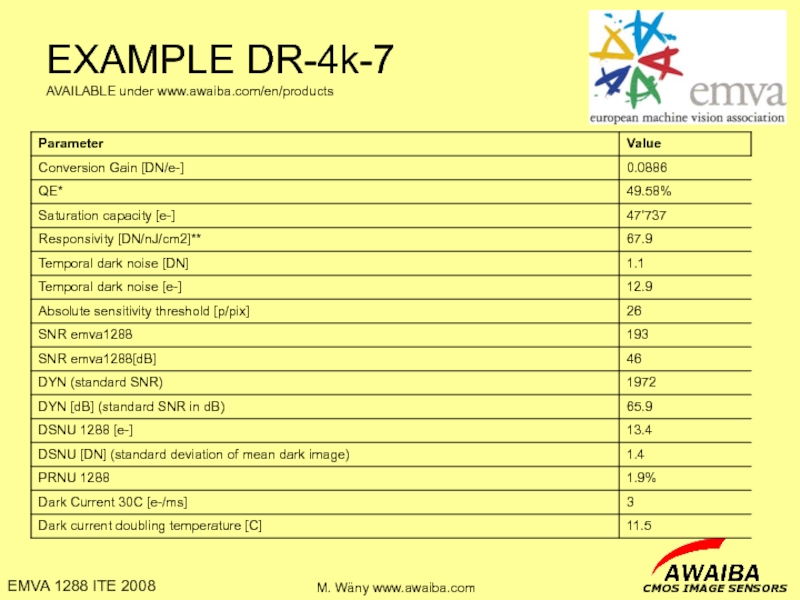
- 19. EXAMPLE DR-4k-7 AVAILABLE under www.awaiba.com/en/products
- 20. Standard 1288 Module 1 8) SNR Plot
- 21. EXAMPLE DR-4k-7 AVAILABLE under www.awaiba.com/en/products DYN =
- 22. Standard 1288 Module 1 9) Quantum Efficiency
- 23. EXAMPLE DR-4k-7 AVAILABLE under www.awaiba.com/en/products
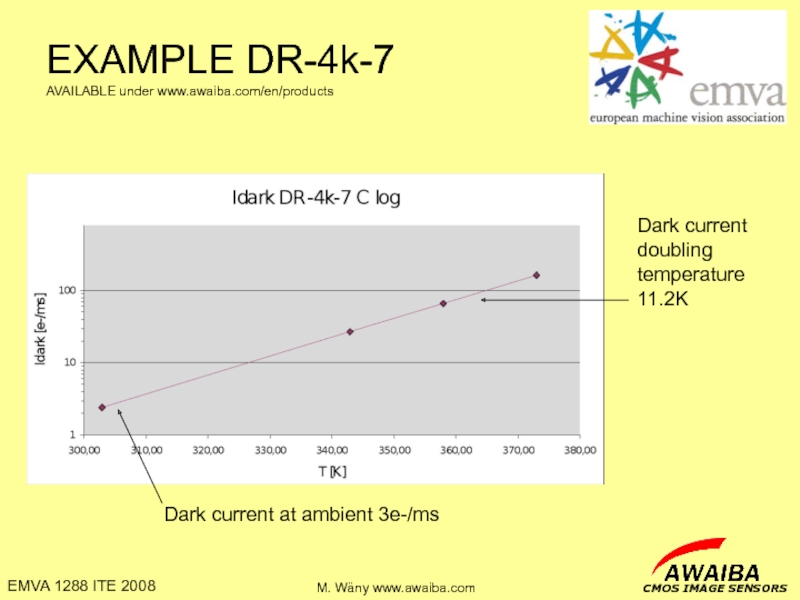
- 24. Standard 1288 Module 1 10) Dark Current
- 25. EXAMPLE DR-4k-7 AVAILABLE under www.awaiba.com/en/products Dark current doubling temperature 11.2K Dark current at ambient 3e-/ms
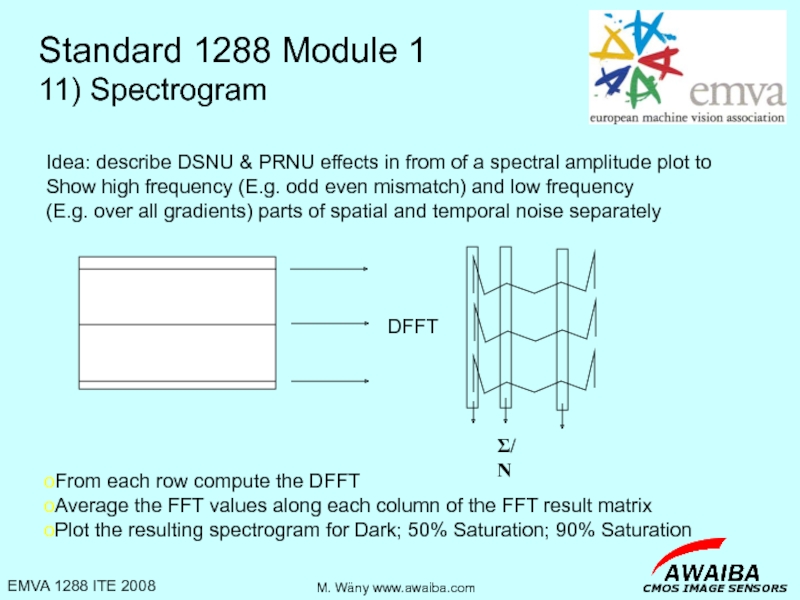
- 26. Standard 1288 Module 1 11) Spectrogram From
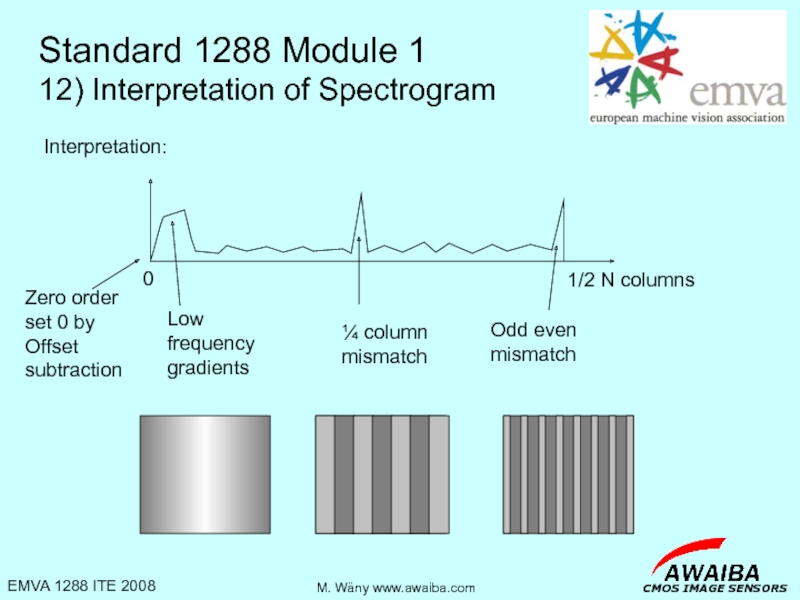
- 27. Standard 1288 Module 1 12) Interpretation of
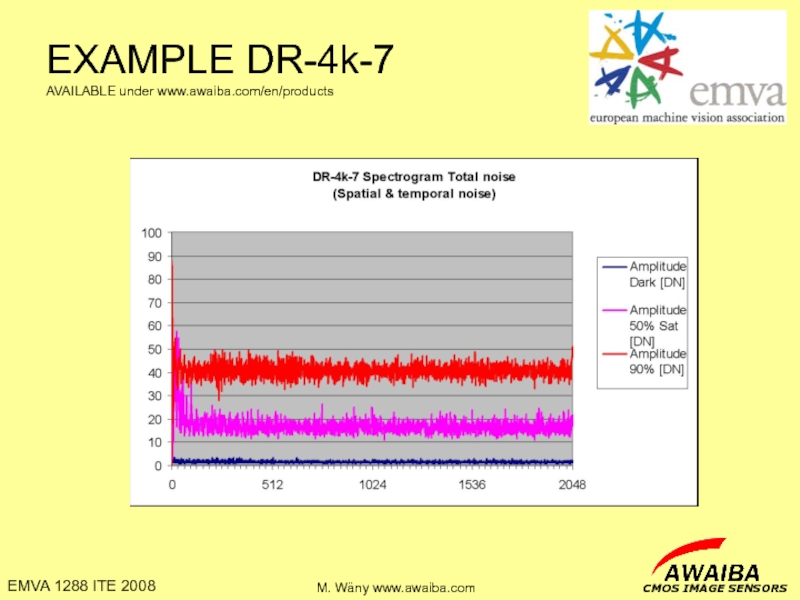
- 28. EXAMPLE DR-4k-7 AVAILABLE under www.awaiba.com/en/products
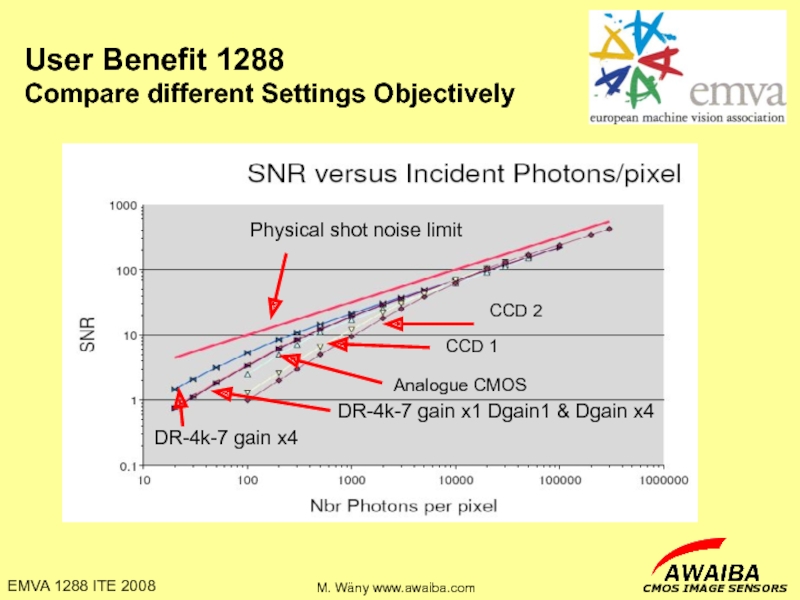
- 29. User Benefit 1288 Compare different Settings Objectively
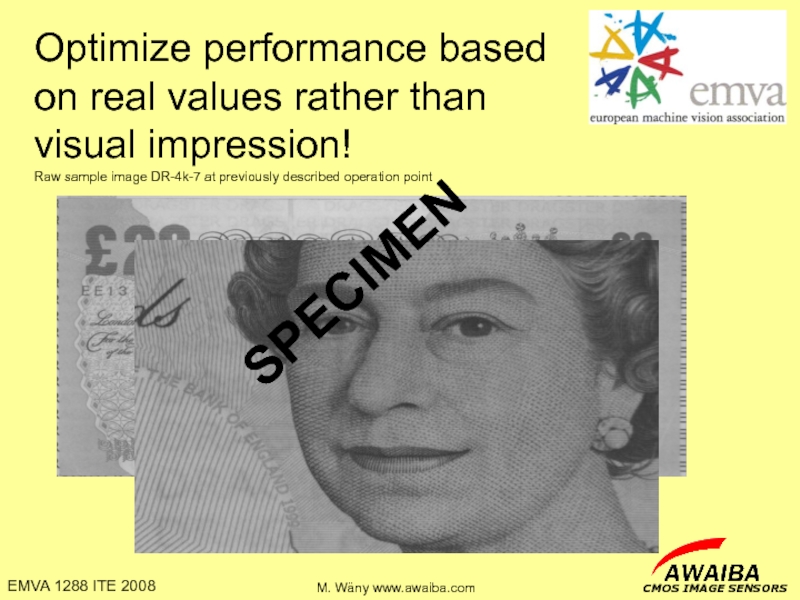
- 30. Optimize performance based on real values rather
- 31. Thank you for your attention In
Слайд 1Clear definitions for a clear VISION
EMVA 1288 Standard for Measurement and
Слайд 2Why we need EMVA 1288 Standard
EMVA 1288 Standard organization
Measurement setup
1288 Module
Interpretation of the standard for the user
Agenda
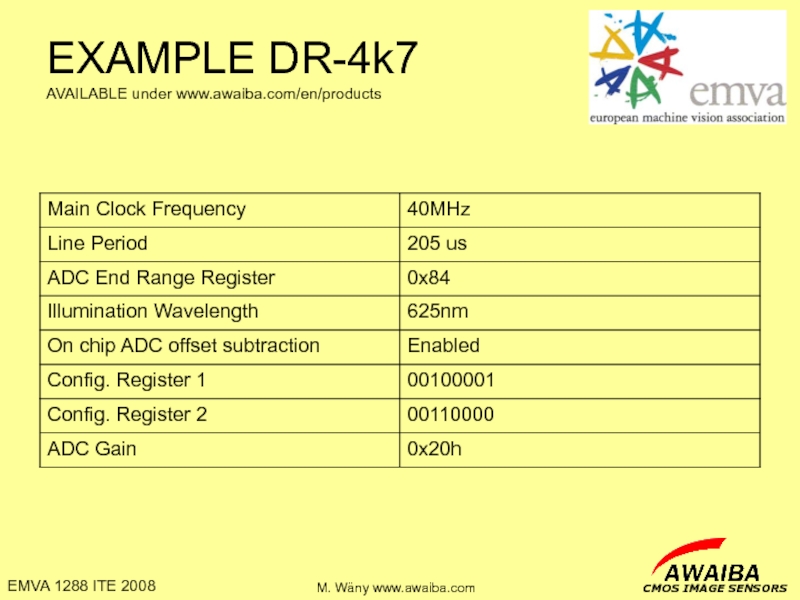
Example DR-4k-7
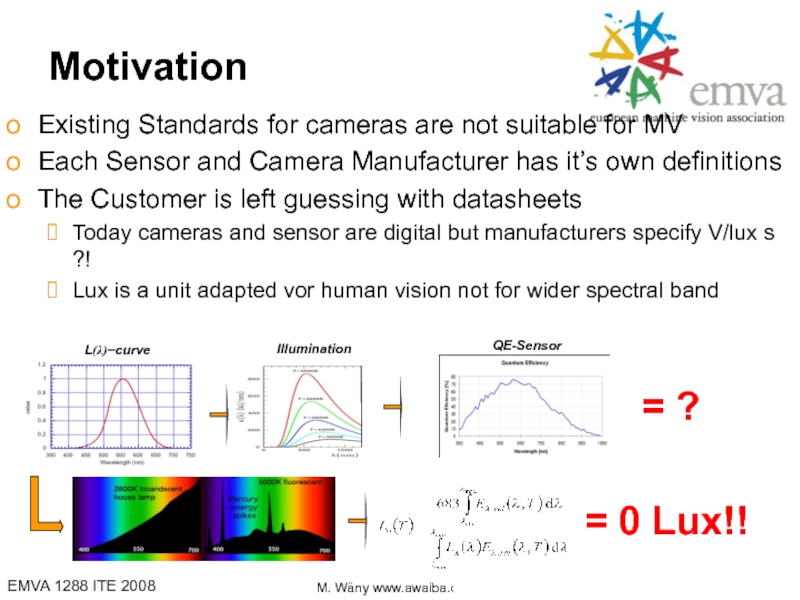
Слайд 3Motivation
Existing Standards for cameras are not suitable for MV
Each Sensor and
The Customer is left guessing with datasheets
Today cameras and sensor are digital but manufacturers specify V/lux s ?!
Lux is a unit adapted vor human vision not for wider spectral band
L(λ)−curve
QE-Sensor
Illumination
= 0 Lux!!
= ?
Слайд 4The EMVA 1288 Working Group (logos status 2007)
The EMVA 1288 Working
Слайд 5Current status
Standard Release 2.0
Covers Sensitivity Spatial and Temporal Noise; Linearity
Adapted
Published data on www.standard1288.org from
AWAIBA
BASLER
PCO
Supported world wide by agreement between JIIA, AIA & EMVA on G3 standardization frame work
Слайд 6
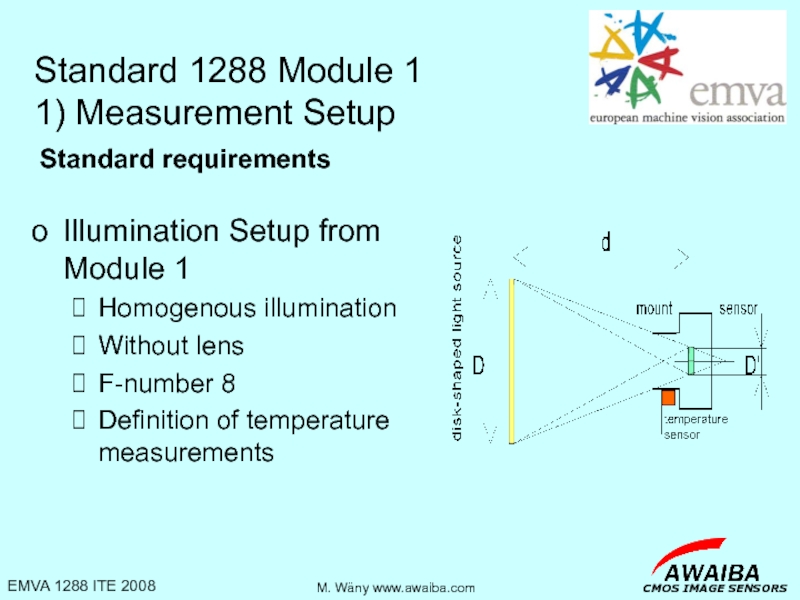
Illumination Setup from Module 1
Homogenous illumination
Without lens
F-number 8
Definition of temperature measurements
Standard
Standard 1288 Module 1
1) Measurement Setup
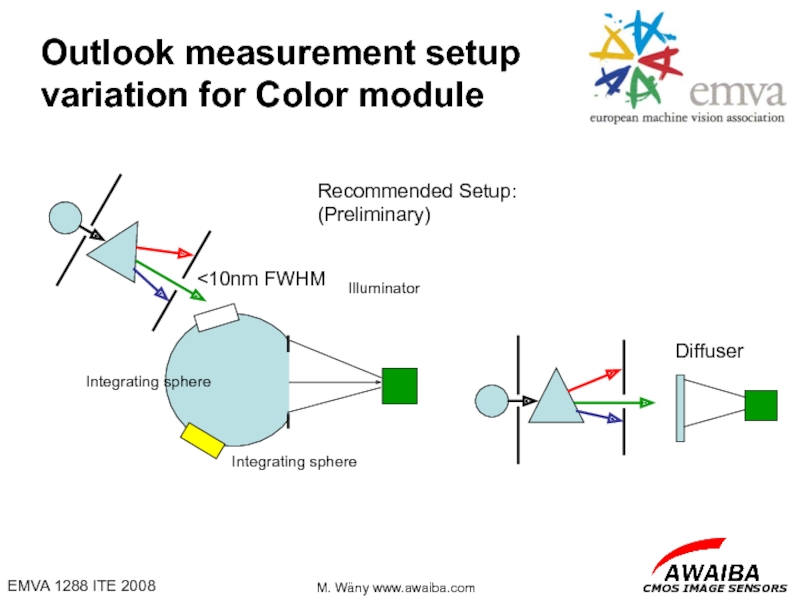
Слайд 8Outlook measurement setup variation for Color module
Integrating sphere
Illuminator
Integrating sphere
Recommended Setup:
(Preliminary)
Diffuser
Слайд 9
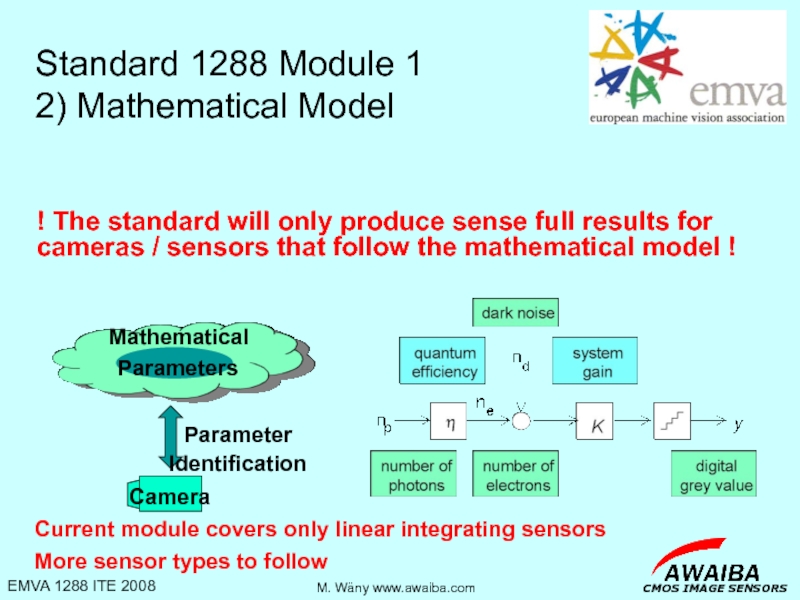
Camera
Mathematical Model
Parameters
Parameter
Identification
Standard 1288 Module 1
2) Mathematical Model
! The standard will only
Current module covers only linear integrating sensors
More sensor types to follow
Слайд 10Standard 1288 Module 1
3) Basic Information
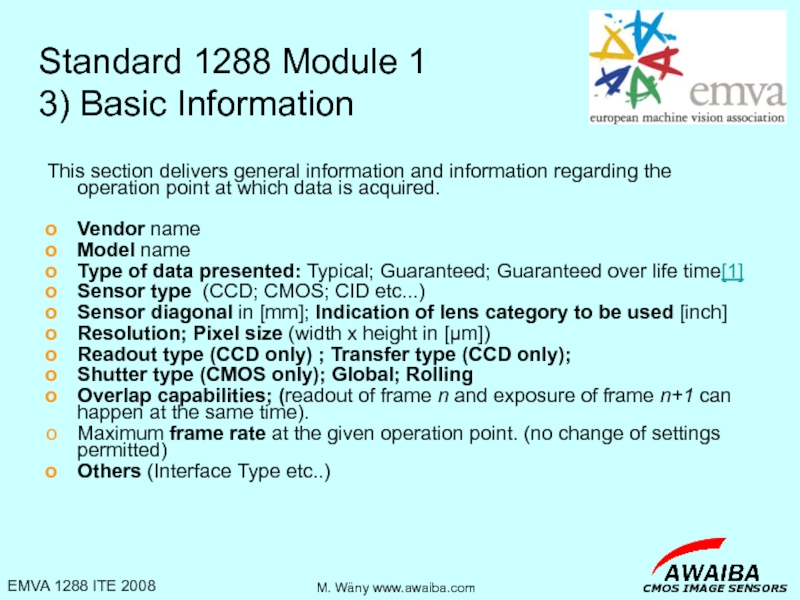
This section delivers general information and
Vendor name
Model name
Type of data presented: Typical; Guaranteed; Guaranteed over life time[1]
Sensor type (CCD; CMOS; CID etc...)
Sensor diagonal in [mm]; Indication of lens category to be used [inch]
Resolution; Pixel size (width x height in [µm])
Readout type (CCD only) ; Transfer type (CCD only);
Shutter type (CMOS only); Global; Rolling
Overlap capabilities; (readout of frame n and exposure of frame n+1 can happen at the same time).
Maximum frame rate at the given operation point. (no change of settings permitted)
Others (Interface Type etc..)
Слайд 12Standard 1288 Module 1
4) Operation Point
This section describes exactly in what
Unless for the scans of the integration time, the camera / sensor has to be in the same operation point for all EMVA1288 measurements.
Слайд 14Standard 1288 Module 1
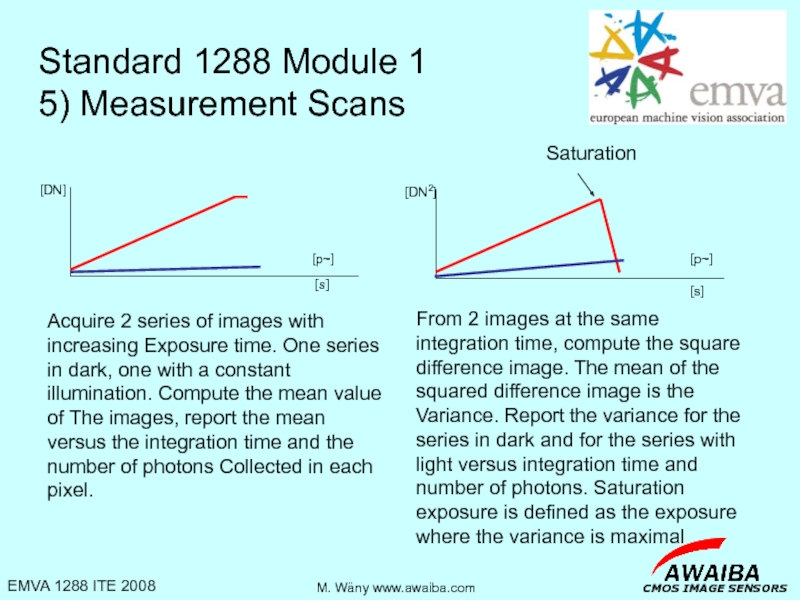
5) Measurement Scans
Acquire 2 series of images with
From 2 images at the same integration time, compute the square difference image. The mean of the squared difference image is the Variance. Report the variance for the series in dark and for the series with light versus integration time and number of photons. Saturation exposure is defined as the exposure where the variance is maximal
Слайд 16Standard 1288 Module 1
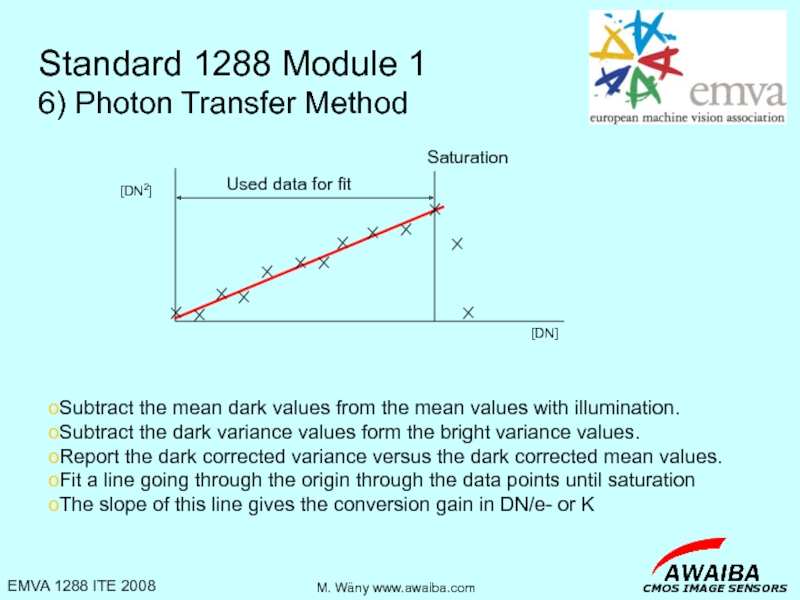
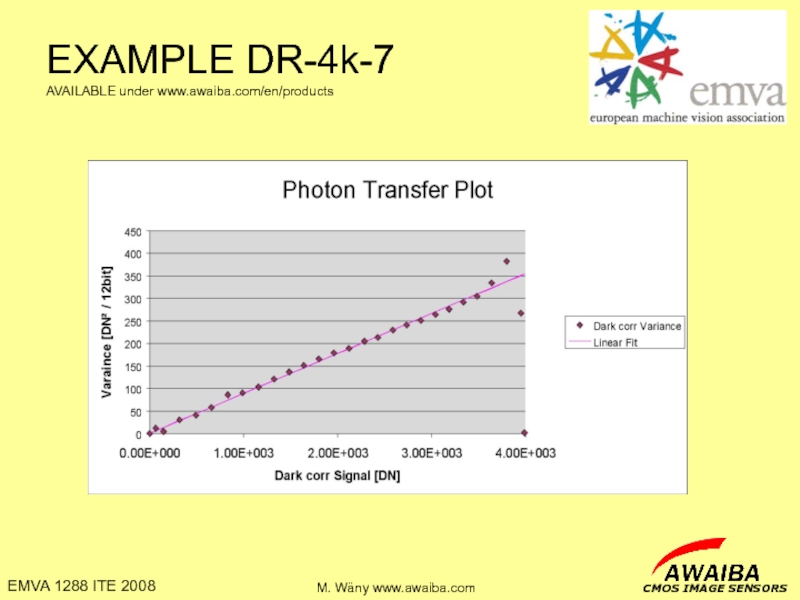
6) Photon Transfer Method
Subtract the mean dark values
Subtract the dark variance values form the bright variance values.
Report the dark corrected variance versus the dark corrected mean values.
Fit a line going through the origin through the data points until saturation
The slope of this line gives the conversion gain in DN/e- or K
Слайд 20Standard 1288 Module 1
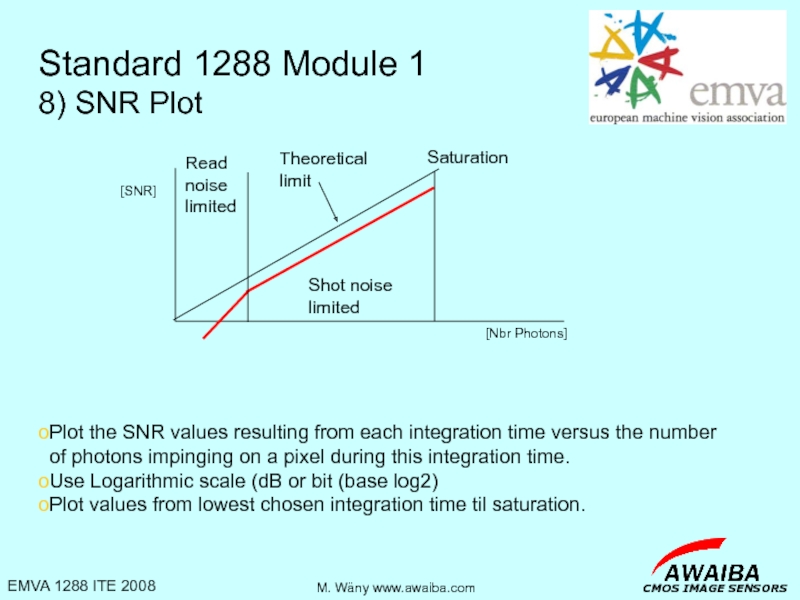
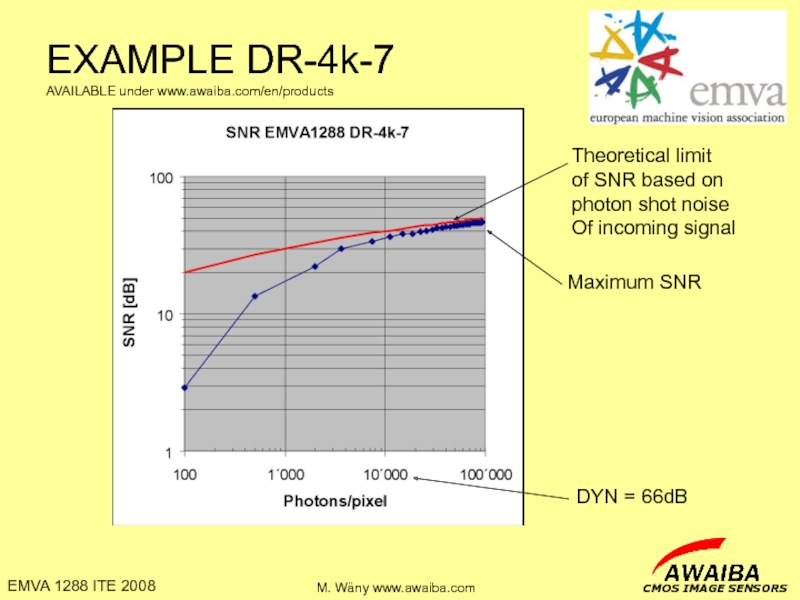
8) SNR Plot
Plot the SNR values resulting from
Use Logarithmic scale (dB or bit (base log2)
Plot values from lowest chosen integration time til saturation.
Слайд 21EXAMPLE DR-4k-7
AVAILABLE under www.awaiba.com/en/products
DYN = 66dB
Theoretical limit
of SNR based on
photon shot
Of incoming signal
Maximum SNR
Слайд 22Standard 1288 Module 1
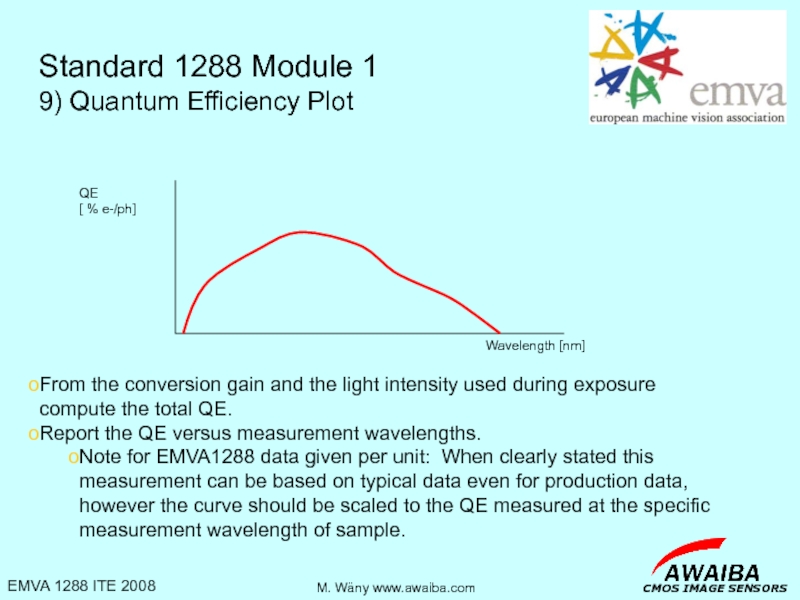
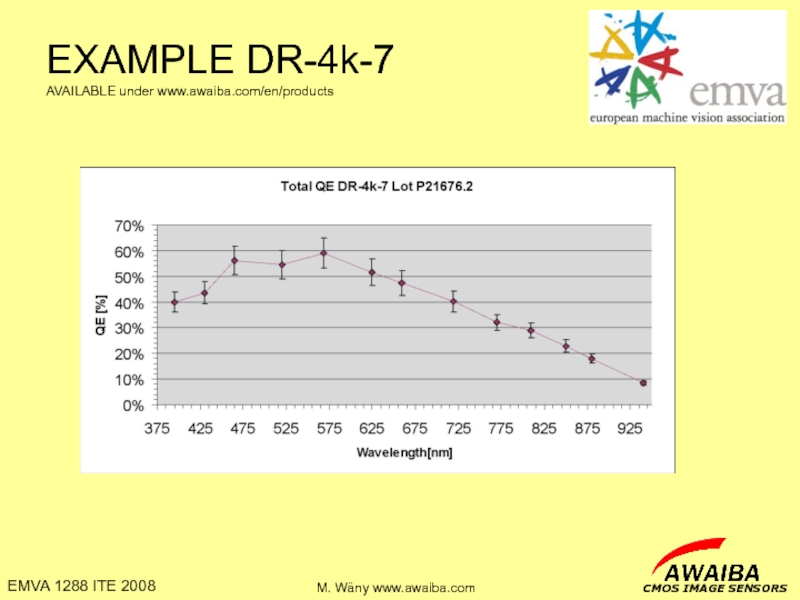
9) Quantum Efficiency Plot
From the conversion gain and
Report the QE versus measurement wavelengths.
Note for EMVA1288 data given per unit: When clearly stated this measurement can be based on typical data even for production data, however the curve should be scaled to the QE measured at the specific measurement wavelength of sample.
Слайд 24Standard 1288 Module 1
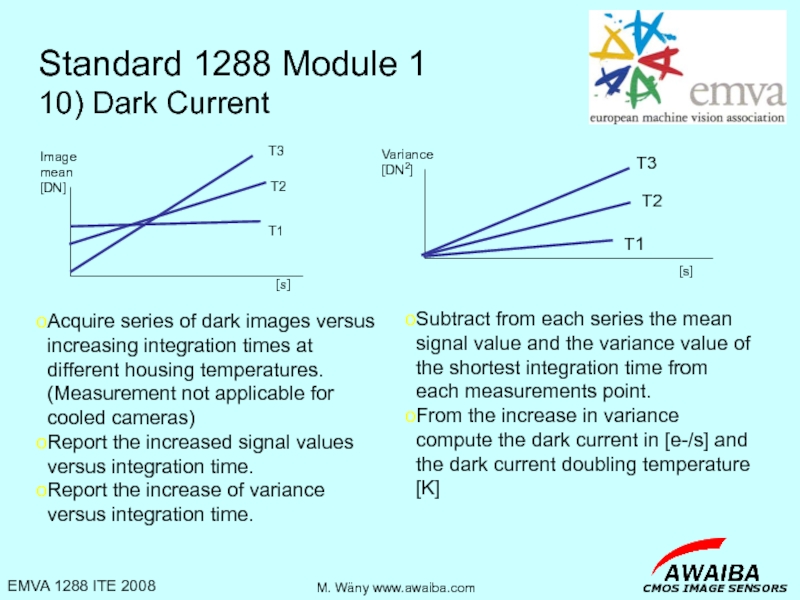
10) Dark Current
Acquire series of dark images versus
Report the increased signal values versus integration time.
Report the increase of variance versus integration time.
Subtract from each series the mean signal value and the variance value of the shortest integration time from each measurements point.
From the increase in variance compute the dark current in [e-/s] and the dark current doubling temperature [K]
Слайд 25EXAMPLE DR-4k-7
AVAILABLE under www.awaiba.com/en/products
Dark current doubling temperature 11.2K
Dark current at ambient
Слайд 26Standard 1288 Module 1
11) Spectrogram
From each row compute the DFFT
Average the
Plot the resulting spectrogram for Dark; 50% Saturation; 90% Saturation
Idea: describe DSNU & PRNU effects in from of a spectral amplitude plot to
Show high frequency (E.g. odd even mismatch) and low frequency
(E.g. over all gradients) parts of spatial and temporal noise separately
Слайд 30Optimize performance based on real values rather than visual impression! Raw sample
SPECIMEN
Слайд 31Thank you for your
attention
In God we trust, all other we
Current standard draft
www.emva.org www.emva.org or www.standard1288.org
Contact EMVA:
info@emva.org
Contact me:
waeny@awaiba.com
