- Главная
- Разное
- Дизайн
- Бизнес и предпринимательство
- Аналитика
- Образование
- Развлечения
- Красота и здоровье
- Финансы
- Государство
- Путешествия
- Спорт
- Недвижимость
- Армия
- Графика
- Культурология
- Еда и кулинария
- Лингвистика
- Английский язык
- Астрономия
- Алгебра
- Биология
- География
- Детские презентации
- Информатика
- История
- Литература
- Маркетинг
- Математика
- Медицина
- Менеджмент
- Музыка
- МХК
- Немецкий язык
- ОБЖ
- Обществознание
- Окружающий мир
- Педагогика
- Русский язык
- Технология
- Физика
- Философия
- Химия
- Шаблоны, картинки для презентаций
- Экология
- Экономика
- Юриспруденция
EBA Investment Attractiveness Index(5th wave) презентация
Содержание
- 1. EBA Investment Attractiveness Index(5th wave)
- 2. Project summary The results of 5th wave
- 3. Key findings
- 4. Key findings Investment Climate in Ukraine
- 5. Key findings (September, 3-7) (September, 8-21) (September,
- 6. EBA – Index: Components
- 7. Investment Climate in Ukraine Mean = 2,3
- 8. Investment Climate Dynamics: last 3 months
- 9. Investment Climate dynamics expectations: next 3
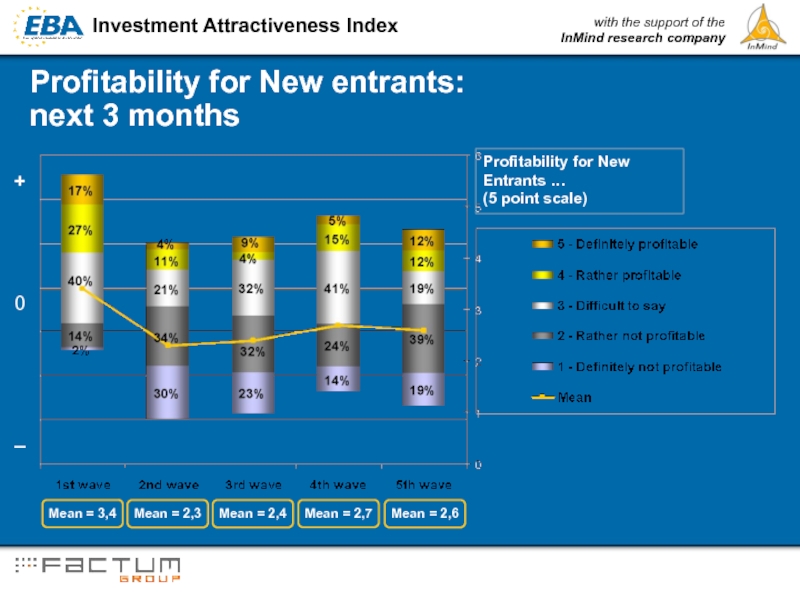
- 10. Profitability for New entrants: next 3
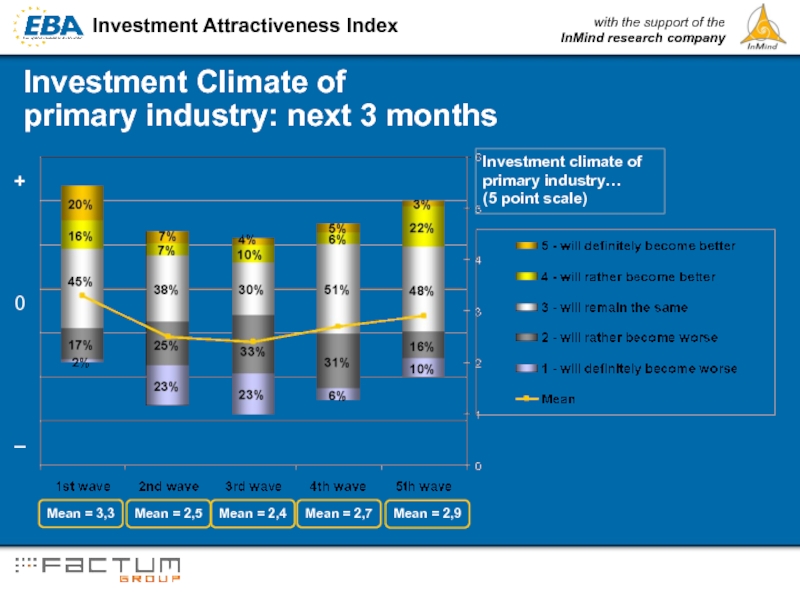
- 11. Investment Climate of primary industry: next
- 12. Key findings Five-grade scale is used
- 13. Key findings The current investment climate
- 14. Thank you!
Слайд 1EBA
Investment Attractiveness Index
(5th wave)
Conducted by EBA
with the support of InMind
Слайд 2Project summary
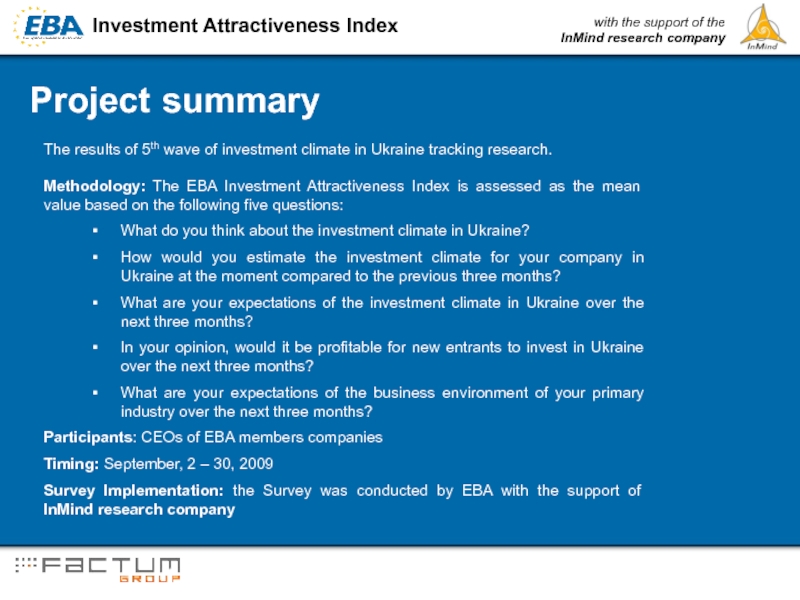
The results of 5th wave of investment climate in Ukraine
Methodology: The EBA Investment Attractiveness Index is assessed as the mean value based on the following five questions:
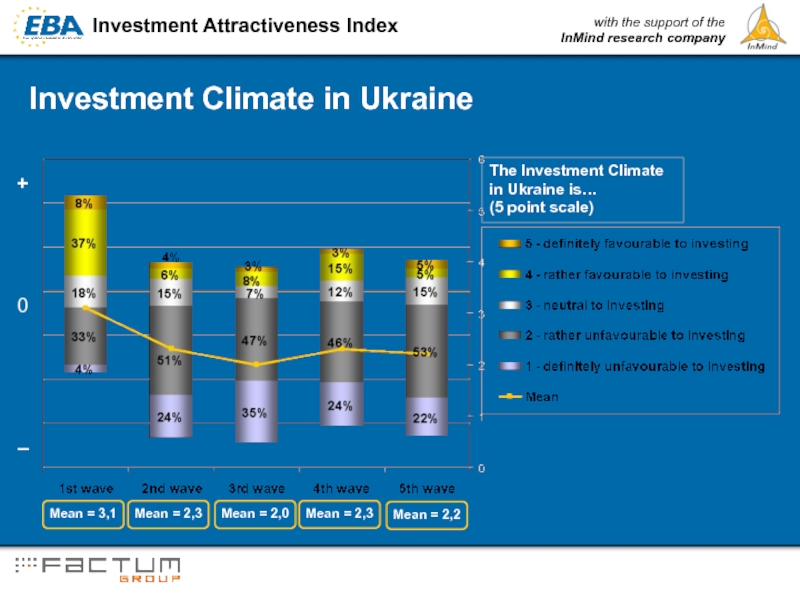
What do you think about the investment climate in Ukraine?
How would you estimate the investment climate for your company in Ukraine at the moment compared to the previous three months?
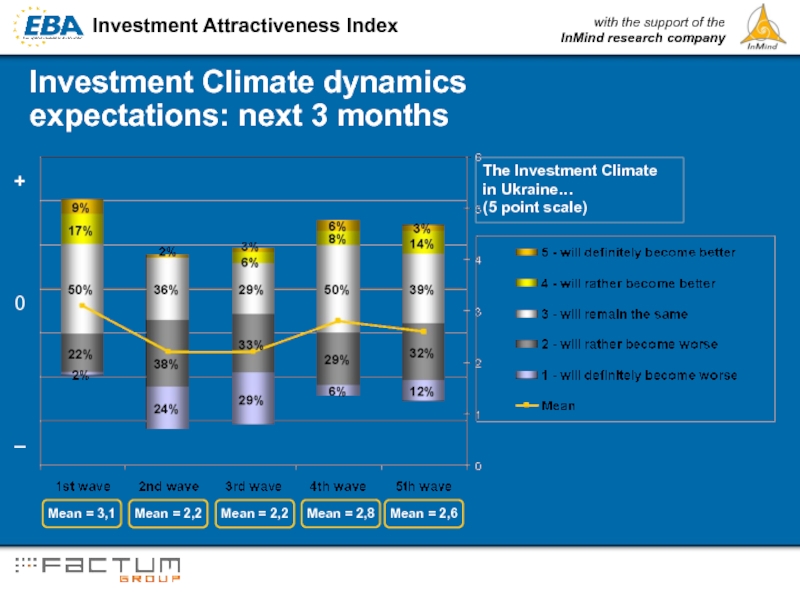
What are your expectations of the investment climate in Ukraine over the next three months?
In your opinion, would it be profitable for new entrants to invest in Ukraine over the next three months?
What are your expectations of the business environment of your primary industry over the next three months?
Participants: CEOs of EBA members companies
Timing: September, 2 – 30, 2009
Survey Implementation: the Survey was conducted by EBA with the support of InMind research company
Слайд 4Key findings
Investment Climate in
Ukraine
Investment Climate Dynamics: last 3 months
Investment Climate
Profitability for new entrants: next 3 months
2,3
2nd wave
1,8
2,2
2,3
General EBA Index
2,22
Investment Climate of Primary Industry: next 3 months
2,5
3,1
1st wave
2,8
3,1
3,4
3,3
General EBA Index
3,14
2,0
3rd wave
2,1
2,2
2,4
General EBA Index
2,22
2,4
2,3
4th wave
2,7
2,8
2,7
General EBA Index
2,64
2,7
2,2
5th wave
2,5
2,6
2,6
General EBA Index
2,56
2,9
Слайд 5Key findings
(September,
3-7)
(September,
8-21)
(September,
22-28)
(September,
29-October,2)
N=42
N=26
N=50
N=33
(October, 23-31)
N=53
(January, 19 – February, 12)
N=103
(April, 6 –
May,
N=78
(September,
2-30)
N=59
Слайд 7Investment Climate in Ukraine
Mean = 2,3
Mean = 3,1
The Investment Climate in
Mean = 2,0
0
–
+
Mean = 2,3
Mean = 2,2
Слайд 8Investment Climate Dynamics:
last 3 months
Mean = 1,8
Mean = 2,8
Mean =
0
–
+
The Investment Climate
in Ukraine…
(5 point scale)
Mean = 2,7
Mean = 2,5
Слайд 9Investment Climate dynamics
expectations: next 3 months
Mean = 2,2
Mean = 3,1
Mean
0
–
+
The Investment Climate
in Ukraine…
(5 point scale)
Mean = 2,8
Mean = 2,6
Слайд 10Profitability for New entrants:
next 3 months
Mean = 2,3
Mean = 3,4
Mean
0
–
+
Profitability for New Entrants …
(5 point scale)
Mean = 2,7
Mean = 2,6
Слайд 11Investment Climate of
primary industry: next 3 months
Mean = 2,5
Mean =
Mean = 2,4
0
–
+
Investment climate of primary industry…
(5 point scale)
Mean = 2,7
Mean = 2,9
Слайд 12Key findings
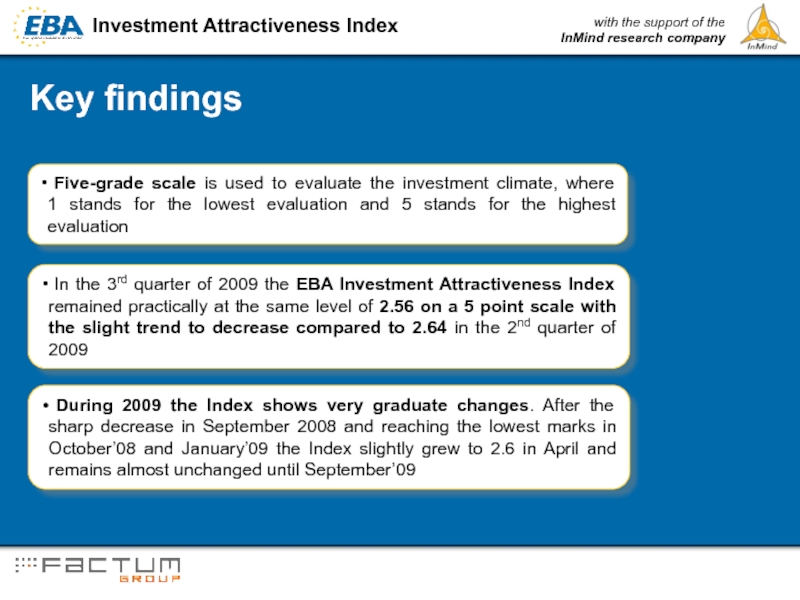
Five-grade scale is used to evaluate the investment climate,
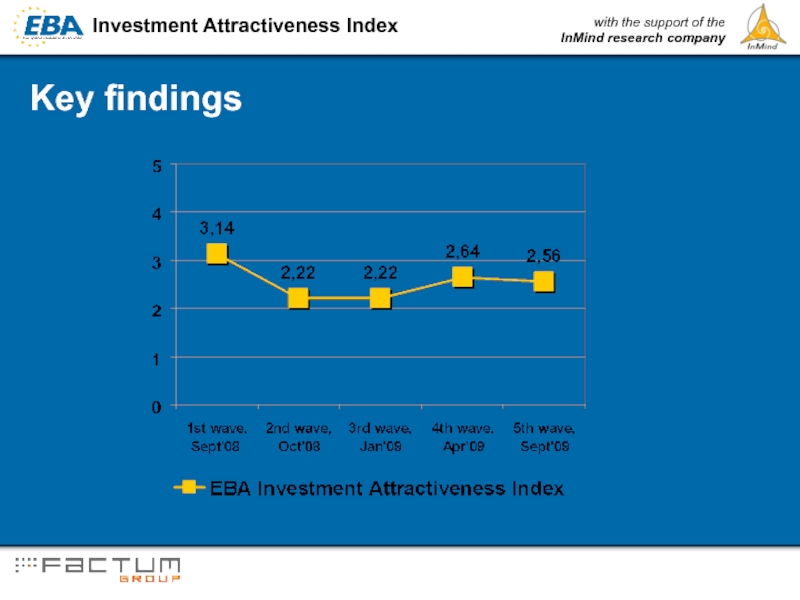
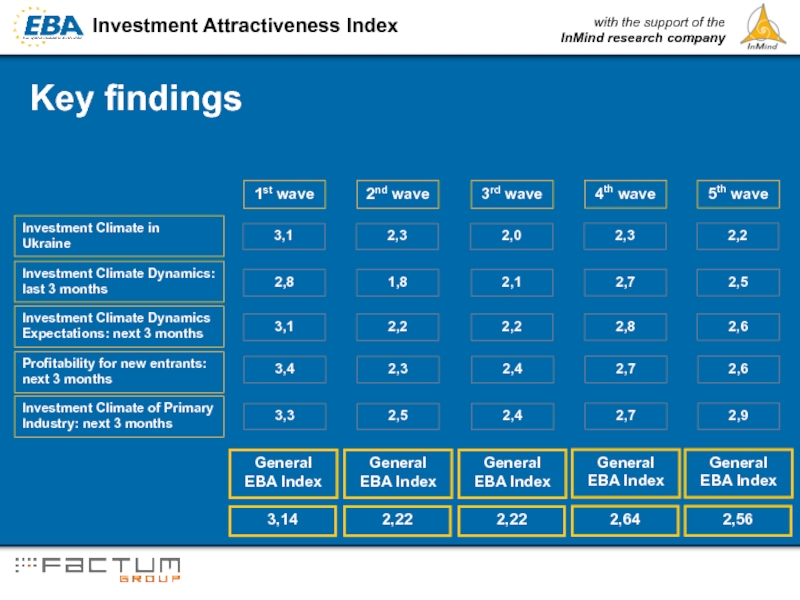
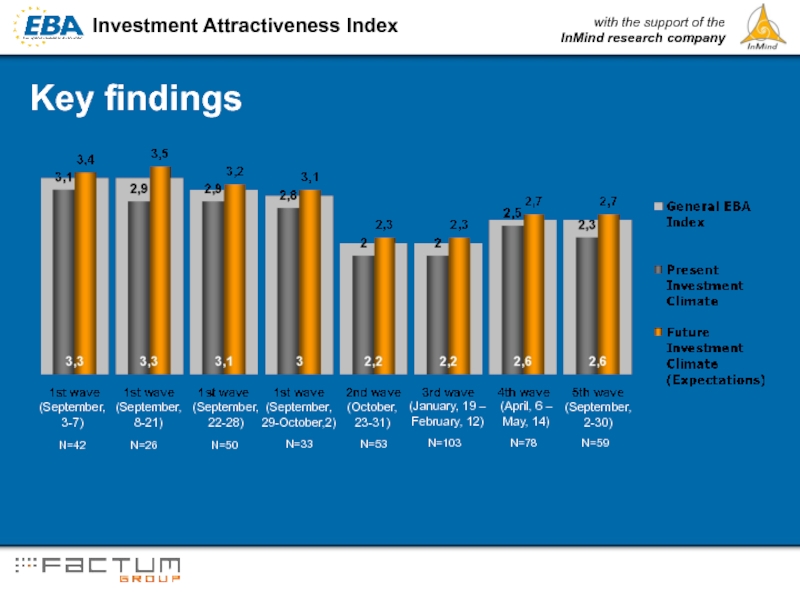
In the 3rd quarter of 2009 the EBA Investment Attractiveness Index remained practically at the same level of 2.56 on a 5 point scale with the slight trend to decrease compared to 2.64 in the 2nd quarter of 2009
During 2009 the Index shows very graduate changes. After the sharp decrease in September 2008 and reaching the lowest marks in October’08 and January’09 the Index slightly grew to 2.6 in April and remains almost unchanged until September’09
Слайд 13Key findings
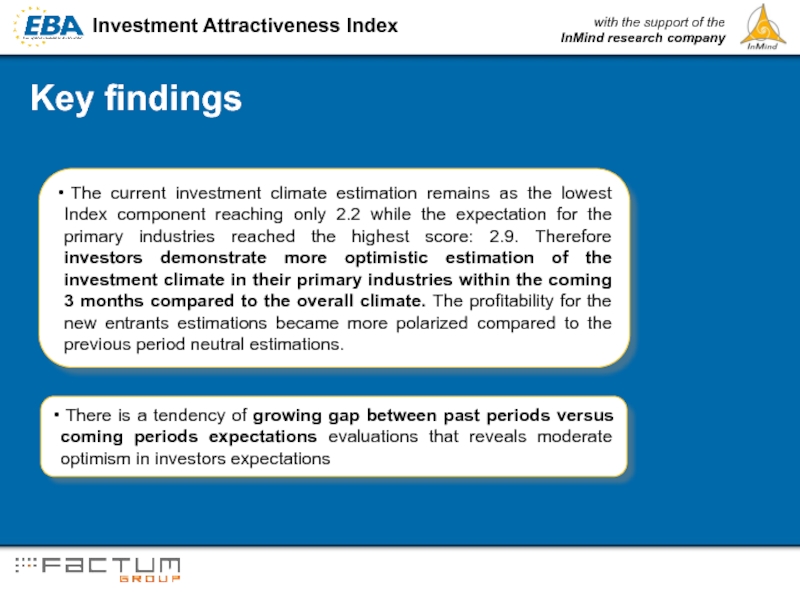
The current investment climate estimation remains as the lowest
There is a tendency of growing gap between past periods versus coming periods expectations evaluations that reveals moderate optimism in investors expectations
