- Главная
- Разное
- Дизайн
- Бизнес и предпринимательство
- Аналитика
- Образование
- Развлечения
- Красота и здоровье
- Финансы
- Государство
- Путешествия
- Спорт
- Недвижимость
- Армия
- Графика
- Культурология
- Еда и кулинария
- Лингвистика
- Английский язык
- Астрономия
- Алгебра
- Биология
- География
- Детские презентации
- Информатика
- История
- Литература
- Маркетинг
- Математика
- Медицина
- Менеджмент
- Музыка
- МХК
- Немецкий язык
- ОБЖ
- Обществознание
- Окружающий мир
- Педагогика
- Русский язык
- Технология
- Физика
- Философия
- Химия
- Шаблоны, картинки для презентаций
- Экология
- Экономика
- Юриспруденция
cup_russia_final_edition презентация
Содержание
- 1. cup_russia_final_edition
- 2. The new strategy is based on strengthening
- 3. Focus on high-marginal SKUs sales
- 4. 1. General message 1-2
- 5. Current marketing policy needs improvement in the
- 6. Danone’s priority social mission is caring about
- 8. Burobin Maxim Lobkovskaya Daria Voronova Olga Bobov Petr The Masters Team
- 9. Sources used: RBK Research, Rosstat, Forbes, Companies reports, Team’s analysis
- 10. Sources used: Case information, Team’s analysis.
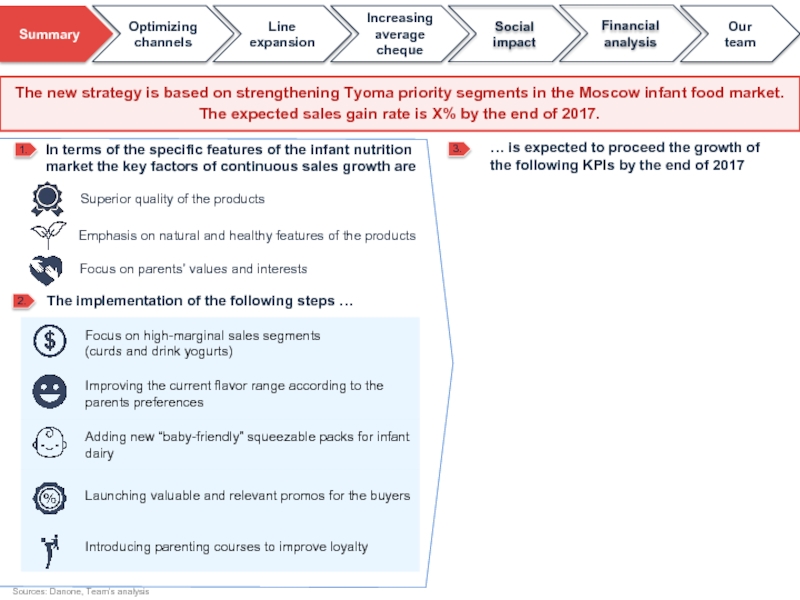
Слайд 2The new strategy is based on strengthening Tyoma priority segments in
In terms of the specific features of the infant nutrition market the key factors of continuous sales growth are
Sources: Danone, Team’s analysis
The implementation of the following steps …
… is expected to proceed the growth of the following KPIs by the end of 2017
Слайд 3
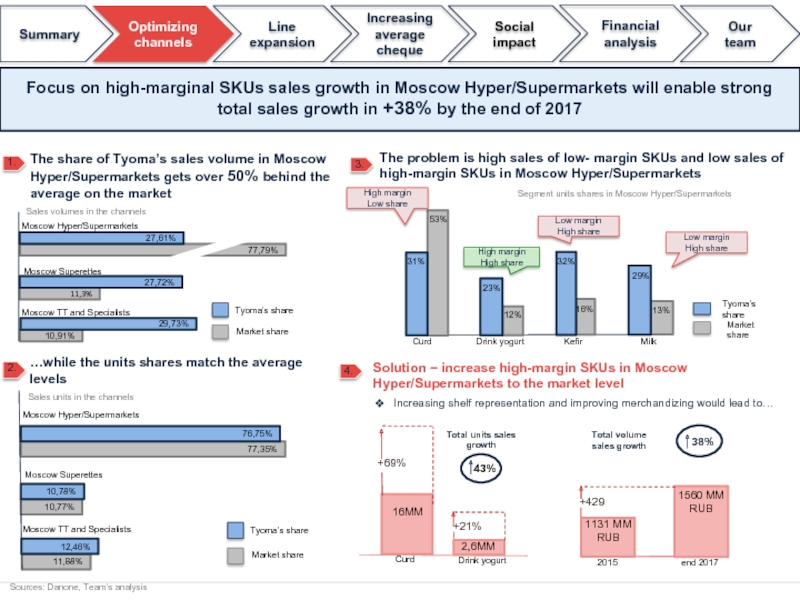
Focus on high-marginal SKUs sales growth in Moscow Hyper/Supermarkets will enable
Слайд 4
1.
General message 1-2 sentence (summary of the slide)
our предложение-> impact on
The new flavors should be X
Обоснование
результат
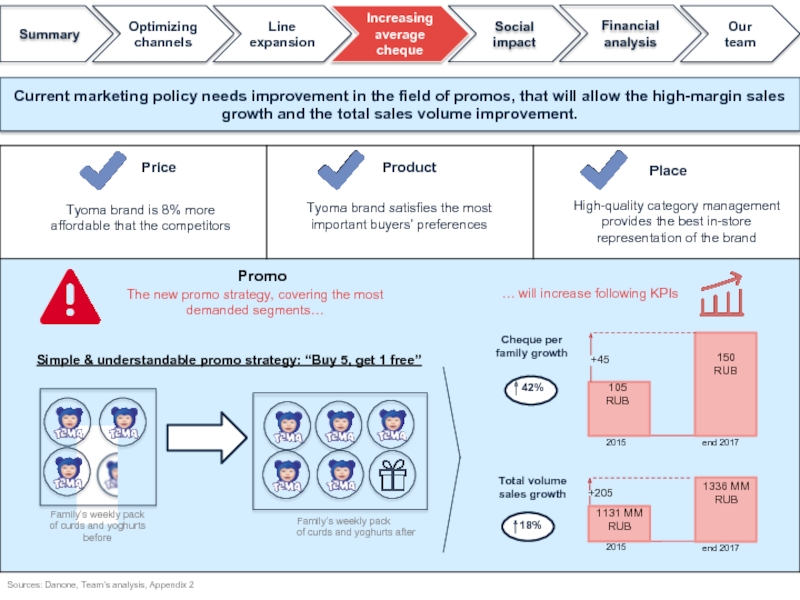
Слайд 5Current marketing policy needs improvement in the field of promos, that
Sources: Danone, Team’s analysis, Appendix 2
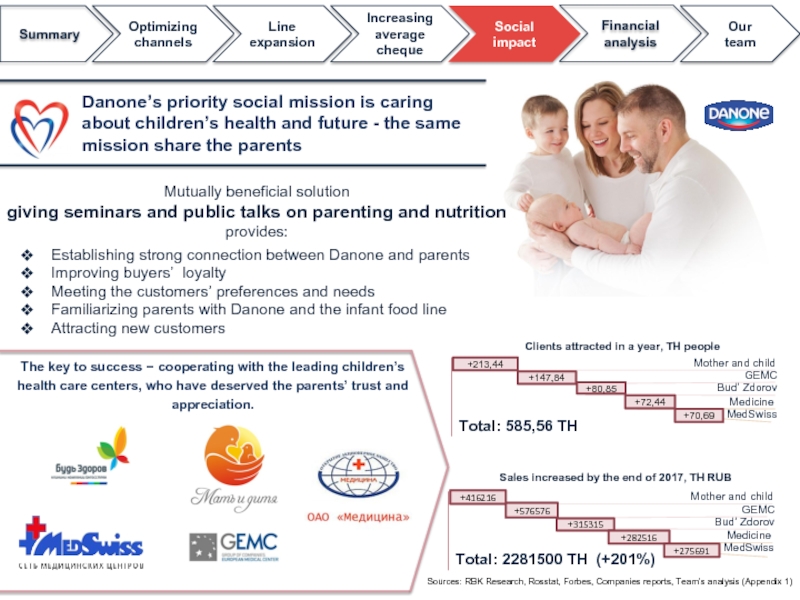
Слайд 6Danone’s priority social mission is caring about children’s health and future
The key to success − cooperating with the leading children’s health care centers, who have deserved the parents’ trust and appreciation.
Mutually beneficial solution
giving seminars and public talks on parenting and nutrition provides:
Establishing strong connection between Danone and parents
Improving buyers’ loyalty
Meeting the customers’ preferences and needs
Familiarizing parents with Danone and the infant food line
Attracting new customers
Sources: RBK Research, Rosstat, Forbes, Companies reports, Team’s analysis (Appendix 1)

