- Главная
- Разное
- Дизайн
- Бизнес и предпринимательство
- Аналитика
- Образование
- Развлечения
- Красота и здоровье
- Финансы
- Государство
- Путешествия
- Спорт
- Недвижимость
- Армия
- Графика
- Культурология
- Еда и кулинария
- Лингвистика
- Английский язык
- Астрономия
- Алгебра
- Биология
- География
- Детские презентации
- Информатика
- История
- Литература
- Маркетинг
- Математика
- Медицина
- Менеджмент
- Музыка
- МХК
- Немецкий язык
- ОБЖ
- Обществознание
- Окружающий мир
- Педагогика
- Русский язык
- Технология
- Физика
- Философия
- Химия
- Шаблоны, картинки для презентаций
- Экология
- Экономика
- Юриспруденция
Statistics. Identify the population and the sample in the following study презентация
Содержание
- 1. Statistics. Identify the population and the sample in the following study
- 2. A study of 254 patients with sleep
- 3. A parameter is a numerical measure that describes a sample characteristic. True False
- 4. In a survey of a sample of
- 5. In a union’s vote, 67% of all
- 6. A database of student identification numbers. This
- 7. The test scores in a statistics class.
- 8. Ordinal data represent the highest level of measurement. True False
- 9. A list of the uniform numbers retired
- 10. The number of products sold by a
- 11. The high temperatures in Philadelphia for each
- 12. Fastest Responders (in seconds)
- 13. Which data collection would you use to
- 14. Which data collection would you use to
- 15. Which sampling technique was used if a
- 16. Which sampling technique was used if for
- 17. Which sampling technique was used if a
- 18. Which sampling technique could lead to a
- 19. STUDY FOR YOUR CHAPTER 1 TEST TOMORROW!
Слайд 2A study of 254 patients with sleep disorders was conducted to
Identify the population and the sample in the following study.
Слайд 4In a survey of a sample of parents, 53% said they
Parameter
Statistic
Слайд 5In a union’s vote, 67% of all union members voted to
Parameter
Statistic
Слайд 6A database of student identification numbers. This data is an example
Qualitative data
Quantitative data
Слайд 7The test scores in a statistics class. This data is an
Qualitative data
Quantitative data
Слайд 9A list of the uniform numbers retired by each major league
Nominal
Ordinal
Interval
Ratio
Слайд 10The number of products sold by a toy manufacturer each quarter
Nominal
Ordinal
Interval
Ratio
Слайд 11The high temperatures in Philadelphia for each day in the month
Nominal
Ordinal
Interval
Ratio
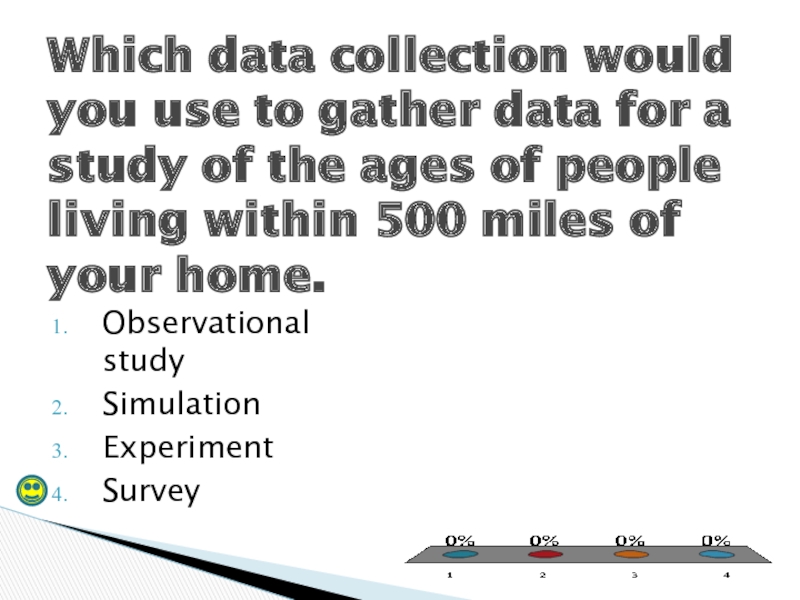
Слайд 13Which data collection would you use to gather data for a
Observational study
Simulation
Experiment
Survey
Слайд 14Which data collection would you use to gather data for a
Observational study
Simulation
Experiment
Survey
Слайд 15Which sampling technique was used if a journalist goes to a
Random
Stratified
Cluster
Systematic
Convenience
Слайд 16Which sampling technique was used if for quality assurance, every fifth
Random
Stratified
Cluster
Systematic
Convenience
Слайд 17Which sampling technique was used if a student body is divided
Random
Stratified
Cluster
Systematic
Convenience
Слайд 18Which sampling technique could lead to a biased study?
Random
Stratified
Cluster
Systematic
Convenience
Слайд 19STUDY FOR YOUR CHAPTER 1 TEST TOMORROW!
Items not covered in this
Descriptive vs Inferential Statistics
Biased questions or statements
YOU CAN DO IT!
Homework:

