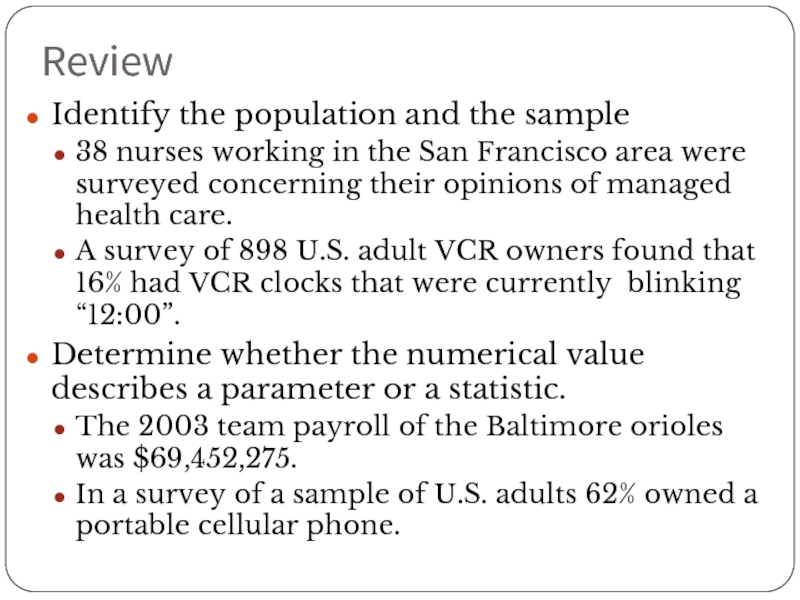
Francisco area were surveyed concerning their opinions of managed health care.
A survey of 898 U.S. adult VCR owners found that 16% had VCR clocks that were currently blinking “12:00”.
Determine whether the numerical value describes a parameter or a statistic.
The 2003 team payroll of the Baltimore orioles was $69,452,275.
In a survey of a sample of U.S. adults 62% owned a portable cellular phone.
- Главная
- Разное
- Дизайн
- Бизнес и предпринимательство
- Аналитика
- Образование
- Развлечения
- Красота и здоровье
- Финансы
- Государство
- Путешествия
- Спорт
- Недвижимость
- Армия
- Графика
- Культурология
- Еда и кулинария
- Лингвистика
- Английский язык
- Астрономия
- Алгебра
- Биология
- География
- Детские презентации
- Информатика
- История
- Литература
- Маркетинг
- Математика
- Медицина
- Менеджмент
- Музыка
- МХК
- Немецкий язык
- ОБЖ
- Обществознание
- Окружающий мир
- Педагогика
- Русский язык
- Технология
- Физика
- Философия
- Химия
- Шаблоны, картинки для презентаций
- Экология
- Экономика
- Юриспруденция
Review. Data Classification презентация
Содержание
- 1. Review. Data Classification
- 2. Unit 1-2 Data Classification
- 3. Types of Data When doing a study,
- 4. Example1 The base prices of several vehicles
- 5. Example 2 The population of several U.S.
- 6. Levels of Measurement Another characteristic of data
- 7. Inherent Zero An inherent zero is a
- 8. Nominal Level of Measurement This data set
- 9. Ordinal Level of Measurement This data set
- 10. Interval Level of Measurement This data set
- 11. Ratio Level of Measurement Using the home
- 12. Summarization
- 13. Practice Consider the following data sets. For
- 14. Practice Consider the following data sets. For
Слайд 3Types of Data
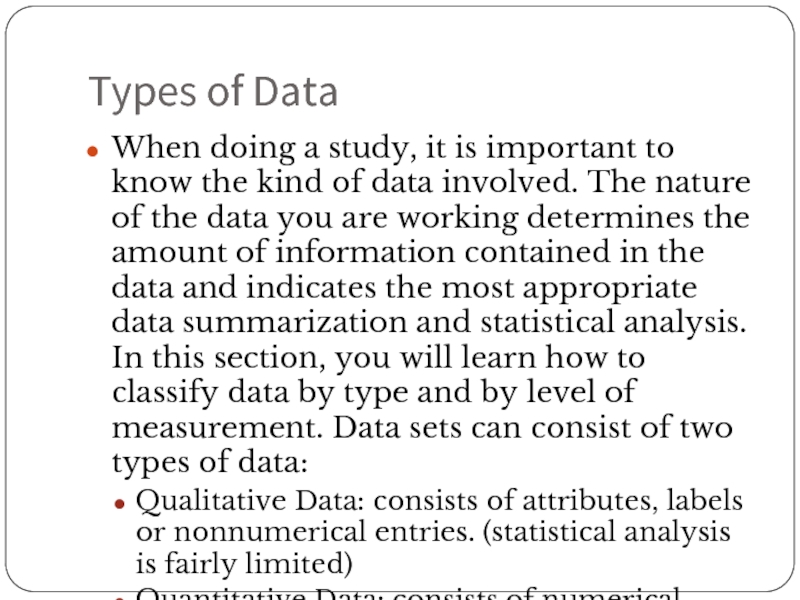
When doing a study, it is important to know
the kind of data involved. The nature of the data you are working determines the amount of information contained in the data and indicates the most appropriate data summarization and statistical analysis. In this section, you will learn how to classify data by type and by level of measurement. Data sets can consist of two types of data:
Qualitative Data: consists of attributes, labels or nonnumerical entries. (statistical analysis is fairly limited)
Quantitative Data: consists of numerical measurements or counts.
Qualitative Data: consists of attributes, labels or nonnumerical entries. (statistical analysis is fairly limited)
Quantitative Data: consists of numerical measurements or counts.
Слайд 4Example1
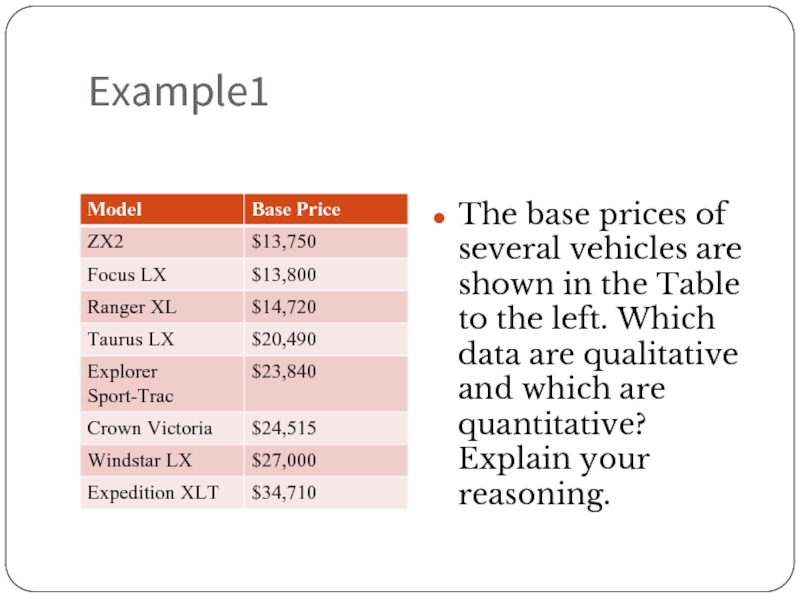
The base prices of several vehicles are shown in the Table
to the left. Which data are qualitative and which are quantitative? Explain your reasoning.
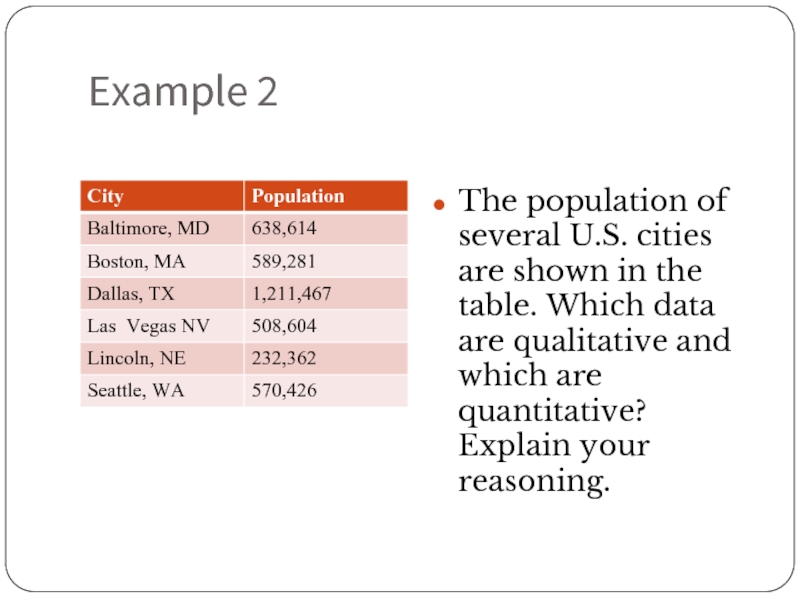
Слайд 5Example 2
The population of several U.S. cities are shown in the
table. Which data are qualitative and which are quantitative? Explain your reasoning.
Слайд 6Levels of Measurement
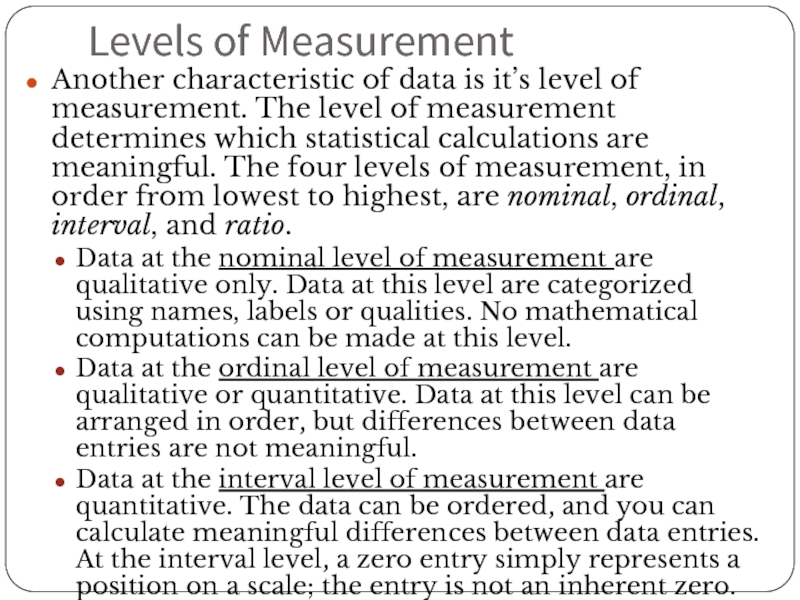
Another characteristic of data is it’s level of measurement.
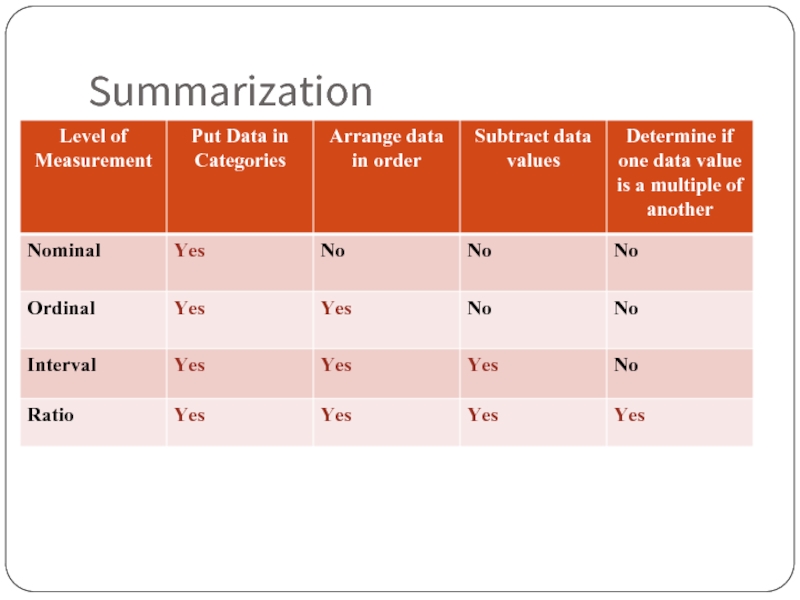
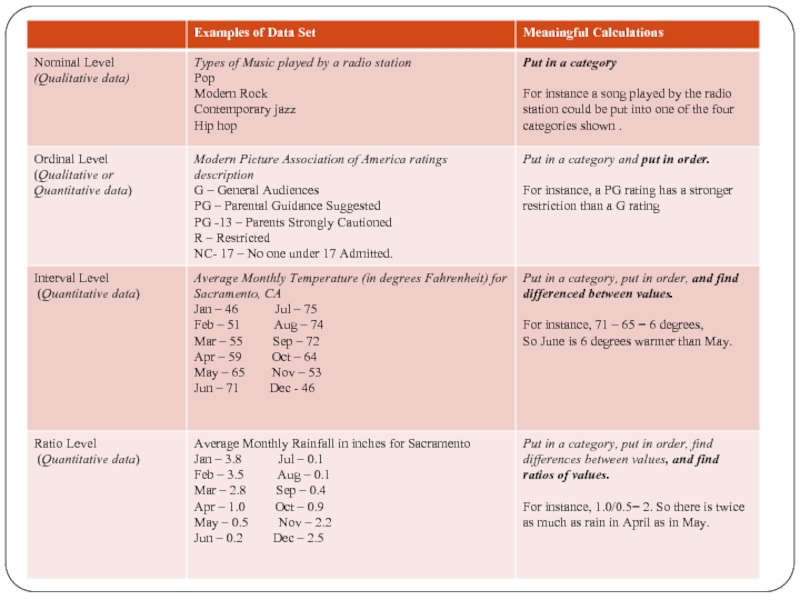
The level of measurement determines which statistical calculations are meaningful. The four levels of measurement, in order from lowest to highest, are nominal, ordinal, interval, and ratio.
Data at the nominal level of measurement are qualitative only. Data at this level are categorized using names, labels or qualities. No mathematical computations can be made at this level.
Data at the ordinal level of measurement are qualitative or quantitative. Data at this level can be arranged in order, but differences between data entries are not meaningful.
Data at the interval level of measurement are quantitative. The data can be ordered, and you can calculate meaningful differences between data entries. At the interval level, a zero entry simply represents a position on a scale; the entry is not an inherent zero. (implies “none”)
Data at the ratio level of measurement are similar to data at the interval level, with the added property that a zero entry is an inherent zero. A ratio of two data values can be formed so one data value can be expressed as a multiple of another.
Слайд 7Inherent Zero
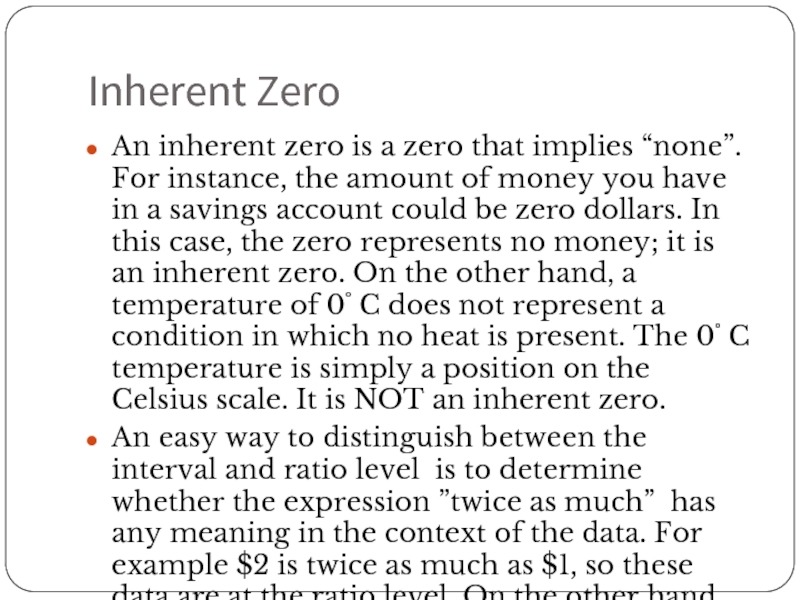
An inherent zero is a zero that implies “none”. For
instance, the amount of money you have in a savings account could be zero dollars. In this case, the zero represents no money; it is an inherent zero. On the other hand, a temperature of 0˚ C does not represent a condition in which no heat is present. The 0˚ C temperature is simply a position on the Celsius scale. It is NOT an inherent zero.
An easy way to distinguish between the interval and ratio level is to determine whether the expression ”twice as much” has any meaning in the context of the data. For example $2 is twice as much as $1, so these data are at the ratio level. On the other hand, 2˚ C is not twice as warm as 1˚ C, so these data are at the interval level.
An easy way to distinguish between the interval and ratio level is to determine whether the expression ”twice as much” has any meaning in the context of the data. For example $2 is twice as much as $1, so these data are at the ratio level. On the other hand, 2˚ C is not twice as warm as 1˚ C, so these data are at the interval level.
Слайд 8Nominal Level of Measurement
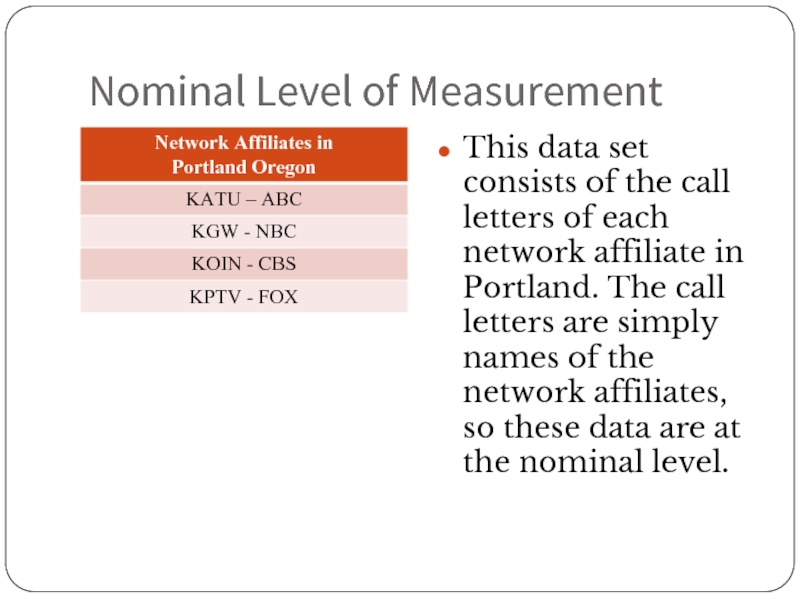
This data set consists of the call letters
of each network affiliate in Portland. The call letters are simply names of the network affiliates, so these data are at the nominal level.
Слайд 9Ordinal Level of Measurement
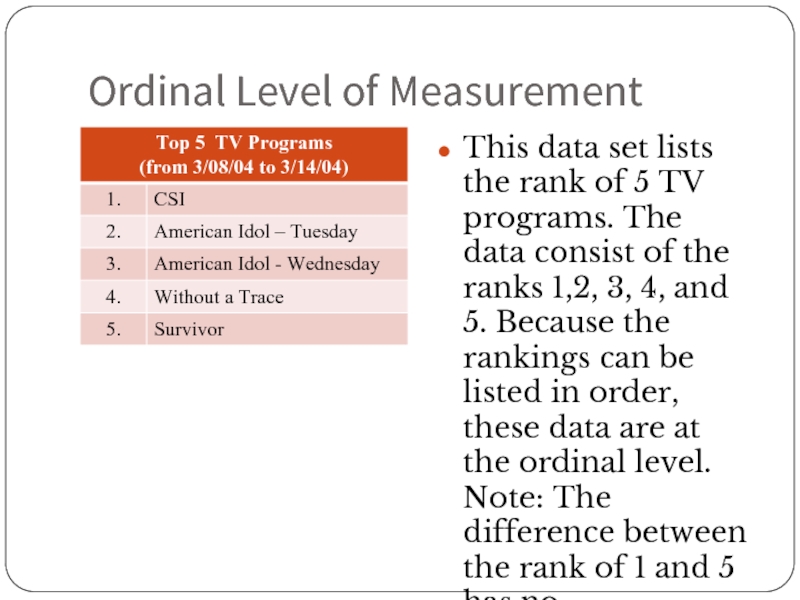
This data set lists the rank of 5
TV programs. The data consist of the ranks 1,2, 3, 4, and 5. Because the rankings can be listed in order, these data are at the ordinal level. Note: The difference between the rank of 1 and 5 has no mathematical meaning.
Слайд 10Interval Level of Measurement
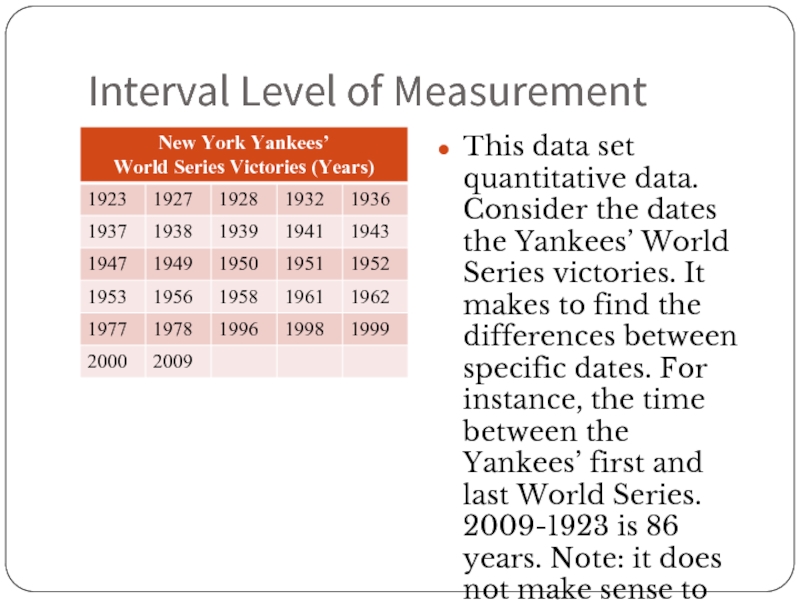
This data set quantitative data. Consider the dates
the Yankees’ World Series victories. It makes to find the differences between specific dates. For instance, the time between the Yankees’ first and last World Series. 2009-1923 is 86 years. Note: it does not make sense to write a ratio using these dates. So, these data are at the interval level.
Слайд 11Ratio Level of Measurement
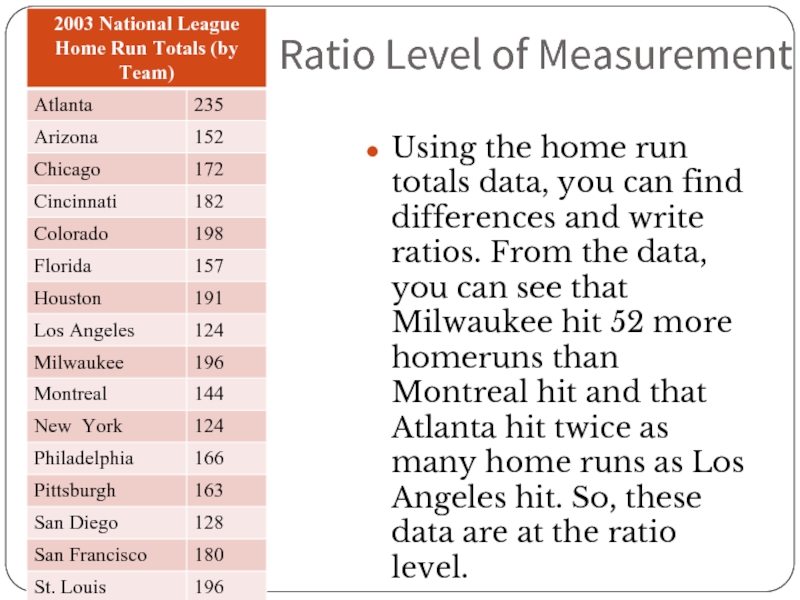
Using the home run totals data, you can
find differences and write ratios. From the data, you can see that Milwaukee hit 52 more homeruns than Montreal hit and that Atlanta hit twice as many home runs as Los Angeles hit. So, these data are at the ratio level.
Слайд 13Practice
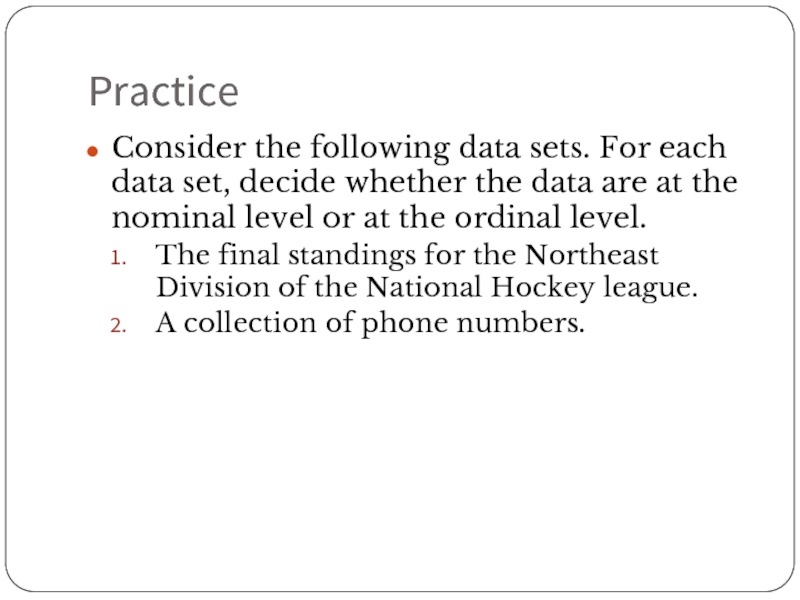
Consider the following data sets. For each data set, decide whether
the data are at the nominal level or at the ordinal level.
The final standings for the Northeast Division of the National Hockey league.
A collection of phone numbers.
The final standings for the Northeast Division of the National Hockey league.
A collection of phone numbers.
Слайд 14Practice
Consider the following data sets. For each data set, decide whether
the data are at the interval level or at the ratio level.
The body temperature (in degree’s Fahrenheit) of an athlete during an exercise session.
The heart rates ( in beats per minute) of an athlete during an exercise session.
The body temperature (in degree’s Fahrenheit) of an athlete during an exercise session.
The heart rates ( in beats per minute) of an athlete during an exercise session.
