Study,
How to collect data by taking a census using a sampling, using a simulation ,or perform an experiment.
How to create a sample using random sampling, simple random sampling, stratified sampling, cluster sampling , systematic sampling, and how to identify a biased sample.
- Главная
- Разное
- Дизайн
- Бизнес и предпринимательство
- Аналитика
- Образование
- Развлечения
- Красота и здоровье
- Финансы
- Государство
- Путешествия
- Спорт
- Недвижимость
- Армия
- Графика
- Культурология
- Еда и кулинария
- Лингвистика
- Английский язык
- Астрономия
- Алгебра
- Биология
- География
- Детские презентации
- Информатика
- История
- Литература
- Маркетинг
- Математика
- Медицина
- Менеджмент
- Музыка
- МХК
- Немецкий язык
- ОБЖ
- Обществознание
- Окружающий мир
- Педагогика
- Русский язык
- Технология
- Физика
- Философия
- Химия
- Шаблоны, картинки для презентаций
- Экология
- Экономика
- Юриспруденция
Experimental design. (Section 1.3) презентация
Содержание
- 1. Experimental design. (Section 1.3)
- 2. Experimental Design The goal of every statistical
- 3. Guidelines Designing a statistical study 1.
- 4. Data Collection The following is a brief
- 5. Example Deciding Upon Methods of data collection
- 6. Solutions Because it is impractical to create
- 7. Sampling Techniques A random sample – is
- 8. Example Use the TI-83 to generate a
- 9. Stratified Sample Stratified Sample- When it is
- 10. Example of a Stratified Sample To collect
- 11. When the population falls into naturally occurring
- 12. Identifying Sampling techniques You are
- 13. Try It Yourself 3 You
- 14. Homework 1-4, 5,7,9-17(odd) ,19,21-22,23 Pgs. 20-21 Technology 1-8 all pgs. 22-23
Слайд 2Experimental Design
The goal of every statistical study is to collect data
and then use the data to make a decision. Any decision you make using the results of a statistical study is only as good as the process used to obtain the data. If the process is flawed then the resulting decision is questionable.
While you may never have to develop a statistical study it is likely you will have to interpret the results of one. And before you interpret the results of a study you should determine whether or not the results are valid. In other words you should be familiar with how to design a statistical study.
While you may never have to develop a statistical study it is likely you will have to interpret the results of one. And before you interpret the results of a study you should determine whether or not the results are valid. In other words you should be familiar with how to design a statistical study.
Слайд 3Guidelines
Designing a statistical study
1. Identify the variables of interest, the
focus, and the population of the study.
2. Develop a detailed plan for collecting data. If you use a sample make sure the sample is representative of the population.
3. Collect the data.
4. Describe the data using descriptive statistics techniques.
5. Interpret the data and make decisions about the population using inferential statistics.
6. Identify any possible errors.
Слайд 4Data Collection
The following is a brief summary of four methods of
data collection.
Take a census; a census is a measure of an entire population. A census provides complete information. It is often costly and difficult to perform.
Use Sampling; A sampling is a count or measure of part of a population. Using sampling is often more practical than taking a census.
Use a Simulation; A simulation is the use of mathematical or physical model to reproduce the conditions of a situation or process. Simulations allow you to study situations that are impractical or dangerous to create in real life, and often saves time and money. For example auto crashes.
Perform an experiment; An experiment is applied to a part of the population and responses are observed. A second part of the population Is used as a control group.
Слайд 5Example
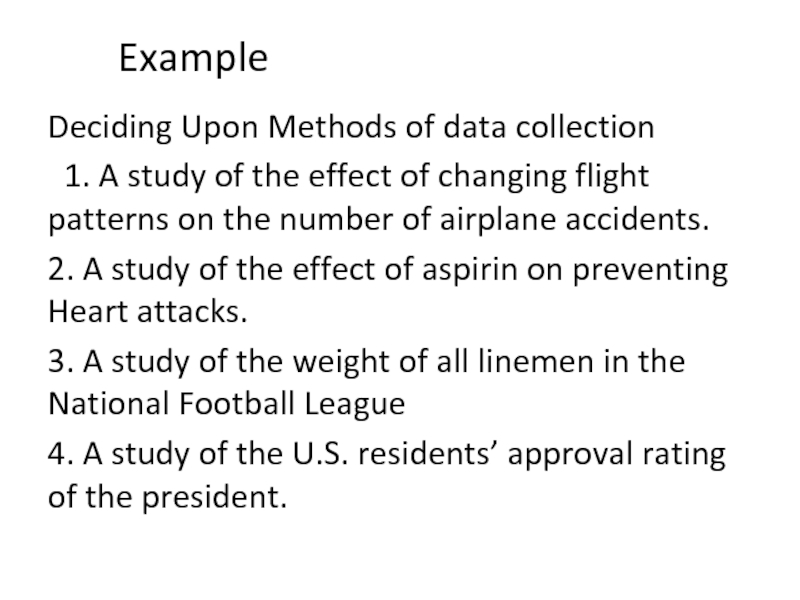
Deciding Upon Methods of data collection
1. A study of the
effect of changing flight patterns on the number of airplane accidents.
2. A study of the effect of aspirin on preventing Heart attacks.
3. A study of the weight of all linemen in the National Football League
4. A study of the U.S. residents’ approval rating of the president.
2. A study of the effect of aspirin on preventing Heart attacks.
3. A study of the weight of all linemen in the National Football League
4. A study of the U.S. residents’ approval rating of the president.
Слайд 6Solutions
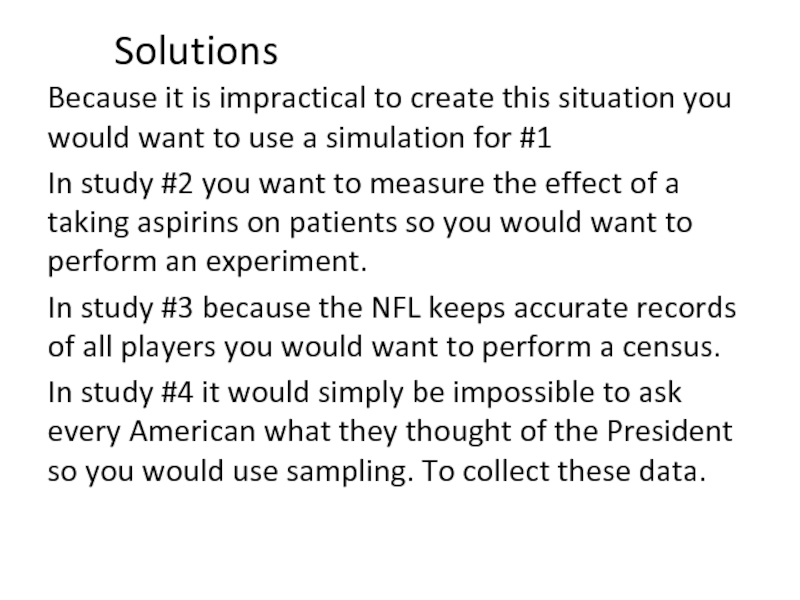
Because it is impractical to create this situation you would want
to use a simulation for #1
In study #2 you want to measure the effect of a taking aspirins on patients so you would want to perform an experiment.
In study #3 because the NFL keeps accurate records of all players you would want to perform a census.
In study #4 it would simply be impossible to ask every American what they thought of the President so you would use sampling. To collect these data.
Слайд 7Sampling Techniques
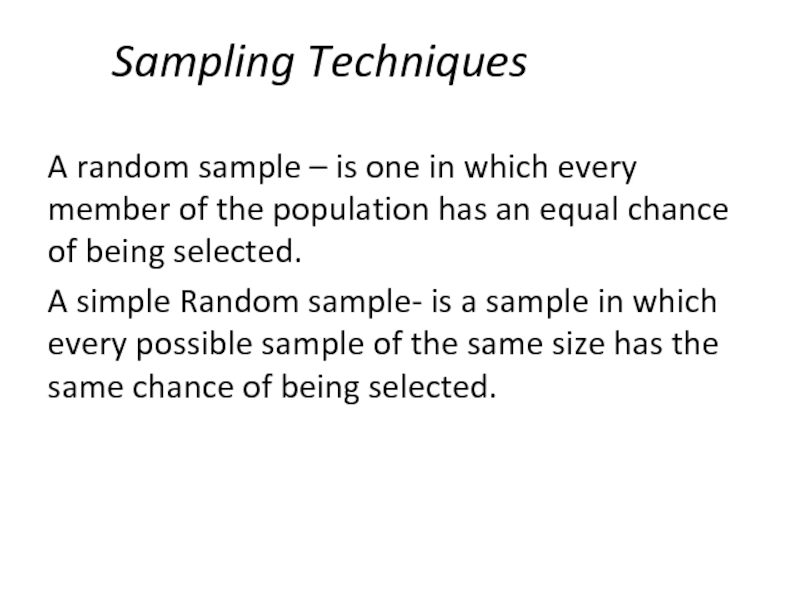
A random sample – is one in which every member
of the population has an equal chance of being selected.
A simple Random sample- is a sample in which every possible sample of the same size has the same chance of being selected.
A simple Random sample- is a sample in which every possible sample of the same size has the same chance of being selected.
Слайд 8Example
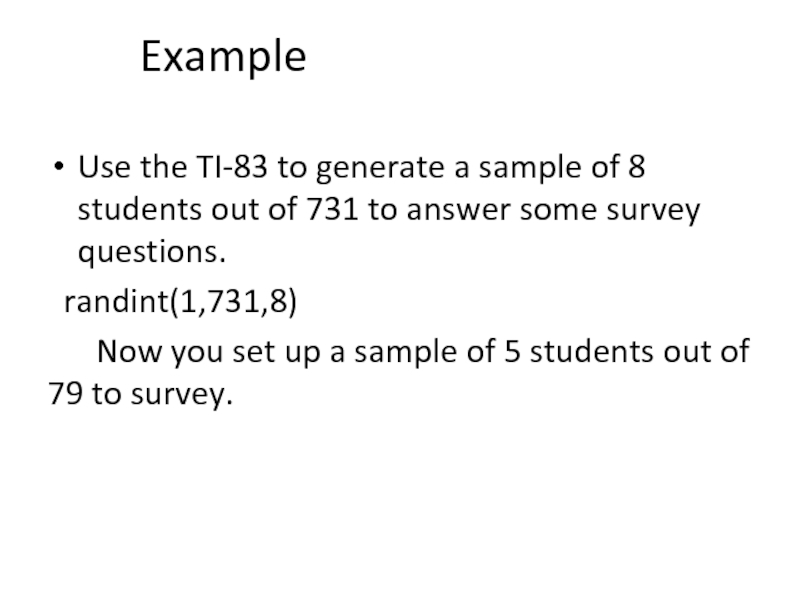
Use the TI-83 to generate a sample of 8 students out
of 731 to answer some survey questions.
randint(1,731,8)
Now you set up a sample of 5 students out of 79 to survey.
randint(1,731,8)
Now you set up a sample of 5 students out of 79 to survey.
Слайд 9Stratified Sample
Stratified Sample- When it is important to have members from
each segment of the population, you should use a stratified sample. Depending on the focus of the study, members are divided into two or more different subsets called strata that share a similar characteristic such as age, gender, ethnicity or even political preference. A sample is randomly selected from each of the strata
Слайд 10Example of a Stratified Sample
To collect a stratified sample from the
number of people who live in Dade county
You might want to divide the sample into economic sub groups. And then randomly select members from each subgroup.
Low Income group
Middle income group
High Income group
You might want to divide the sample into economic sub groups. And then randomly select members from each subgroup.
Low Income group
Middle income group
High Income group
Слайд 11When the population falls into naturally occurring subgroups each having similar
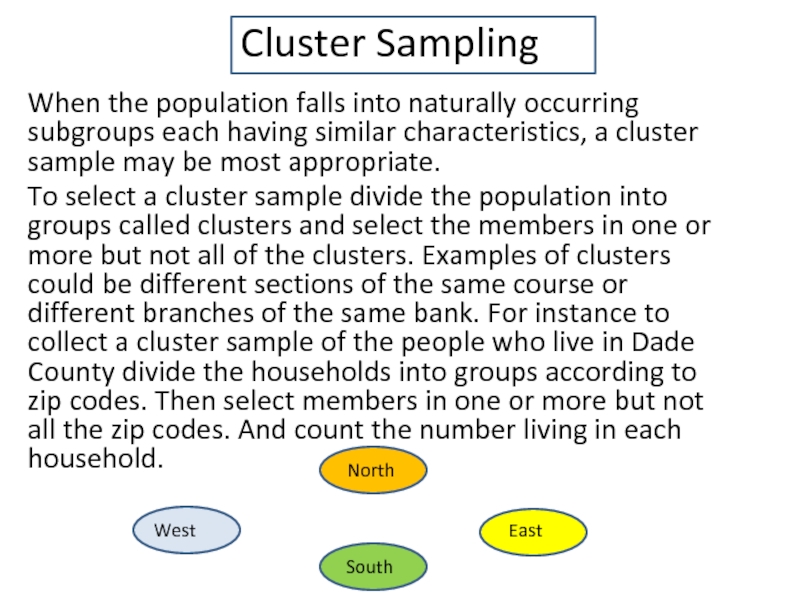
characteristics, a cluster sample may be most appropriate.
To select a cluster sample divide the population into groups called clusters and select the members in one or more but not all of the clusters. Examples of clusters could be different sections of the same course or different branches of the same bank. For instance to collect a cluster sample of the people who live in Dade County divide the households into groups according to zip codes. Then select members in one or more but not all the zip codes. And count the number living in each household.
To select a cluster sample divide the population into groups called clusters and select the members in one or more but not all of the clusters. Examples of clusters could be different sections of the same course or different branches of the same bank. For instance to collect a cluster sample of the people who live in Dade County divide the households into groups according to zip codes. Then select members in one or more but not all the zip codes. And count the number living in each household.
Cluster Sampling
North
East
West
South
Слайд 12
Identifying Sampling techniques
You are doing a study to determine the
opinio9n of students at your school regarding gun control. Identify the sampling technique you are using if you select the samples listed.
You select a class at random and question each student in the class.
2. You divide the student population with respect to majors and randomly question some students in each major.
3. Each sample has an equal chance of being selected and each student has an equal chance of being selected, so this is a simple random sample.
EXAMPLE
Слайд 13Try It Yourself 3
You want to determine the opinion
of students at your school regarding gun control. Identify the sampling technique you are using if you select the samples listed.
You select students who are in your statistics class.
You assign each student a number. And after choosing a starting number, questioning every 25th student.
a. Determine how the sample is selected.
b. Identify the corresponding sampling technique.
You select students who are in your statistics class.
You assign each student a number. And after choosing a starting number, questioning every 25th student.
a. Determine how the sample is selected.
b. Identify the corresponding sampling technique.
