- Главная
- Разное
- Дизайн
- Бизнес и предпринимательство
- Аналитика
- Образование
- Развлечения
- Красота и здоровье
- Финансы
- Государство
- Путешествия
- Спорт
- Недвижимость
- Армия
- Графика
- Культурология
- Еда и кулинария
- Лингвистика
- Английский язык
- Астрономия
- Алгебра
- Биология
- География
- Детские презентации
- Информатика
- История
- Литература
- Маркетинг
- Математика
- Медицина
- Менеджмент
- Музыка
- МХК
- Немецкий язык
- ОБЖ
- Обществознание
- Окружающий мир
- Педагогика
- Русский язык
- Технология
- Физика
- Философия
- Химия
- Шаблоны, картинки для презентаций
- Экология
- Экономика
- Юриспруденция
Data classification. (Chapter 1.2) презентация
Содержание
- 1. Data classification. (Chapter 1.2)
- 2. Types of Data Qualitative data consist of
- 3. Ex 1: The base prices of several
- 4. Levels of Measurement Nominal Level of measurement
- 5. Ex 2: Two data sets are shown.
- 6. Answer: The first data set lists the
- 7. Ex 2a: Consider the following data sets.
- 8. Ex 2b: At the beginning of 2007,
- 9. Levels of Measurement (con’t) Data at the
- 10. Inherent Zero example: An inherent zero
- 11. Ex: 3 Two data sets are shown
- 12. Answer: Both of these data sets contain
- 13. Ex 3a: Decide whether the data are
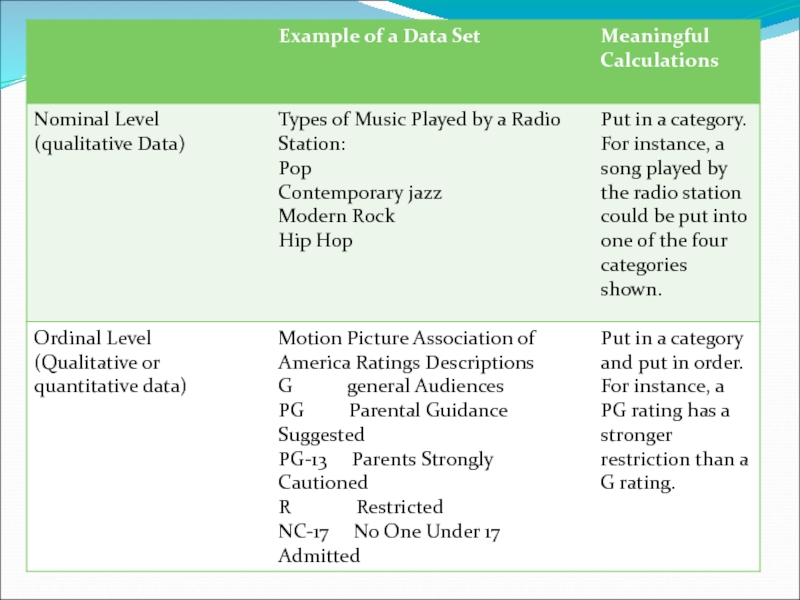
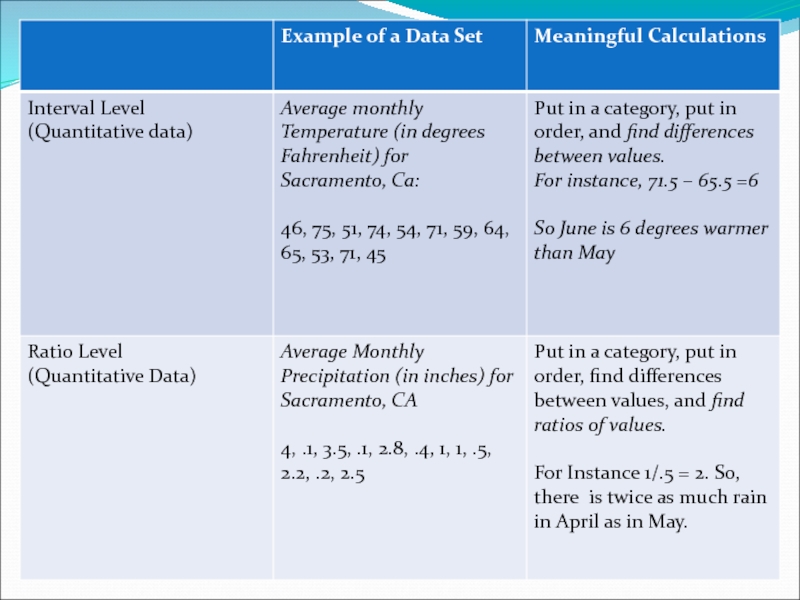
- 14. Summary of The Four Levels of Measurement
- 17. Assignment: Page 15 #2-24 even

Слайд 2Types of Data
Qualitative data consist of attributes, labels, or non-numerical entries.
Quantitative

Слайд 3Ex 1:
The base prices of several vehicles are shown in the

Слайд 4Levels of Measurement
Nominal Level of measurement are qualitative only. Data at
Ordinal Level of measurement are qualitative or quantitative. Data at this level can be arranged in order, or ranked, but differences between data entries are not meaningful.

Слайд 5Ex 2:
Two data sets are shown. Which data set consists of

Слайд 6Answer:
The first data set lists the rank of five TV programs.

Слайд 7Ex 2a:
Consider the following data sets. For each data set, decide
1. The final standings for the Pacific Division of the National Basketball Association
Answer: Ordinal, because the data can be put in order (rank)
2. A collection of phone numbers
Answer: Nominal, because you cannot make calculations on the data (labels)

Слайд 8Ex 2b:
At the beginning of 2007, Forbes Magazine chose the 25
In this list what is the level of measurement?

Слайд 9Levels of Measurement (con’t)
Data at the interval level of measurement can
Data at the ratio level of measurement are similar to data at the interval level, with the added property that a zero entry IS an inherent zero. A ratio of two data values can be formed so that one data value can be meaningfully expressed as a multiple of another.
Data at the interval level of measurement can be ordered, and you")
Слайд 10Inherent Zero example:
An inherent zero is a zero that implies
To distinguish between data at the interval level and at the ratio level, determine whether the expression “twice as much” has any meaning in the context of the data. For instance, $2 is twice as much as $1, so these data are at the ratio level. On the other hand, 2 degrees C is not twice as warm as 1 degree C so these data are at the interval level.

Слайд 11Ex: 3
Two data sets are shown below. Which data set consists

Слайд 12Answer:
Both of these data sets contain quantitative data. Consider the dates
2000 – 1923 =77 years
But it does not make sense to say that one year is a multiple of another. So, these data are at the interval level. Using the home run totals, you can find differences and write ratios. From the data, you can see that Detroit hit 31 more home runs than Seattle hit and that Chicago hit about twice as many home runs as Kansas City hit. So, these data are at the ratio level.

Слайд 13Ex 3a: Decide whether the data are at the interval level
1. The body temperatures (in degrees Fahrenheit) of an athlete during an exercise session.
Answer: Interval, because the data can be ordered and meaningful differences can be calculated, but it does not make sense to write a ratio using the temperatures.
2. The heart rates (in beats per minute) of an athlete during an exercise session.
Answer: Ratio, because the data can be ordered, meaningful differences can be calculated, the data can be written as a ratio and the data set contains an inherent zero.