- Главная
- Разное
- Дизайн
- Бизнес и предпринимательство
- Аналитика
- Образование
- Развлечения
- Красота и здоровье
- Финансы
- Государство
- Путешествия
- Спорт
- Недвижимость
- Армия
- Графика
- Культурология
- Еда и кулинария
- Лингвистика
- Английский язык
- Астрономия
- Алгебра
- Биология
- География
- Детские презентации
- Информатика
- История
- Литература
- Маркетинг
- Математика
- Медицина
- Менеджмент
- Музыка
- МХК
- Немецкий язык
- ОБЖ
- Обществознание
- Окружающий мир
- Педагогика
- Русский язык
- Технология
- Физика
- Философия
- Химия
- Шаблоны, картинки для презентаций
- Экология
- Экономика
- Юриспруденция
Multivariate Analysis and Visualization Tools for Metabolomic Data презентация
Содержание
- 1. Multivariate Analysis and Visualization Tools for Metabolomic Data
- 2. State of the art facility producing
- 3. Data Analysis and Visualization Quality Assessment use
- 4. Data Analysis and Visualization Quality Assessment use
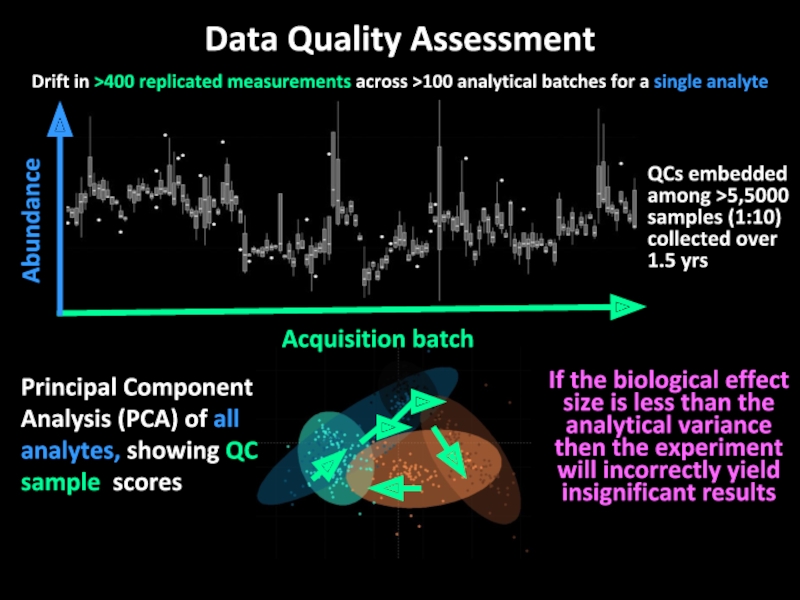
- 5. Data Quality Assessment Drift in >400 replicated
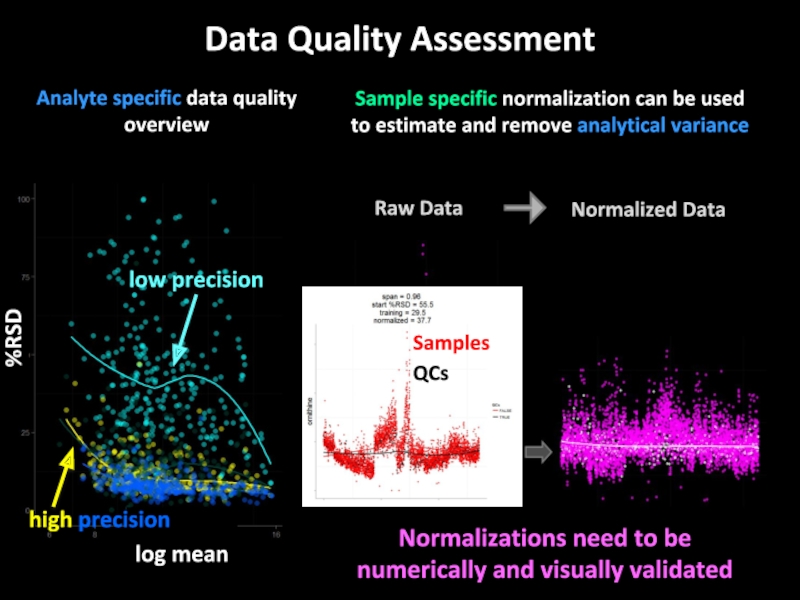
- 6. Data Quality Assessment Analyte specific data quality
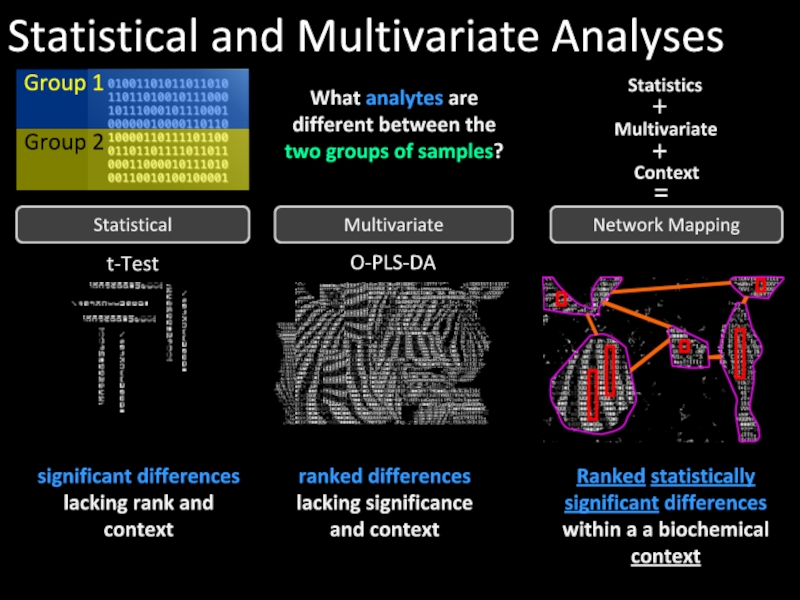
- 7. Statistical and Multivariate Analyses
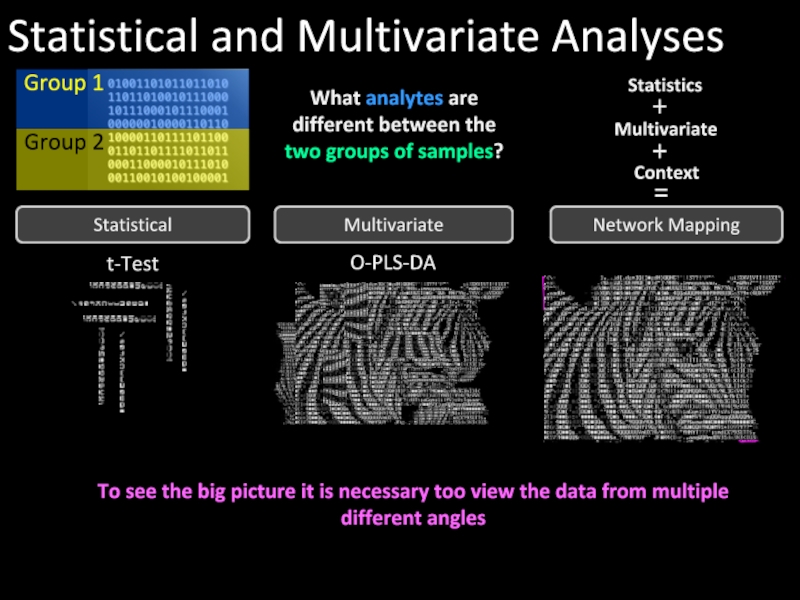
- 8. Statistical and Multivariate Analyses To see the
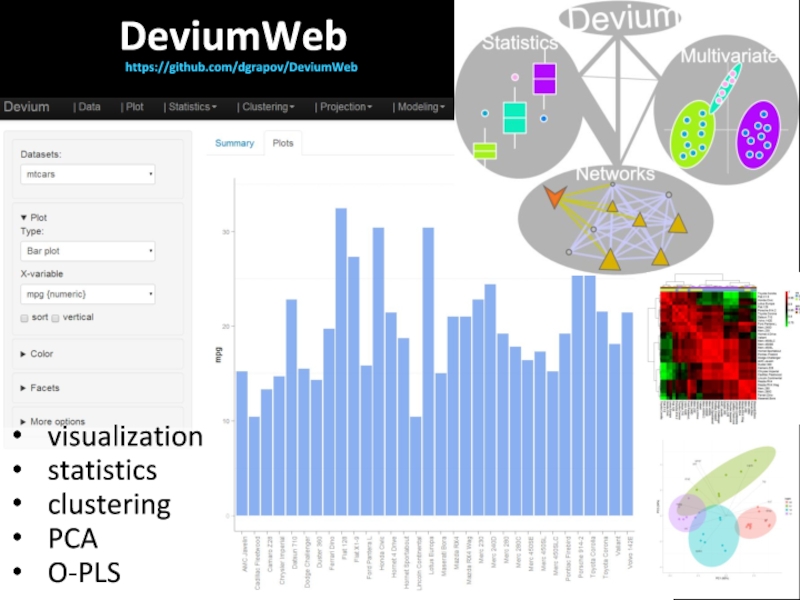
- 9. DeviumWeb https://github.com/dgrapov/DeviumWeb visualization statistics clustering PCA O-PLS
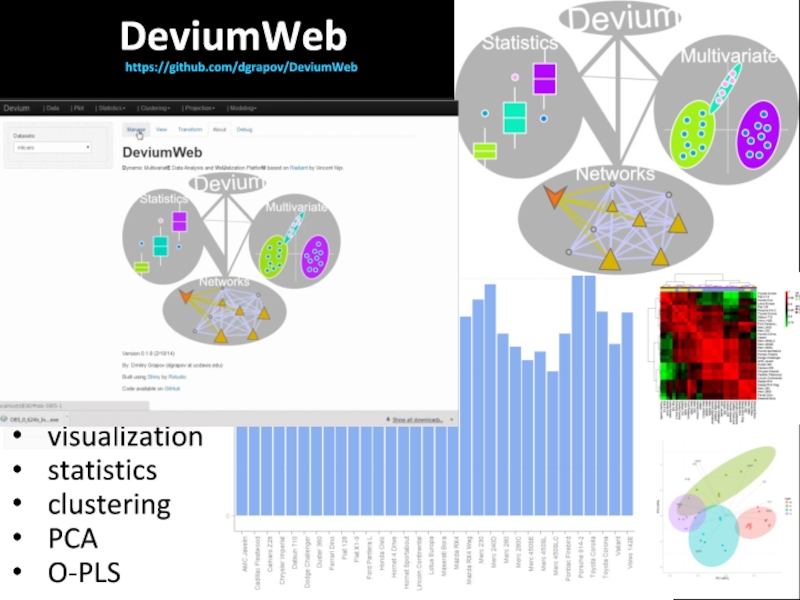
- 10. DeviumWeb https://github.com/dgrapov/DeviumWeb visualization statistics clustering PCA O-PLS
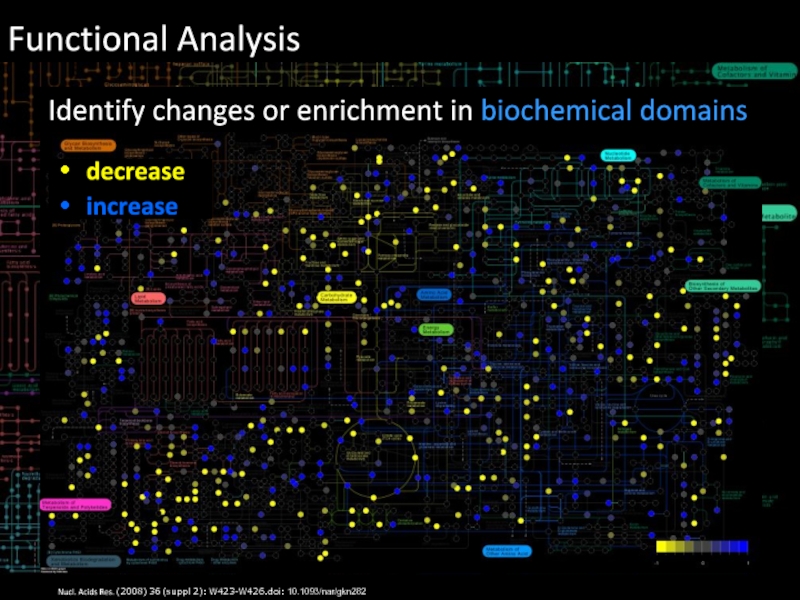
- 11. Functional Analysis Nucl. Acids Res. (2008) 36 (suppl 2): W423-W426.doi: 10.1093/nar/gkn282
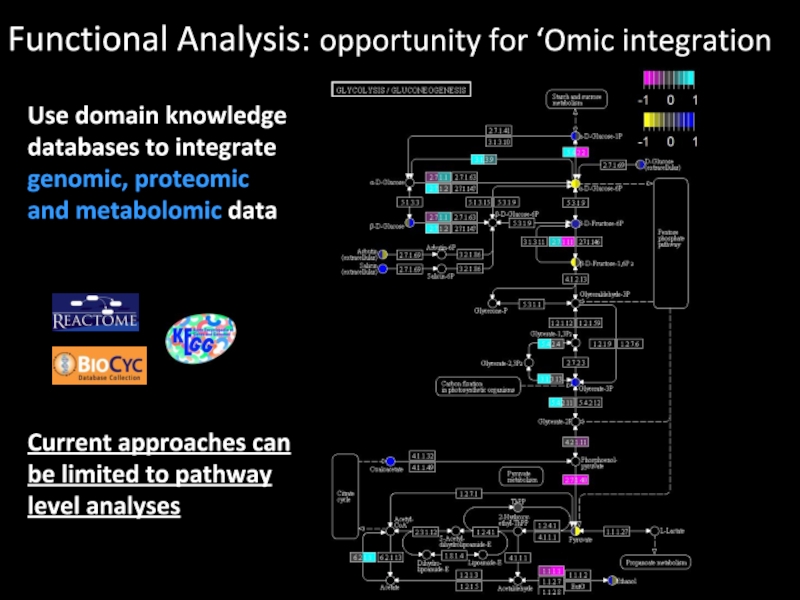
- 12. Functional Analysis: opportunity for ‘Omic integration Use
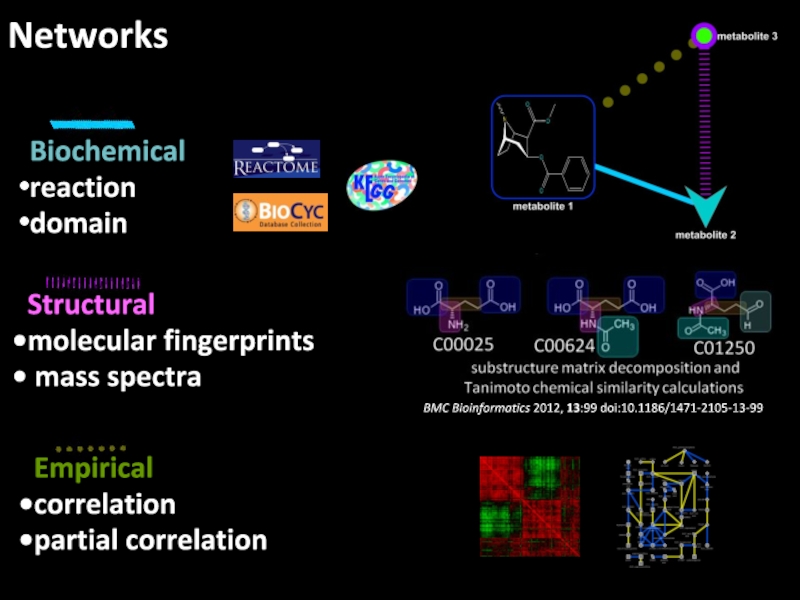
- 13. Networks Biochemical reaction domain Structural molecular
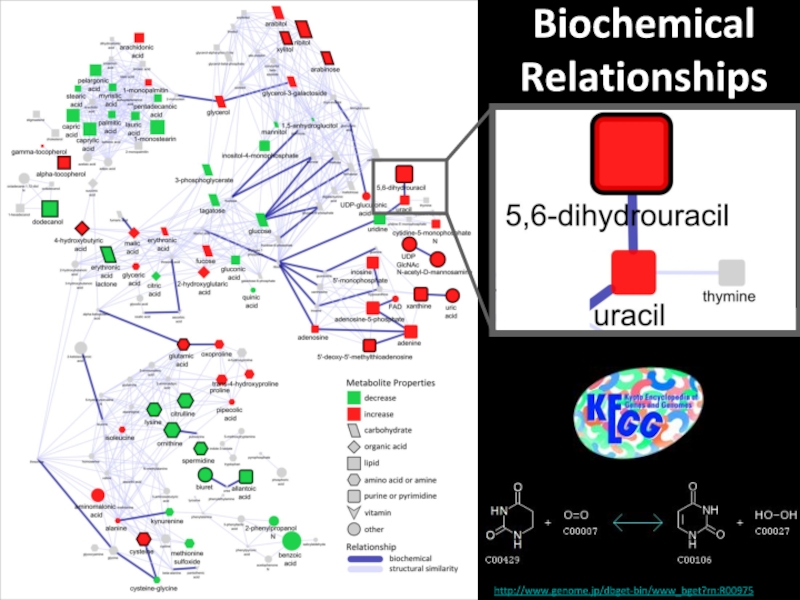
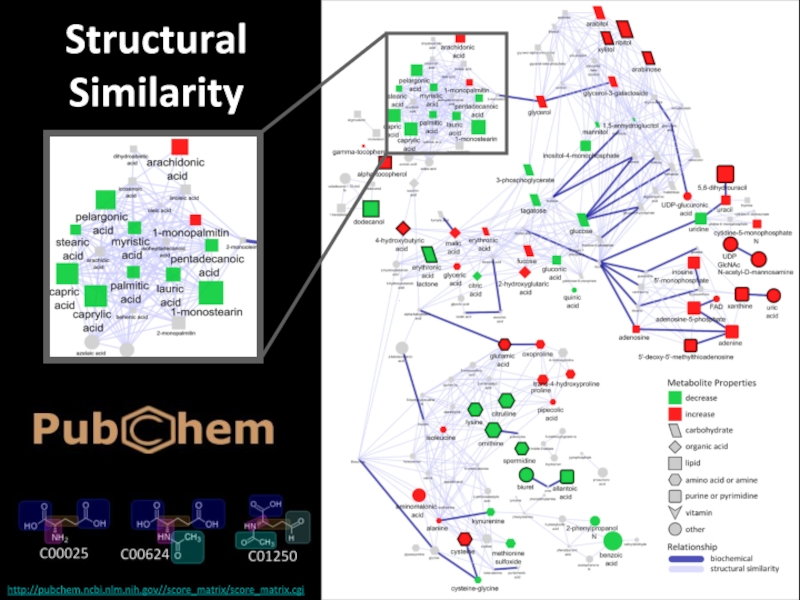
- 14. Mapped Network - displaying metabolic differences in control vs. malignant lung tissue
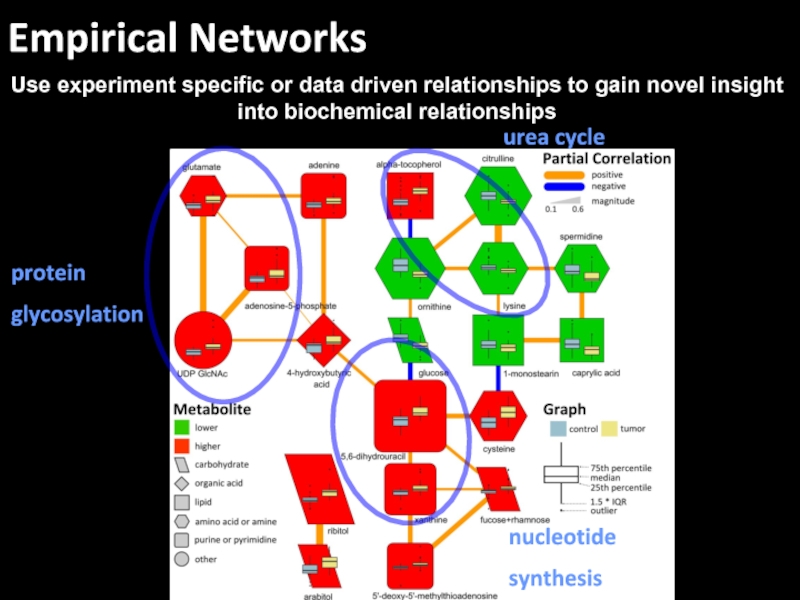
- 16. Empirical Networks Use experiment specific or data
- 17. Mass Spectral Networks Use mass spectra as
- 18. Mass Spectral Networks Use mass spectra
- 19. MetaMapR https://github.com/dgrapov/MetaMapR
- 21. Analysis at the Metabolomic Scale and Beyond
- 22. Software and Resources DeviumWeb- Dynamic multivariate data
- 23. dgrapov@ucdavis.edu metabolomics.ucdavis.edu This research was supported in part by NIH 1 U24 DK097154
Слайд 1Dmitry Grapov and Oliver Fiehn
University of California, Davis
Multivariate Analysis and Visualization
Слайд 2
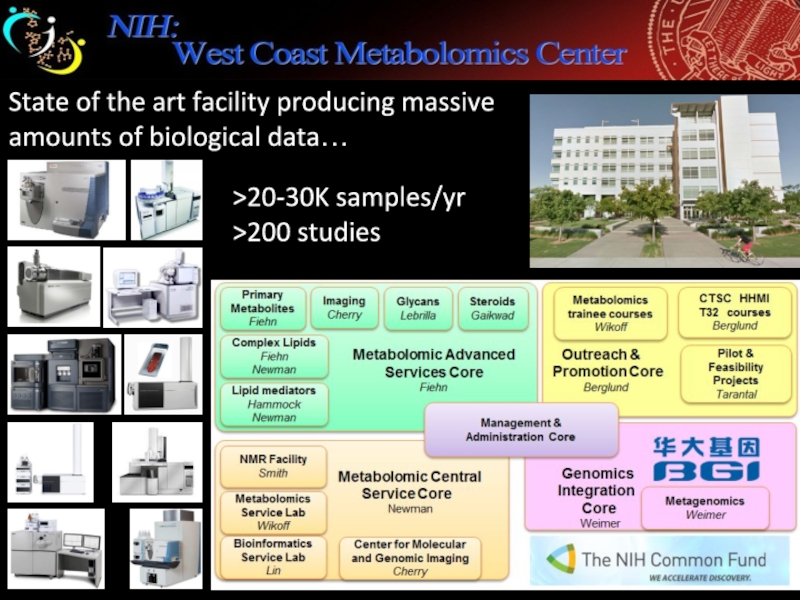
State of the art facility producing massive amounts of biological data…
>20-30K
>200 studies
Слайд 3Data
Analysis and Visualization
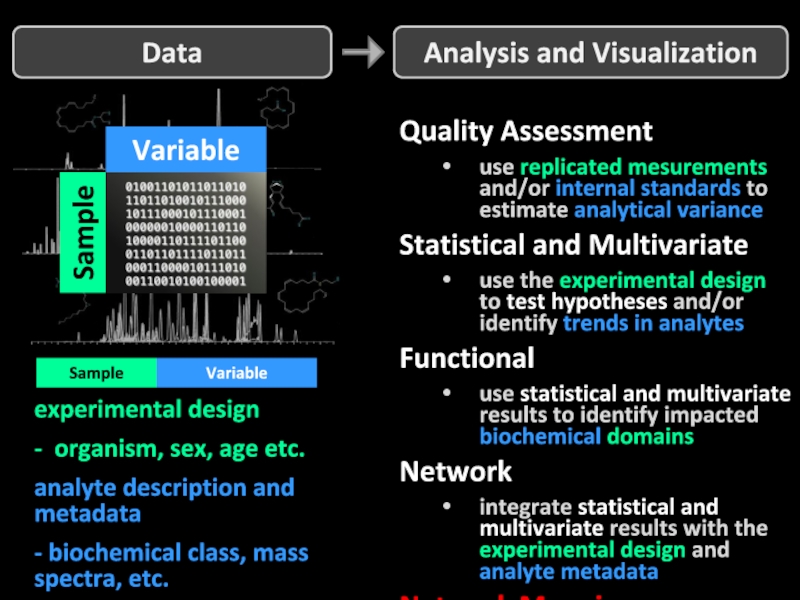
Quality Assessment
use replicated mesurements and/or internal standards to estimate
Statistical and Multivariate
use the experimental design to test hypotheses and/or identify trends in analytes
Functional
use statistical and multivariate results to identify impacted biochemical domains
Network
integrate statistical and multivariate results with the experimental design and analyte metadata
experimental design
- organism, sex, age etc.
analyte description and metadata
- biochemical class, mass spectra, etc.
Слайд 4Data
Analysis and Visualization
Quality Assessment
use replicated mesurements and/or internal standards to estimate
Statistical and Multivariate
use the experimental design to test hypotheses and/or identify trends in analytes
Functional
use statistical and multivariate results to identify impacted biochemical domains
Network
integrate statistical and multivariate results with the experimental design and analyte metadata
Network Mapping
experimental design
- organism, sex, age etc.
analyte description and metadata
- biochemical class, mass spectra, etc.
Слайд 5Data Quality Assessment
Drift in >400 replicated measurements across >100 analytical batches
Acquisition batch
Abundance
QCs embedded among >5,5000 samples (1:10) collected over 1.5 yrs
If the biological effect size is less than the analytical variance then the experiment will incorrectly yield insignificant results
Слайд 6Data Quality Assessment
Analyte specific data quality overview
Normalizations need to be numerically
Слайд 8Statistical and Multivariate Analyses
To see the big picture it is necessary
Слайд 12Functional Analysis: opportunity for ‘Omic integration
Use domain knowledge databases to integrate
Current approaches can be limited to pathway level analyses
Слайд 13Networks
Biochemical
reaction
domain
Structural
molecular fingerprints
mass spectra
Empirical
correlation
partial correlation
Слайд 16Empirical Networks
Use experiment specific or data driven relationships to gain novel
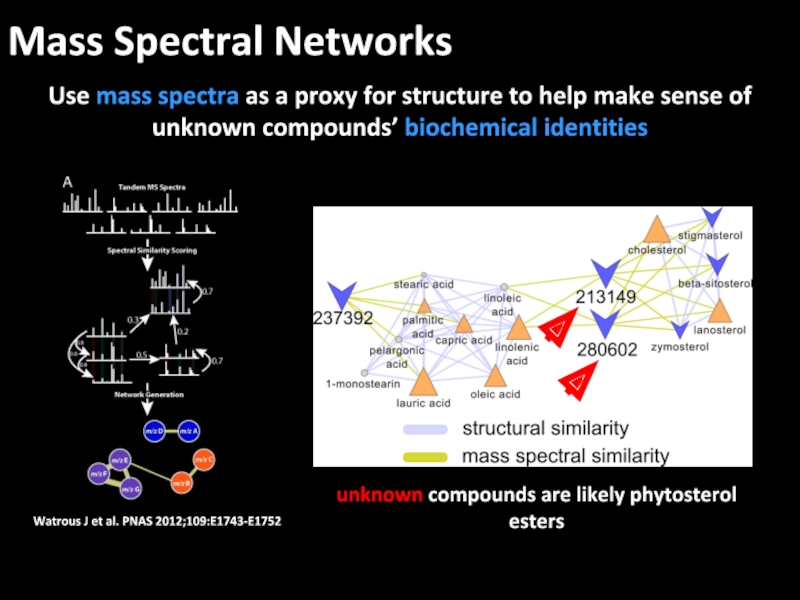
Слайд 17Mass Spectral Networks
Use mass spectra as a proxy for structure to
Watrous J et al. PNAS 2012;109:E1743-E1752
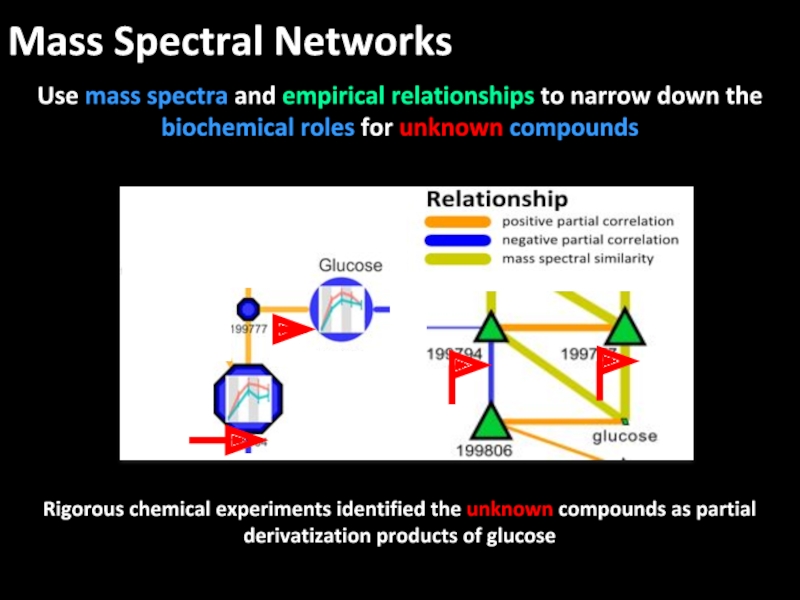
Слайд 18
Mass Spectral Networks
Use mass spectra and empirical relationships to narrow down
Rigorous chemical experiments identified the unknown compounds as partial derivatization products of glucose
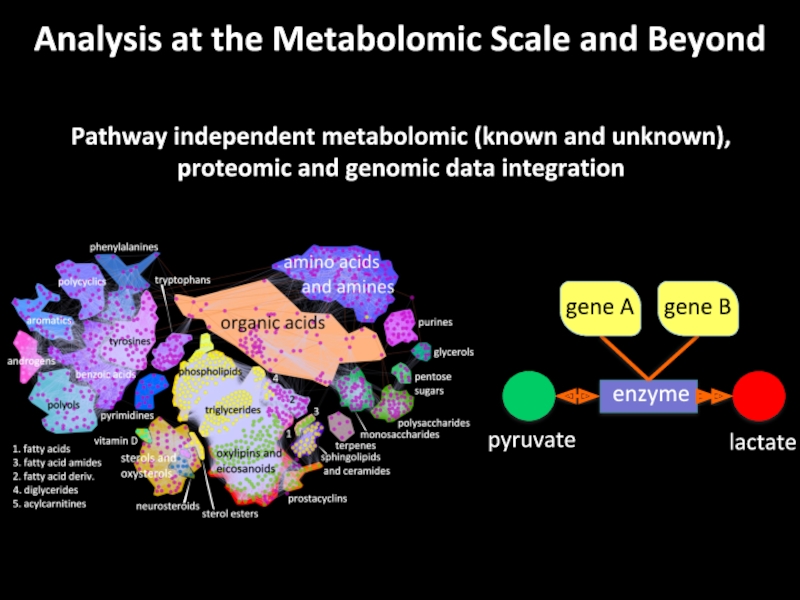
Слайд 21Analysis at the Metabolomic Scale and Beyond
Pathway independent metabolomic (known and
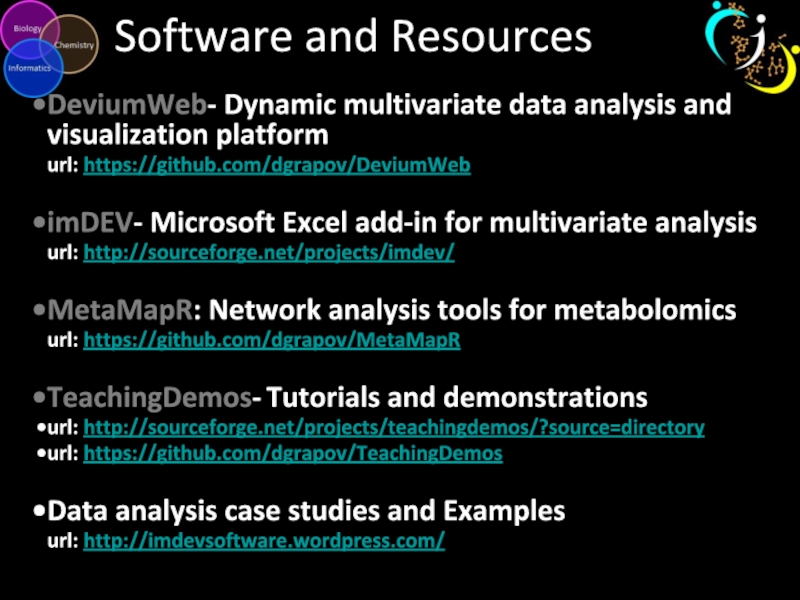
Слайд 22Software and Resources
DeviumWeb- Dynamic multivariate data analysis and visualization platform
url: https://github.com/dgrapov/DeviumWeb
imDEV-
url: http://sourceforge.net/projects/imdev/
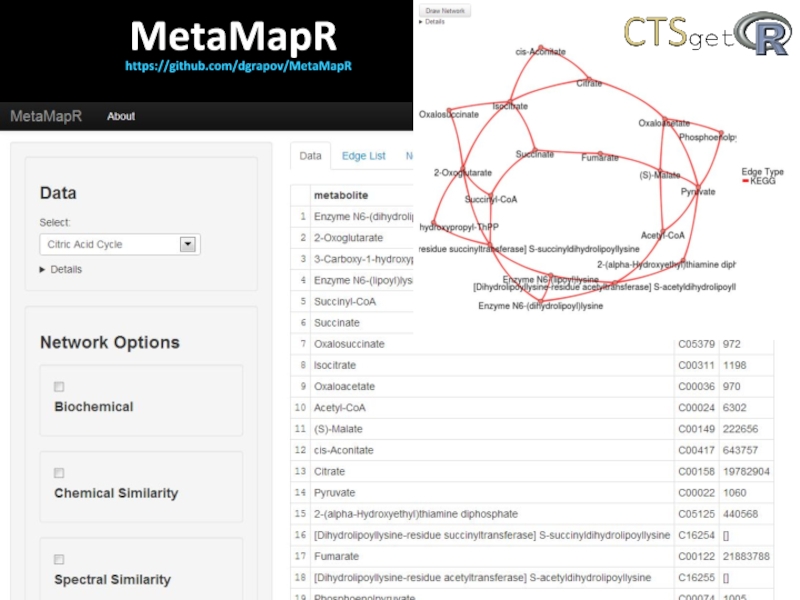
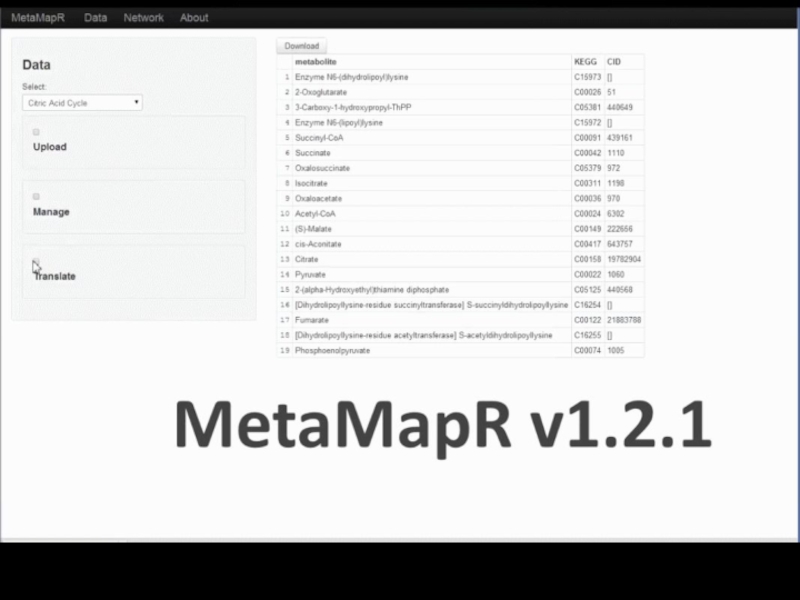
MetaMapR: Network analysis tools for metabolomics
url: https://github.com/dgrapov/MetaMapR
TeachingDemos- Tutorials and demonstrations
url: http://sourceforge.net/projects/teachingdemos/?source=directory
url: https://github.com/dgrapov/TeachingDemos
Data analysis case studies and Examples
url: http://imdevsoftware.wordpress.com/
