- Главная
- Разное
- Дизайн
- Бизнес и предпринимательство
- Аналитика
- Образование
- Развлечения
- Красота и здоровье
- Финансы
- Государство
- Путешествия
- Спорт
- Недвижимость
- Армия
- Графика
- Культурология
- Еда и кулинария
- Лингвистика
- Английский язык
- Астрономия
- Алгебра
- Биология
- География
- Детские презентации
- Информатика
- История
- Литература
- Маркетинг
- Математика
- Медицина
- Менеджмент
- Музыка
- МХК
- Немецкий язык
- ОБЖ
- Обществознание
- Окружающий мир
- Педагогика
- Русский язык
- Технология
- Физика
- Философия
- Химия
- Шаблоны, картинки для презентаций
- Экология
- Экономика
- Юриспруденция
ISTP 2014 Equity, excellence and inclusiveness in education презентация
Содержание
- 1. ISTP 2014 Equity, excellence and inclusiveness in education
- 2. Skills transform lives and drive economies Odds
- 3. Inequality in skills
- 4. Literacy skills
- 5. The false choice between
- 6. PISA in brief Over half a
- 7. High mathematics performance Low mathematics performance
- 8. Socially equitable
- 9. 2012
- 10. 2012
- 12. Contribution of various factors to upper
- 15. Fostering resilience The
- 16. PISA mathematics performance
- 17. Percentage of resilient students More than
- 18. 2003 2003 2003 2012 2012 2012
- 19. The rising demand for
- 20. Building excellence Percentage of top performers
- 21. Low impact on
- 22. Low impact on
- 23. Align the resources with
- 24. Spending per student from the age
- 25. Teacher shortage Fig IV.3.5 Source: PISA 2012
- 26. Align the resources with
- 27. Adequate resources to address
- 28. Align the resources with
- 29. Adequacy of educational resources Fig IV.3.8
- 30. Educational resources are more problematic in disadvantaged
- 31. Proportion of immigrant students in socio-economically
- 32. Reflect student demography among
- 33. Prepare for work
- 34. Attractive employment and
- 35. Achieving equity in devolved
- 36. Countries that grant
- 37. Schools with more autonomy perform better than
- 38. Schools with more autonomy perform better than
- 39. Schools with more autonomy perform better than
- 40. Holistic approach to quality assurance and
- 41. School choice - what parents value
- 42. A school’s particular approach to teaching is
- 43. Financial aid for school is a greater
- 44. Advantaged families tend to seek out schools
- 45. Advantaged parents tend to seek out schools
- 46. Parents everywhere look for a safe school
- 47. Parents’ expectations for their child have a
- 48. Parents’ high expectations can nurture students’
- 49. Parents’ high expectations can foster perseverance in their child Fig III.6.11 Source: PISA 2012
- 50. Difference in mathematics performance, by attendance
- 51. Square school choice
- 52. Inclusive learning environments
- 53. High expectations for all
- 54. Disadvantaged students tend to
- 55. Countries with large proportions of truants perform
- 56. A continuum of support
- 57. Supportive school climate
- 58. A data-rich school environment
- 59. Reduce tracking and
- 60. Grade repetition sets the wrong incentives
- 61. Grade repetition is an expensive policy Fig IV.1.5 Source: PISA 2012
- 62. Reach out to communities
- 63. Strengthen school leadership
- 64. Systemic approach to restructuring
- 65. Thank you Find
Слайд 1ISTP 2014
Equity, excellence
and inclusiveness
in education
Wellington, 28 March
Andreas Schleicher

Слайд 2Skills transform lives and drive economies
Odds ratio
Increased likelihood of positive outcomes


Слайд 4
Literacy skills inequality (9th/1st decile)
Income inequality (Gini coefficient)
Low income inequality
Low skills
High income inequality
Low skills inequality
High income inequality
High skills inequality
Low income inequality
High skills inequality
Average
Average
Inequality in skills relates to
how wealth is shared in nations
Income inequality (Gini coefficient)Low income inequalityLow skills inequalityHigh income inequalityLow skills")
Слайд 5
The false choice between equity and excellence
The false choice between
equity and
Some evidence from PISA 2012

Слайд 6PISA in brief
Over half a million students…
representing 28 million 15-year-olds in
… took an internationally agreed 2-hour test…
Goes beyond testing whether students can reproduce what they were taught…
… to assess students’ capacity to extrapolate from what they know and creatively apply their knowledge in novel situations
Mathematics, reading, science, problem-solving, financial literacy
Total of 390 minutes of assessment material
… and responded to questions on…
their personal background, their schools and their engagement with learning and school
Parents, principals and system leaders provided data on…
school policies, practices, resources and institutional factors that help explain performance differences .

Слайд 7
High mathematics performance
Low mathematics performance
… Shanghai-China performs above this line (613)
Source: PISA 2012
 … 12 countries perform")
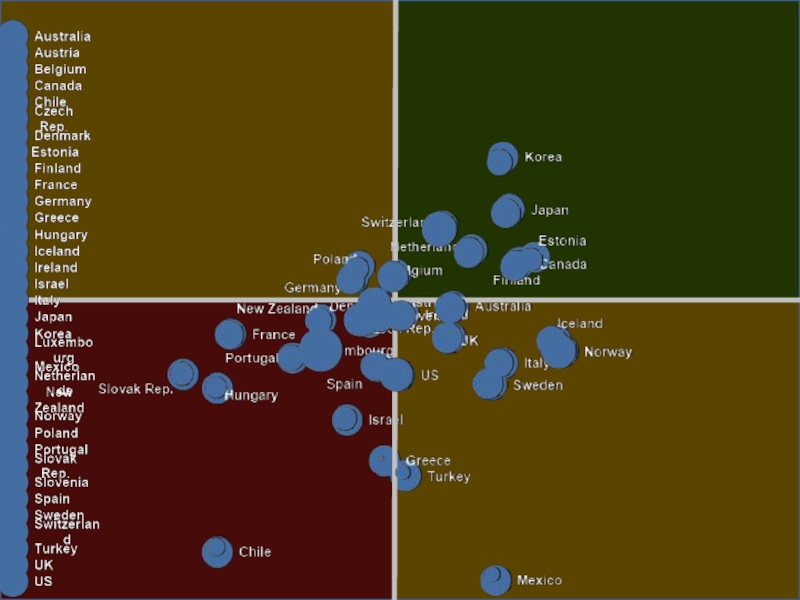
Слайд 8
Socially equitable
distribution of learning
opportunities
High mathematics performance
Low mathematics performance
Strong socio-economic
impact on student
performance

Слайд 9
2012
Socially equitable
distribution of learning
opportunities
Strong socio-economic
impact on student
performance

Слайд 10
2012
Socially equitable
distribution of learning
opportunities
Strong socio-economic
impact on student
performance

Слайд 12 Contribution of various factors to upper secondary teacher compensation costs, per
Percentage points


Слайд 14
Singapore
Shanghai
Singapore
2003 - 2012
Germany, Turkey and Mexico improved both their mathematics performance
Brazil, Italy, Macao-China, Poland, Portugal, Russian Federation, Thailand and Tunisia improved their mathematics performance (no change in equity)
Liechtenstein, Norway, the United States and Switzerland improved their equity levels (no change in performance)

Слайд 15
Fostering resilience
The country where students go to class matters more than


Слайд 17
Percentage of resilient students
More than 10% resilient
Between 5%-10% of resilient students
Less
Fig II.2.4
Socio-economically disadvantaged students not only score lower in mathematics, they also report lower levels of engagement, drive, motivation and self-beliefs. Resilient students break this link and share many characteristics of advantaged high-achievers.
A resilient student is situated in the bottom quarter of
the PISA index of economic, social and cultural
status (ESCS) in the country of assessment and
performs in the top quarter of students among all
countries, after accounting for socio-economic status.
Massachusetts
Connecticut
Florida

Слайд 182003
2003
2003
2012
2012
2012
Don’t close achievement gaps the wrong way
Performance differences between top and
Quarter of most disadvantaged students
PISA performance (mathematics)
Quarter of most privileged students
Source: PISA 2012

Слайд 19
The rising demand for advanced skills
%
Evolution of employment in occupational groups
Employment of
workers with advanced problem-solving skills
Employment of workers with poor problem-solving skills
Employment of workers with medium-low problem-solving skills (PIAAC)
Source:PIAAC 2011

Слайд 20
Building excellence
Percentage of top performers in mathematics
Tab I.2.1a
Across OECD, 13% of
Source: PISA 2012

Слайд 21
Low impact on outcomes
High impact on outcomes
Low feasibility
High feasibility
Money pits
Must haves
Low
Quick wins
Excellence, Equity and Inclusiveness

Слайд 22
Low impact on outcomes
High impact on outcomes
Low feasibility
High feasibility
Money pits
Must haves
Low
Quick wins
Attract, nurture and retain high quality teachers for the schools in greatest need
Allocate resources equitably
Make high quality early-childhood education accessible
Encourage autonomy in the context of accountability
Avoid segregation and stratification
Use assessment and evaluation to identify and support struggling students and schools

Слайд 23
Align the resources with the challenges
Countering disadvantage without rewarding underperformance

Слайд 24
Spending per student from the age of 6 to 15 and
Fig IV.1.8
Source: PISA 2012


Слайд 26
Align the resources with the challenges
Adjusted by per capita GDP
Countries with
Source: PISA 2012

Слайд 27
Adequate resources to address disadvantage
Disadvantaged schools reported more teacher shortage
Advantaged schools
A shortage of qualified teachers is more of concern
in disadvantaged schools

Слайд 28
Align the resources with the challenges
Incremental cost
Administrative discretion
Formula funding
Countering disadvantage without


Слайд 30Educational resources are more problematic in disadvantaged schools
Advantaged and private schools
Disadvantaged and public schools reported better educational resources
Fig IV.3.8

Слайд 31
Proportion of immigrant students in socio-economically disadvantaged and advantaged schools
Fig II.3.9
Percentage

Слайд 32
Reflect student demography among teachers
…it helps not just minority students but

Слайд 33
Prepare for work in disadvantaged schools
Preparation
Prepare teachers for work in
Provide mentoring in disadvantage
Improve working conditions
Career and financial incentives
Reinforce initial teacher training including curriculum content for disadvantage
Strengthening diagnostic capacity
Include practical field experience
Both new and experienced teachers benefit
Pedagogical and relational strategies

Слайд 34
Attractive employment and careers
Careers
Effective employment conditions
Building careers around teaching in tough
Professional development to address diversity
Educate the teacher educators
Attracting talent
Flexible employment
Enhance mobility
Transparency in teacher labour market

Слайд 35
Achieving equity in devolved school systems
The question is not how many

Слайд 36
Countries that grant schools autonomy over curricula and
assessments tend to
Source: PISA 2012

Слайд 37Schools with more autonomy perform better than schools with less autonomy
Score points
School autonomy for curriculum and assessment
x system's extent of implementing a standardised math policy (e.g. curriculum and instructional materials)
Fig IV.1.16
Source: PISA 2012

Слайд 38Schools with more autonomy perform better than schools with less autonomy
Score points
School autonomy for resource allocation x System's level of teachers participating in school management
Across all participating countries and economies
Fig IV.1.17
Source: PISA 2012

Слайд 39Schools with more autonomy perform better than schools with less autonomy
Score points
School autonomy for curriculum and assessment
x system's level of posting achievement data publicly
Fig IV.1.16
Source: PISA 2012

Слайд 40Holistic approach to quality assurance
and school improvement
Fig IV.4.14
Effective accountability
Aligned incentive
For students
How gateways affect the strength, direction, clarity and nature of the incentives operating on students at each stage of their education
Degree to which students have incentives to take tough courses and study hard
Opportunity costs for staying in school and performing well
For teachers
Make innovations in pedagogy and/or organisation
Improve their own performance and the performance of their colleagues
Pursue professional development opportunities that lead to stronger pedagogical practices
A balance between vertical and lateral accountability
Effective instruments to manage and share knowledge and spread innovation – communication within the system and with stakeholders around it
A capable centre with authority and legitimacy to act


Слайд 42A school’s particular approach to teaching is not a determining factor
Percentage of parents who reported that a particular approach to pedagogy is a very important criterion when choosing a school for their child
Fig IV.4.5
Source: PISA 2012

Слайд 43Financial aid for school is a greater concern among disadvantaged parents
Percentage
Fig IV.4.5
Privileged parents value financial assistance less
Disadvantaged parents value financial assistance more
Source: PISA 2012

Слайд 44Advantaged families tend to seek out schools whose students are high
Percentage of parents who reported that students’ high academic achievement is a very important criterion in choosing a school for their child
Fig IV.4.5
Privileged parents care much more about high standards
While disadvantaged parents worry about other things more
Source: PISA 2012

Слайд 45Advantaged parents tend to seek out schools with an active and
Percentage of parents who reported that an active and pleasant climate is a very important criterion when choosing a school for their child
Fig IV.4.5
Source: PISA 2012

Слайд 46Parents everywhere look for a safe school environment for their child
Percentage
Fig IV.4.5
Source: PISA 2012

Слайд 47Parents’ expectations for their child have a strong influence on students’
Fig III.6.11
Source: PISA 2012

Слайд 48Parents’ high expectations can nurture
students’ enjoyment in learning mathematics
Fig III.6.11
Source:

Слайд 49Parents’ high expectations can foster
perseverance in their child
Fig III.6.11
Source: PISA 2012

Слайд 50
Difference in mathematics performance, by attendance at pre-primary school
Students who
school perform better
Fig III.4.12
Invest early
Source: PISA 2012

Слайд 51
Square school choice with equity
Financial incentives for schools
Assistance for disadvantaged parents
Controlled
Financial incentives
Inform parents
Foster collaboration among teachers and schools
Use student and school assessments
Provide support for teachers to exercise leadership in developing and improving professional practice
Help teachers to be heard and to influence policy making, including on the content and structure of the curriculum
Support teachers in setting the direction of their own professional development and in contributing to the professional development of their colleagues
Enhance the key role teachers play in building collaborative relationships with parents and the wider community
Promote the role of teachers in pupil assessment, teacher appraisal and school evaluation
Enable teachers to participate in activities that lead to the creation and transfer of professional knowledge.

Слайд 52
Inclusive learning environments
Creating learning environments that meet the needs of all

Слайд 53
High expectations for all students
OECD average
Countries where students have stronger beliefs
in
Source: PISA 2012


Слайд 55Countries with large proportions of truants perform worse in mathematics
Fig IV.1.22
B
Source:

Слайд 56
A continuum of support for struggling students
Make learning central, encourage engagement
Be acutely sensitive to individual differences
Provide continual assessment with formative feedback
Be demanding for every student
Ensure that students feel valued and included and learning is collaborative

Слайд 57
Supportive school climate
School climate
Focus on teacher-student and peer-relationships
Adequate and timely student
Alternative organisation of instruction time
Positive management

Слайд 58
A data-rich school environment
National and school data
School-based strategies for analysis
Data for


Слайд 60
Grade repetition sets the wrong incentives
Fig IV.1.4
R2=0.05
Greater equity
Less equity
R2=0.07
Source: PISA 2012


Слайд 62
Reach out to communities
Use diverse communication channels
Ensure balanced communication
Reach out to
Clear guidelines on what is expected from parents

Слайд 63
Strengthen school leadership
Leadership preparation with specialised knowledge on disadvantage
Reinforce coaching and
Attract great leaders to tough schools

Слайд 64
Systemic approach to restructuring schools
Context sensitivity
Targeted resources
Formal common planning time
Merit recognition
Firm action for persistent underperformance

Слайд 65
Thank you
Find out more about our work at www.oecd.org
All publications
The complete
Email: Andreas.Schleicher@OECD.org
Twitter: SchleicherEDU
and remember:
Without data, you are just another person with an opinion