- Главная
- Разное
- Дизайн
- Бизнес и предпринимательство
- Аналитика
- Образование
- Развлечения
- Красота и здоровье
- Финансы
- Государство
- Путешествия
- Спорт
- Недвижимость
- Армия
- Графика
- Культурология
- Еда и кулинария
- Лингвистика
- Английский язык
- Астрономия
- Алгебра
- Биология
- География
- Детские презентации
- Информатика
- История
- Литература
- Маркетинг
- Математика
- Медицина
- Менеджмент
- Музыка
- МХК
- Немецкий язык
- ОБЖ
- Обществознание
- Окружающий мир
- Педагогика
- Русский язык
- Технология
- Физика
- Философия
- Химия
- Шаблоны, картинки для презентаций
- Экология
- Экономика
- Юриспруденция
Distressed Market Trends презентация
Содержание
- 1. Distressed Market Trends
- 2. Foreclosure trends Distressed sale trends Single family
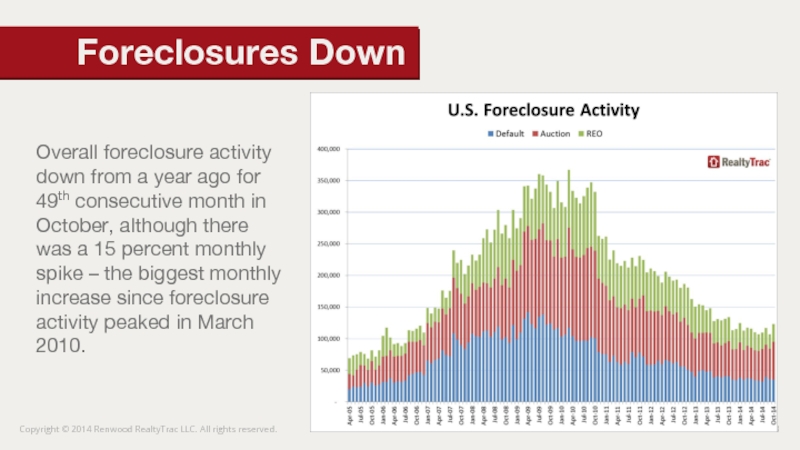
- 3. Overall foreclosure activity down from a year
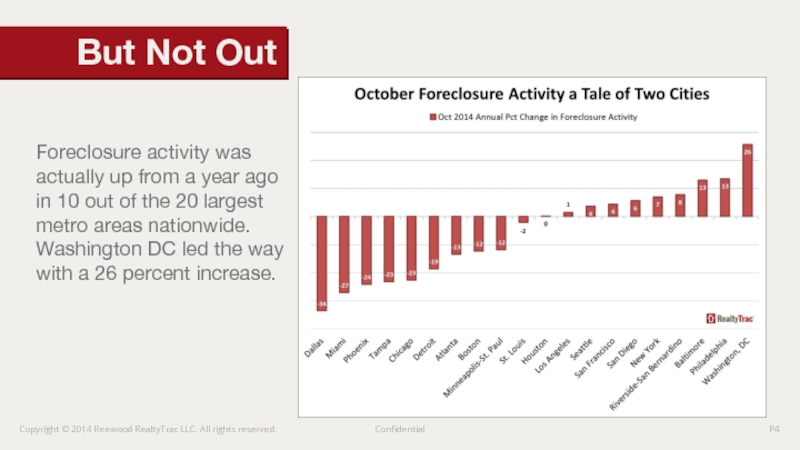
- 4. Foreclosure activity was actually up from a
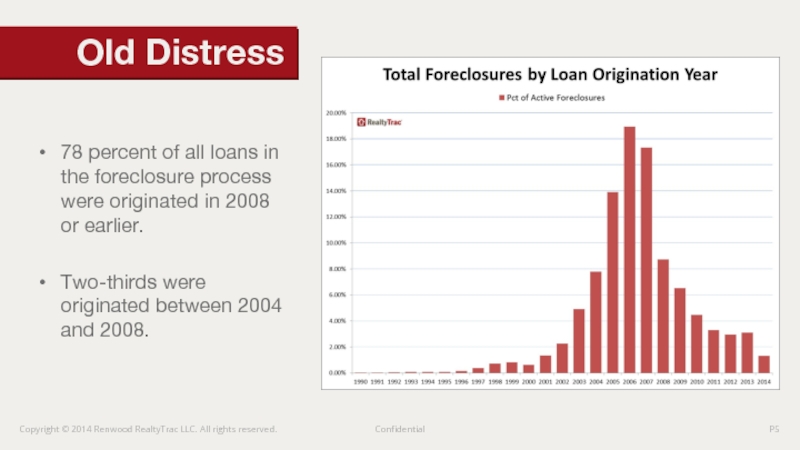
- 5. 78 percent of all loans in the
- 6. After five consecutive loan vintages with lower
- 7. Scheduled foreclosure auctions nationwide increased 1 percent
- 8. 29 states posted year-over-year increase in scheduled
- 9. 32 states posted monthly increases in REO
- 10. Sales of homes in foreclosure averaged 2.33
- 11. Short sales are back to normal, averaging
- 12. REO sales are still well above normal,
- 13. Average gross yield across 586 counties analyzed
- 14. Home flipping spiked briefly at the end
- 15. Flippers are operating much more shrewdly in
- 16. Flippers are operating much more shrewdly in
- 17. Since 2006 average: Non-distressed buyers pay 91
- 18. Google “best real estate deals” to find
- 19. Local market stats and trends down to
- 20. RealtyTrac Premium Subscription 58% discount www.realtytrac.com/reic or
- 21. Download mailing lists of homeowners in foreclosure
- 22. Thank You! Daren Blomquist darenb@realtytrac.com
Слайд 2Foreclosure trends
Distressed sale trends
Single family rentals and flipping
Where are biggest discounts?
Investor
Buying with Auction.com
AGENDA
Слайд 3Overall foreclosure activity down from a year ago for 49th consecutive
Foreclosures Down
Слайд 4Foreclosure activity was actually up from a year ago in 10
But Not Out
Слайд 578 percent of all loans in the foreclosure process were originated
Two-thirds were originated between 2004 and 2008.
Old Distress
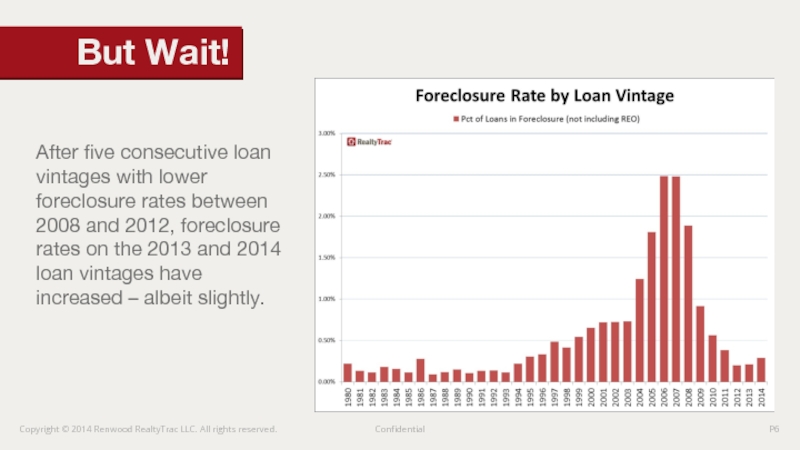
Слайд 6After five consecutive loan vintages with lower foreclosure rates between 2008
But Wait!
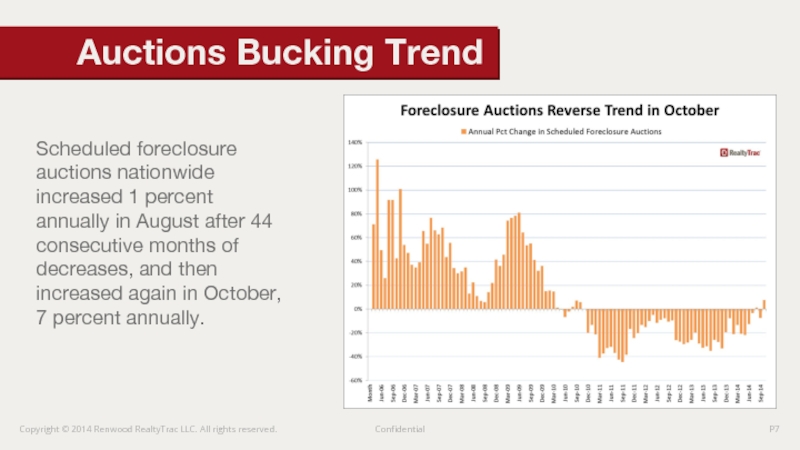
Слайд 7Scheduled foreclosure auctions nationwide increased 1 percent annually in August after
Auctions Bucking Trend
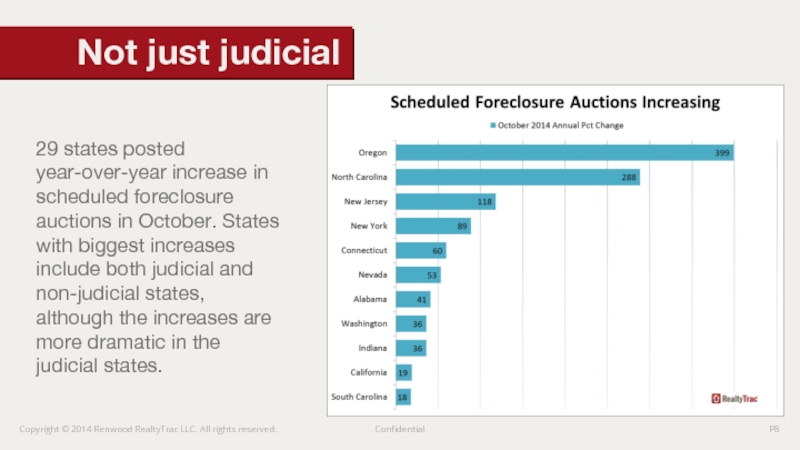
Слайд 829 states posted year-over-year increase in scheduled foreclosure auctions in October.
Not just judicial
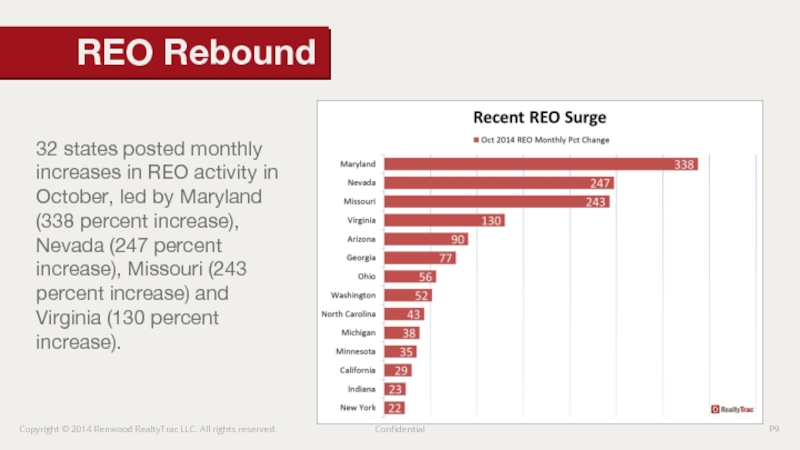
Слайд 932 states posted monthly increases in REO activity in October, led
REO Rebound
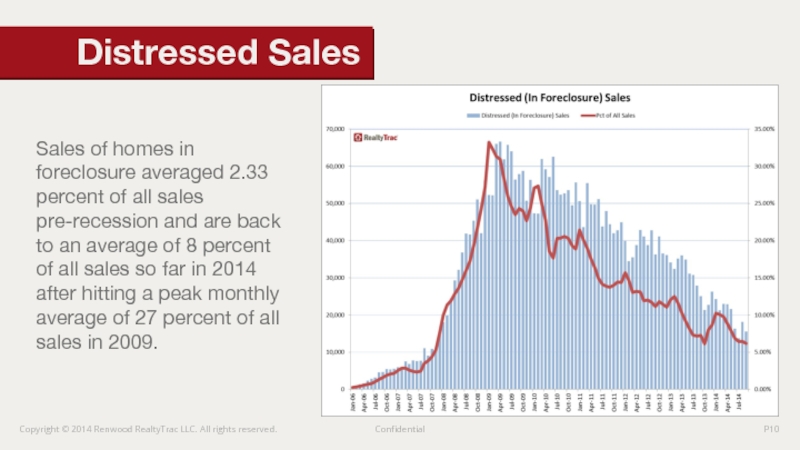
Слайд 10Sales of homes in foreclosure averaged 2.33 percent of all sales
Distressed Sales
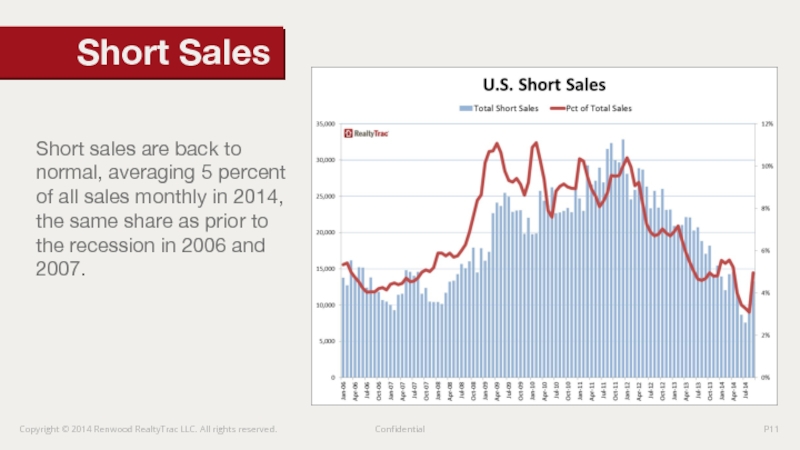
Слайд 11Short sales are back to normal, averaging 5 percent of all
Short Sales
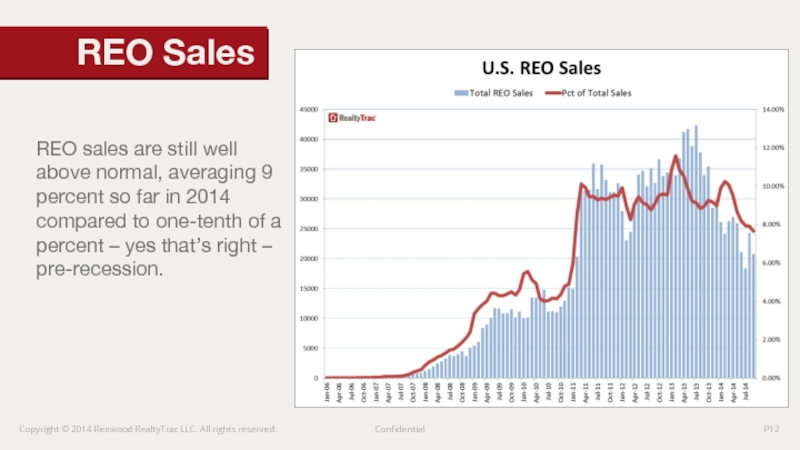
Слайд 12REO sales are still well above normal, averaging 9 percent so
REO Sales
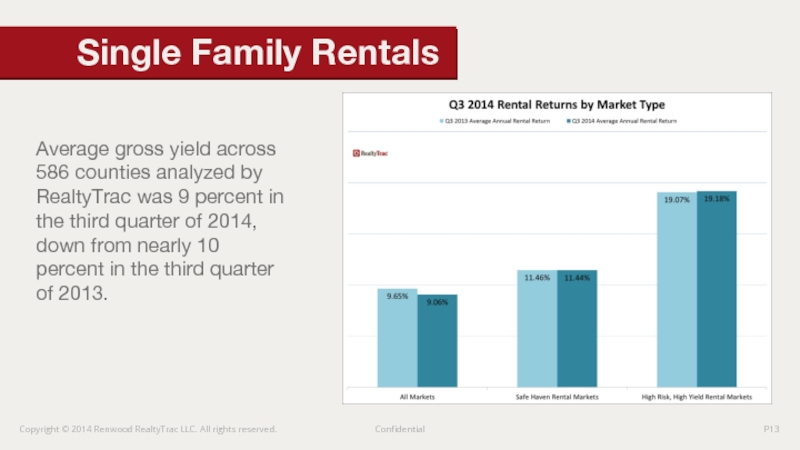
Слайд 13Average gross yield across 586 counties analyzed by RealtyTrac was 9
Single Family Rentals
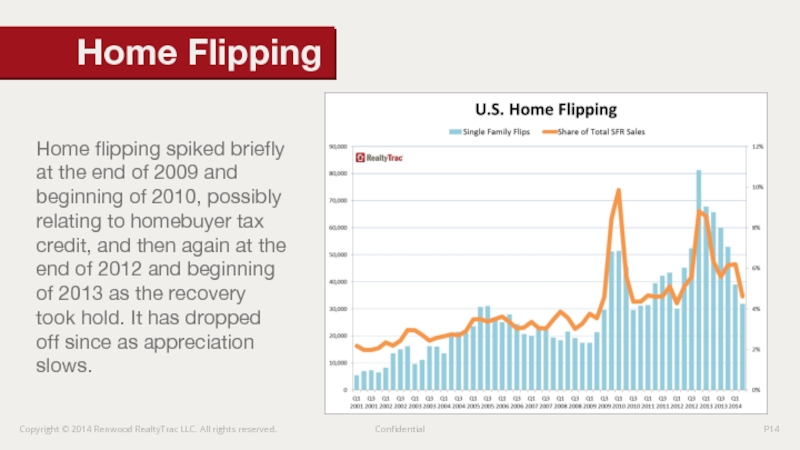
Слайд 14Home flipping spiked briefly at the end of 2009 and beginning
Home Flipping
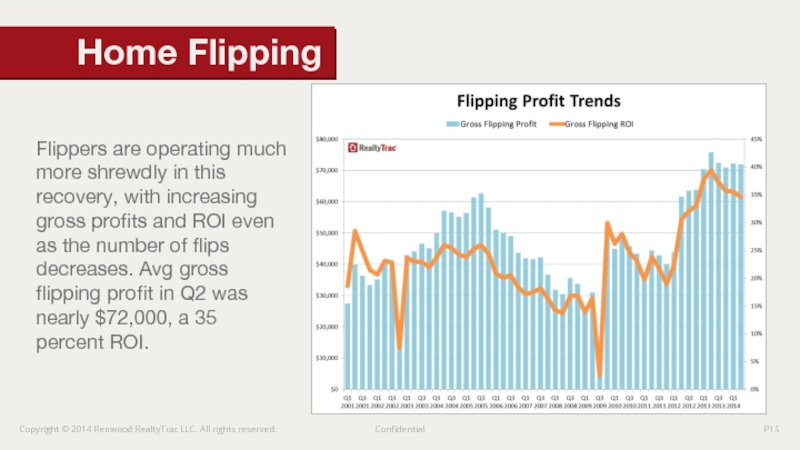
Слайд 15Flippers are operating much more shrewdly in this recovery, with increasing
Home Flipping
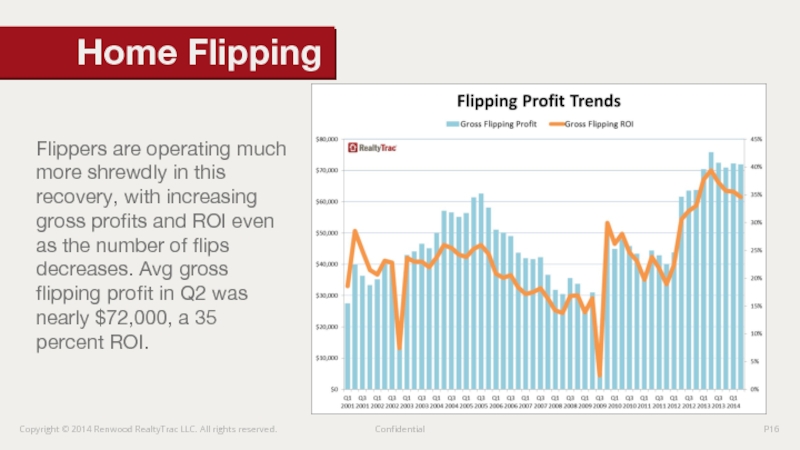
Слайд 16Flippers are operating much more shrewdly in this recovery, with increasing
Home Flipping
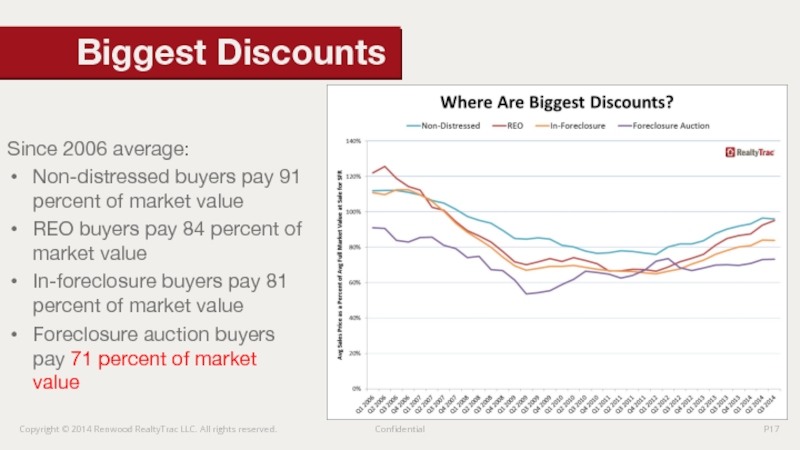
Слайд 17Since 2006 average:
Non-distressed buyers pay 91 percent of market value
REO buyers
In-foreclosure buyers pay 81 percent of market value
Foreclosure auction buyers pay 71 percent of market value
Biggest Discounts
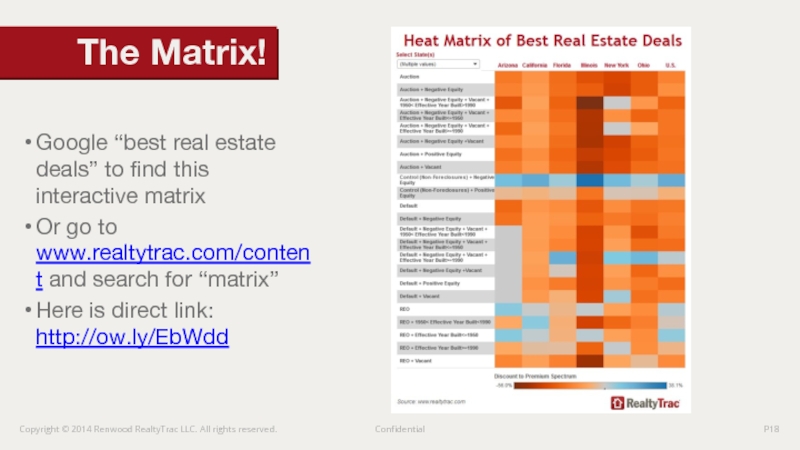
Слайд 18Google “best real estate deals” to find this interactive matrix
Or go
Here is direct link: http://ow.ly/EbWdd
The Matrix!
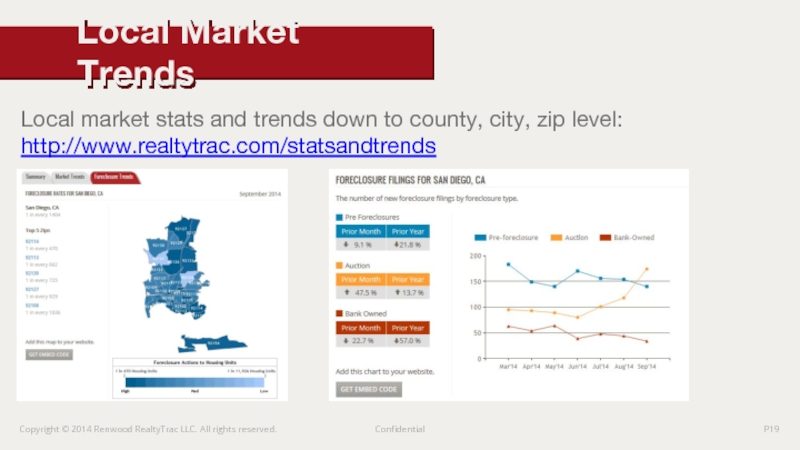
Слайд 19Local market stats and trends down to county, city, zip level:
Local Market Trends
Слайд 20RealtyTrac Premium Subscription 58% discount
www.realtytrac.com/reic or call 800.968.5162
Research 118 million U.S.
Foreclosure status and details
Listing status and details
Home value, open loans with position and equity
Sales history and sale comparables
Tax assessor info and property characteristics
More than 20 hyperlocal Homefacts impacting property value
Search & Research 118 million properties
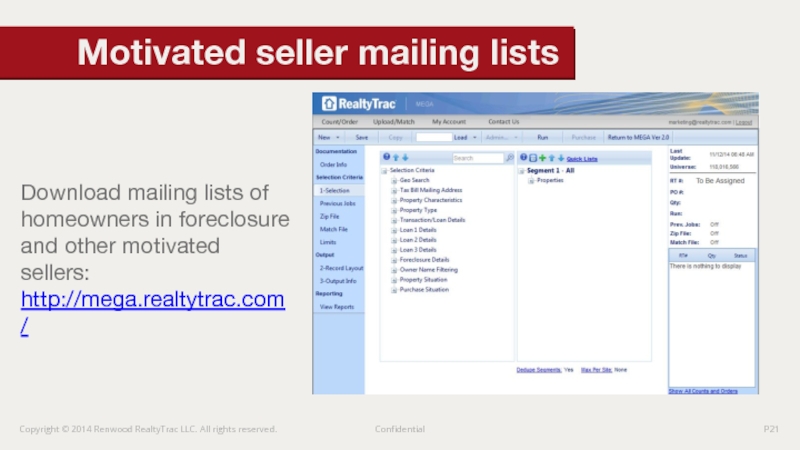
Слайд 21Download mailing lists of homeowners in foreclosure and other motivated sellers:
Motivated seller mailing lists
