- Главная
- Разное
- Дизайн
- Бизнес и предпринимательство
- Аналитика
- Образование
- Развлечения
- Красота и здоровье
- Финансы
- Государство
- Путешествия
- Спорт
- Недвижимость
- Армия
- Графика
- Культурология
- Еда и кулинария
- Лингвистика
- Английский язык
- Астрономия
- Алгебра
- Биология
- География
- Детские презентации
- Информатика
- История
- Литература
- Маркетинг
- Математика
- Медицина
- Менеджмент
- Музыка
- МХК
- Немецкий язык
- ОБЖ
- Обществознание
- Окружающий мир
- Педагогика
- Русский язык
- Технология
- Физика
- Философия
- Химия
- Шаблоны, картинки для презентаций
- Экология
- Экономика
- Юриспруденция
OPEC. Outline. Basic Facts презентация
Содержание
- 1. OPEC. Outline. Basic Facts
- 2. Outline Basic Facts on OPEC Influence of
- 3. Basic Facts OPEC was formed in Baghdad
- 4. How OPEC Exerts its Influence OPEC sets
- 6. Middle East Although OPEC is not an
- 7. As the graph illustrates, the main price
- 8. Saudi Arabia has been the main producer
- 9. Production from OPEC Countries ~ OPEC production
- 10. ~ This chart demonstrates how OPEC's share
- 11. Revenues of OPEC Nations ~ This chart
- 12. ~ In inflation adjusted terms, OPEC per
- 13. Summary While OPEC still has considerable influence
- 14. OPEC and the U.S. As I touched
- 15. Major Sources of U.S. Petroleum Imports (2001)
- 16. Comparison of U.S. Oil Imports ~Oil imports
- 17. Assuring Independence from OPEC Imports ~ Drilling
- 18. And the Ultimate Way to Assure Independence
- 19. Look at how happy and inspired these
- 20. Conclusion OPEC still has considerable influence in

Слайд 2Outline
Basic Facts on OPEC
Influence of OPEC
Production of OPEC
Revenue of OPEC
Summary
OPEC and
Ways for U.S. to Rid of Dependence on OPEC Oil Imports
Conclusion

Слайд 3Basic Facts
OPEC was formed in Baghdad in 1960 to coordinate and
The main objective of OPEC is to ensure the “stabilization of oil prices in international markets” and securing a steady income to oil producing nations
In order to achieve these objectives, the OPEC nations meet at least bi-annually to decide whether to raise or lower their collective oil production in order to maintain “stable” prices
The main factors in their formulating of petroleum policy are the forecasts for economic growth rates and petroleum demand and supply
The 11 OPEC member countries produce about 40% of the world’s crude oil, and therefore have a strong influence on the oil market
At the end of 2001, OPEC had reserves of nearly 850 billion barrels of crude oil, representing nearly 80% of the world total of over 1 trillion barrels

Слайд 4How OPEC Exerts its Influence
OPEC sets individual production quotas for each
These “production targets” for each country add up to a “ceiling” that OPEC desires not to exceed (However they rarely stay under their proposed ceiling)
The graph to the right shows the quota set by OPEC for the millions of barrels to be produced per day during Oct. 22 compared to the actual amount. (As you can see, the quota has been surpassed by over 3 million barrels per day)
Iraq is not included in the quota system because their exports are controlled by the U.N. based on the “food for oil” program

Слайд 6Middle East
Although OPEC is not an organization of Middle Eastern oil
There have been three main price spikes in world oil prices, all of which were due to unrest in the Middle East with OPEC not increasing quotas enough to compensate:
In the early 1970’s oil prices spiked as Arab oil producers embargoed oil deliveries to countries friendly to Israel
In 1979, prices soared again as Iranian oil workers went on strike in support of the Islamic Revolution, and high prices continued in the early 80’s during the Iran/Iraq War
In 1990 when Iraq invaded Kuwait, oil exports from Kuwait were severely diminished from the burning of their oil fields and the imposing of sanctions on oil exports from Iraq ( In this instance Saudi Arabia did pick up the slack substantially )

Слайд 7As the graph illustrates, the main price spikes began in the

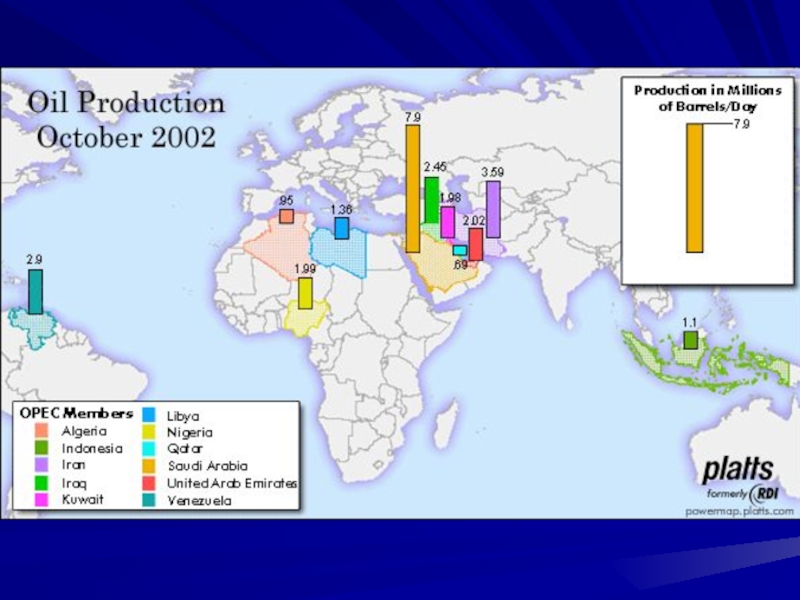
Слайд 8Saudi Arabia has been the main producer of oil from the

Слайд 9Production from OPEC Countries
~ OPEC production in barrels per day in
~ Using the percentages of production in the previous diagram, Saudi Arabia produces nearly 3 billion barrels of oil annually

Слайд 10~ This chart demonstrates how OPEC's share of world oil production
~ The world demand for millions of barrels of crude oil has gone up about 10 million during this 12 yr span while the amount supplied by OPEC only went up 4 to 5 million
~ This graph is evidence of the declining dominance of OPEC in oil supply due to the emergence of Non-OPEC suppliers such as Canada and Russia

Слайд 11Revenues of OPEC Nations
~ This chart reflects the sharp oil price
~ OPEC net oil export revenues for 2001 are an approximate $190 billion, a 20% decrease from the 2000 levels, and no way comparable to the revenues during the 1970’s

Слайд 12~ In inflation adjusted terms, OPEC per capita oil export revenues
~ For OPEC as a whole, per capita oil export revenues (in constant $2000) are projected at $327 for 2002, down 10% from the $365 per person figure for 2001
~ OPEC countries are currently heavily in debt and have populations growing, so such low per capita revenues have a potentially devastating impact
~ Not surprisingly, Saudi Arabia leads in revenues, with Iraq slowly getting back in the positive column due to the food for oil program

Слайд 13Summary
While OPEC still has considerable influence in determining the price per
Despite the overall increase in worldwide demand for petroleum, OPEC nations have not received the brunt of this increased demand. Rather, it has gone to Non-OPEC nations
As a result, over the past few years both production and revenues in the OPEC nations have declined significantly
Successful oil production in the OPEC nations is tied to the political and economic status of the volatile Middle East, which serves as a deterrent to potential importers

Слайд 14OPEC and the U.S.
As I touched upon in my first presentation,
The U.S. imports over half of these 7 billion barrels, with half of these imports coming from OPEC nations
The amount of these imports is only going to increase in the future as the nearly depleted U.S. reserves begin to run out
Some numbers for you math lovers of course:
~ 1998 U.S. oil imports- $50 Billion ~ Approx. $25 Billion to OPEC nations
~ 1999 U.S. oil imports- $67 Billion ~ Approx. $34 Billion to OPEC nations
~ 2000 U.S. oil imports- $119 Billion ~ Approx. $60 Billion to OPEC nations

")
Слайд 16Comparison of U.S. Oil Imports
~Oil imports from OPEC countries are projected
~ While the U.S. slightly easing its dependence on OPEC imports is a good sign towards not being reliant on the Persian Gulf for economic prosperity, much more efficient measures can be taken

Слайд 17Assuring Independence from OPEC Imports
~ Drilling in the ANWR- Screw the
~ No seriously, attempting to improve domestic production of oil won’t decrease our dependence on foreign imports, any gains in domestic production would be trivial compared to possible gains through efficiency
~ Congress raising fuel economy standards with car standards= to SUV
~ Eventually set a 40 mpg standard that would save 50 Billion barrels of oil over 50 yrs
~ Castrating Ronald Reagan for rolling back the impressive CAFÉ standards that put us on the path to oblivion otherwise disguised as today!
~ Other smaller efficiency measures such as:
~ Carpooling ~ Improving public transportation ~ More research in hybrid tech’s

Слайд 18And the Ultimate Way to Assure Independence from OPEC imports:
~ What man could possibly possess the qualifications and drive to pull off such an improbable campaign victory??
~Who could possibly lift the Green Party out of the eternal dungeon of defeat to execute such a policy??
~It must be someone who has made sacrifices in their life for environmental benefit!
~Someone who uses the windowsill instead of a refrigerator!

Слайд 19Look at how happy and inspired these men are after hearing
Oh no! Not the pre-game Lets win this for the gas tax speech again!

Слайд 20Conclusion
OPEC still has considerable influence in determining the price per barrel
Non-OPEC nations such as Canada and Mexico have stripped the cartel of its power to single-handedly manipulate the petroleum market
The U.S. has benefited from the increased production of petroleum by Non-OPEC nations and thus reduced their annual imports from the OPEC countries in recent years
The United States needs to address its unacceptable energy policy by stressing efficiency and reduced demand for fossil fuels