Semey,340
- Главная
- Разное
- Дизайн
- Бизнес и предпринимательство
- Аналитика
- Образование
- Развлечения
- Красота и здоровье
- Финансы
- Государство
- Путешествия
- Спорт
- Недвижимость
- Армия
- Графика
- Культурология
- Еда и кулинария
- Лингвистика
- Английский язык
- Астрономия
- Алгебра
- Биология
- География
- Детские презентации
- Информатика
- История
- Литература
- Маркетинг
- Математика
- Медицина
- Менеджмент
- Музыка
- МХК
- Немецкий язык
- ОБЖ
- Обществознание
- Окружающий мир
- Педагогика
- Русский язык
- Технология
- Физика
- Философия
- Химия
- Шаблоны, картинки для презентаций
- Экология
- Экономика
- Юриспруденция
Physiology of the Heart презентация
Содержание
- 1. Physiology of the Heart
- 2. Plan:
- 3. Functions of the Heart Generating blood pressure
- 4. The cardiovascular system is divided into
- 6. Cardiac Muscle Elongated, branching cells containing 1-2
- 7. Heart chambers and valves Structural Differences in
- 8. Cardiac Muscle Contraction Heart muscle: Is stimulated
- 9. Differences Between Skeletal and Cardiac Muscle Physiology
- 10. The Action Potential in Skeletal and Cardiac Muscle Figure 20.15
- 11. 1. Rising phase of action potential
- 12. Conducting System of Heart
- 13. Conduction System of the Heart SA node:
- 14. Heart Physiology: Intrinsic Conduction System Autorhythmic cells:
- 15. Depolarization of SA Node SA node -
- 16. Pacemaker and Action Potentials of the Heart
- 17. Heart Physiology: Sequence of Excitation Sinoatrial (SA)
- 18. Impulse Conduction through the Heart
- 19. An Electrocardiogram
- 20. Electrocardiogram Record of electrical events in the
- 21. ECGs, Normal and Abnormal
- 22. ECGs, Abnormal Extrasystole : note inverted QRS
- 23. ECGs, Abnormal Arrhythmia: conduction failure at AV node No pumping action occurs
- 24. The Cardiac Cycle Cardiac cycle refers to
- 25. Phases of the Cardiac Cycle Atrial diastole
- 26. Phases of the Cardiac Cycle Ventricular systole
- 27. Phases of the Cardiac Cycle Ventricular diastole
- 28. Pressure and Volume Relationships in the Cardiac Cycle
- 29. Cardiac Output (CO) and Cardiac Reserve
- 30. A Simple Model of Stroke Volume Figure 20.19a-d
- 31. Cardiac Output: An Example CO (ml/min) =
- 32. Factors Affecting Cardiac Output Figure 20.20
- 33. Extrinsic Innervation of the Heart Vital centers
- 34. Regulation of the Heart Neural regulation
- 35. Basic heart rate established by pacemaker cells
- 36. Pacemaker Function
- 37. Chemical Regulation of the Heart The hormones
- 38. Regulation of Stroke Volume SV: volume of
- 39. Factors Affecting Stroke Volume EDV - affected
- 40. Frank-Starling Law of the Heart Preload, or
- 41. Factors Affecting Stroke Volume
- 42. Extrinsic Factors Influencing Stroke Volume Contractility is
- 43. Effects of Autonomic Activity on Contractility Sympathetic
- 44. Contractility and Norepinephrine Sympathetic stimulation releases norepinephrine
- 45. Preload and Afterload Figure 18.21
- 46. Effects of Hormones on Contractility Epi, NE,
- 47. References Internet resources Textbook of Marya Human phisiology
Слайд 1
Physiology of the Heart
Semey State Medical University
SIW
Prepared by: Seitkenova B 340
Checked
by: Tokeshova G.


Слайд 3Functions of the Heart
Generating blood pressure
Routing blood: separates pulmonary and systemic
circulations
Ensuring one-way blood flow: valves
Regulating blood supply
Changes in contraction rate and force match blood delivery to changing metabolic needs
Ensuring one-way blood flow: valves
Regulating blood supply
Changes in contraction rate and force match blood delivery to changing metabolic needs

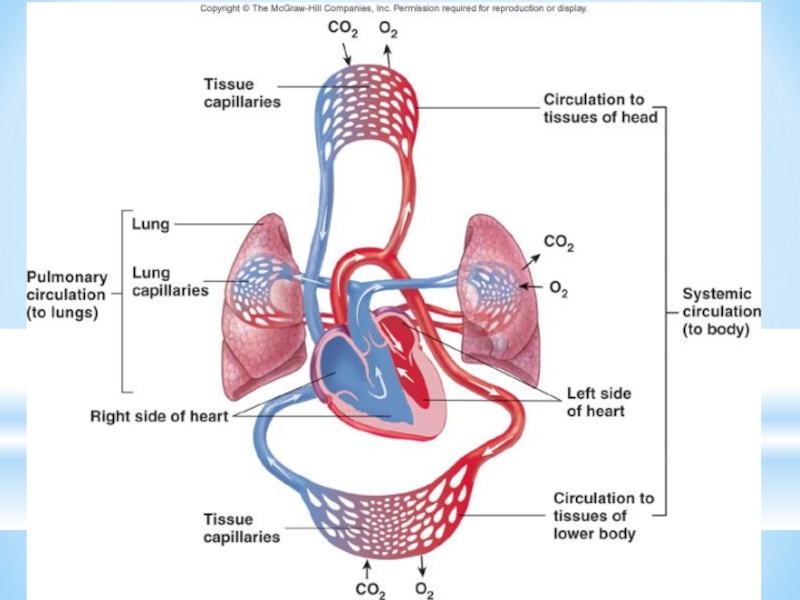
Слайд 4
The cardiovascular system is divided into two circuits
Pulmonary circuit
blood to
and from the lungs
Systemic circuit
blood to and from the rest of the body
Vessels carry the blood through the circuits
Arteries carry blood away from the heart
Veins carry blood to the heart
Capillaries permit exchange
Systemic circuit
blood to and from the rest of the body
Vessels carry the blood through the circuits
Arteries carry blood away from the heart
Veins carry blood to the heart
Capillaries permit exchange

Слайд 6Cardiac Muscle
Elongated, branching cells containing 1-2 centrally located nuclei
Contains actin and
myosin myofilaments
Intercalated disks: specialized cell-cell contacts.
Cell membranes interdigitate
Desmosomes hold cells together
Gap junctions allow action potentials to move from one cell to the next.
Electrically, cardiac muscle of the atria and of the ventricles behaves as single unit
Intercalated disks: specialized cell-cell contacts.
Cell membranes interdigitate
Desmosomes hold cells together
Gap junctions allow action potentials to move from one cell to the next.
Electrically, cardiac muscle of the atria and of the ventricles behaves as single unit
Mitochondria comprise 30% of volume of the cell vs. 2% in skeletal

Слайд 7Heart chambers and valves
Structural Differences in heart chambers
The left side of
the heart is more muscular than the right side
Functions of valves
AV valves prevent backflow of blood from the ventricles to the atria
Semilunar valves prevent backflow into the ventricles from the pulmonary trunk and aorta
Functions of valves
AV valves prevent backflow of blood from the ventricles to the atria
Semilunar valves prevent backflow into the ventricles from the pulmonary trunk and aorta

Слайд 8Cardiac Muscle Contraction
Heart muscle:
Is stimulated by nerves and is self-excitable (automaticity)
Contracts
as a unit; no motor units
Has a long (250 ms) absolute refractory period
Cardiac muscle contraction is similar to skeletal muscle contraction, i.e., sliding-filaments
Has a long (250 ms) absolute refractory period
Cardiac muscle contraction is similar to skeletal muscle contraction, i.e., sliding-filaments
Contracts as a unit; no")
Слайд 9Differences Between Skeletal and Cardiac Muscle Physiology
Action Potential
Cardiac: Action potentials conducted
from cell to cell.
Skeletal, action potential conducted along length of single fiber
Rate of Action Potential Propagation
Slow in cardiac muscle because of gap junctions and small diameter of fibers.
Faster in skeletal muscle due to larger diameter fibers.
Calcium release
Calcium-induced calcium release (CICR) in cardiac
Movement of extracellular Ca2+ through plasma membrane and T tubules into sarcoplasm stimulates release of Ca2+ from sarcoplasmic reticulum
Action potential in T-tubule stimulates Ca++ release from sarco-plasmic reticulum


Слайд 111. Rising phase of action potential
Due to opening of fast
Na+ channels
2. Plateau phase
Closure of sodium channels
Opening of calcium channels
Slight increase in K+ permeability
Prevents summation and thus tetanus of cardiac muscle
3. Repolarization phase
Calcium channels closed
Increased K+ permeability
2. Plateau phase
Closure of sodium channels
Opening of calcium channels
Slight increase in K+ permeability
Prevents summation and thus tetanus of cardiac muscle
3. Repolarization phase
Calcium channels closed
Increased K+ permeability
Electrical Properties of Myocardial Fibers


Слайд 13Conduction System of the Heart
SA node: sinoatrial node. The pacemaker.
Specialized
cardiac muscle cells.
Generate spontaneous action potentials (autorhythmic tissue).
Action potentials pass to atrial muscle cells and to the AV node
AV node: atrioventricular node.
Action potentials conducted more slowly here than in any other part of system.
Ensures ventricles receive signal to contract after atria have contracted
AV bundle: passes through hole in cardiac skeleton to reach interventricular septum
Right and left bundle branches: extend beneath endocardium to apices of right and left ventricles
Purkinje fibers:
Large diameter cardiac muscle cells with few myofibrils.
Many gap junctions.
Conduct action potential to ventricular muscle cells (myocardium)

Слайд 14Heart Physiology: Intrinsic Conduction System
Autorhythmic cells:
Initiate action potentials
Have unstable resting
potentials called pacemaker potentials
Use calcium influx (rather than sodium) for rising phase of the action potential
Use calcium influx (rather than sodium) for rising phase of the action potential

Слайд 15Depolarization of SA Node
SA node - no stable resting membrane potential
Pacemaker
potential
gradual depolarization from -60 mV, slow influx of Na+
Action potential
occurs at threshold of -40 mV
depolarizing phase to 0 mV
fast Ca2+ channels open, (Ca2+ in)
repolarizing phase
K+ channels open, (K+ out)
at -60 mV K+ channels close, pacemaker potential starts over
Each depolarization creates one heartbeat
SA node at rest fires at 0.8 sec, about 75 bpm


Слайд 17Heart Physiology: Sequence of Excitation
Sinoatrial (SA) node generates impulses about 75
times/minute
Atrioventricular (AV) node delays the impulse approximately 0.1 second
Impulse passes from atria to ventricles via the atrioventricular bundle (bundle of His) to the Purkinje fibers and finally to the myocardial fibers
Atrioventricular (AV) node delays the impulse approximately 0.1 second
Impulse passes from atria to ventricles via the atrioventricular bundle (bundle of His) to the Purkinje fibers and finally to the myocardial fibers
 node generates impulses about 75 times/minuteAtrioventricular (AV) node delays")


Слайд 20Electrocardiogram
Record of electrical events in the myocardium that can be correlated
with mechanical events
P wave: depolarization of atrial myocardium.
Signals onset of atrial contraction
QRS complex: ventricular depolarization
Signals onset of ventricular contraction..
T wave: repolarization of ventricles
PR interval or PQ interval: 0.16 sec
Extends from start of atrial depolarization to start of ventricular depolarization (QRS complex) contract and begin to relax
Can indicate damage to conducting pathway or AV node if greater than 0.20 sec (200 msec)
Q-T interval: time required for ventricles to undergo a single cycle of depolarization and repolarization
Can be lengthened by electrolyte disturbances, conduction problems, coronary ischemia, myocardial damage


Слайд 22ECGs, Abnormal
Extrasystole : note inverted QRS complex, misshapen QRS and T
and absence of a P wave preceding this contraction.


Слайд 24The Cardiac Cycle
Cardiac cycle refers to all events associated with blood
flow through the heart from the start of one heartbeat to the beginning of the next
During a cardiac cycle
Each heart chamber goes through systole and diastole
Correct pressure relationships are dependent on careful timing of contractions
During a cardiac cycle
Each heart chamber goes through systole and diastole
Correct pressure relationships are dependent on careful timing of contractions

Слайд 25Phases of the Cardiac Cycle
Atrial diastole and systole -
Blood flows
into and passively out of atria (80% of total)
AV valves open
Atrial systole pumps only about 20% of blood into ventricles
Ventricular filling: mid-to-late diastole
Heart blood pressure is low as blood enters atria and flows into ventricles
80% of blood enters ventricles passively
AV valves are open, then atrial systole occurs
Atrial systole pumps remaining 20% of blood into ventricles

Слайд 26Phases of the Cardiac Cycle
Ventricular systole
Atria relax
Rising ventricular pressure results
in closing of AV valves (1st heart sound - ‘lubb’)
Isovolumetric contraction phase
Ventricles are contracting but no blood is leaving
Ventricular pressure not great enough to open semilunar valves
Ventricular ejection phase opens semilunar valves
Ventricular pressure now greater than pressure in arteries (aorta and pulmonary trunk)
Isovolumetric contraction phase
Ventricles are contracting but no blood is leaving
Ventricular pressure not great enough to open semilunar valves
Ventricular ejection phase opens semilunar valves
Ventricular pressure now greater than pressure in arteries (aorta and pulmonary trunk)

Слайд 27Phases of the Cardiac Cycle
Ventricular diastole
Ventricles relax
Backflow of blood in aorta
and pulmonary trunk closes semilunar valves (2nd hear sound - “dubb
Dicrotic notch – brief rise in aortic pressure caused by backflow of blood rebounding off semilunar valves
Blood once again flowing into relaxed atria and passively into ventricles
Dicrotic notch – brief rise in aortic pressure caused by backflow of blood rebounding off semilunar valves
Blood once again flowing into relaxed atria and passively into ventricles


Слайд 29Cardiac Output (CO) and
Cardiac Reserve
CO is the amount of blood
pumped by each ventricle in one minute
CO is the product of heart rate (HR) and stroke volume (SV)
CO = HR x SV
(ml/min) = (beats/min) x ml/beat
HR is the number of heart beats per minute
SV is the amount of blood pumped out by a ventricle with each beat
Cardiac reserve is the difference between resting and maximal CO
CO is the product of heart rate (HR) and stroke volume (SV)
CO = HR x SV
(ml/min) = (beats/min) x ml/beat
HR is the number of heart beats per minute
SV is the amount of blood pumped out by a ventricle with each beat
Cardiac reserve is the difference between resting and maximal CO
 and Cardiac ReserveCO is the amount of blood pumped by each ventricle")

Слайд 31Cardiac Output: An Example
CO (ml/min) = HR (75 beats/min) x SV
(70 ml/beat)
CO = 5250 ml/min (5.25 L/min)
If HR increases to 150 b/min and SV increases to 120 ml/beat, then
CO = 150 b/min x 120 ml/beat
CO = 18,000 ml/min or 18 L/min (WOW is right!!)
CO = 5250 ml/min (5.25 L/min)
If HR increases to 150 b/min and SV increases to 120 ml/beat, then
CO = 150 b/min x 120 ml/beat
CO = 18,000 ml/min or 18 L/min (WOW is right!!)
 = HR (75 beats/min) x SV (70 ml/beat)CO = 5250")

Слайд 33Extrinsic Innervation of the Heart
Vital centers of medulla
1. Cardiac
Center
Cardioaccelerator center
Activates sympathetic neurons that increase HR
Cardioinhibitory center
Activates parasympathetic neurons that decrease HR
Cardiac center receives input from higher centers (hypotha-lamus), monitoring blood pressure and dissolved gas concentrations
Cardioaccelerator center
Activates sympathetic neurons that increase HR
Cardioinhibitory center
Activates parasympathetic neurons that decrease HR
Cardiac center receives input from higher centers (hypotha-lamus), monitoring blood pressure and dissolved gas concentrations

Слайд 34Regulation of the Heart
Neural regulation
Parasympathetic stimulation - a negative chronotropic factor
Supplied
by vagus nerve, decreases heart rate, acetylcholine is secreted and hyperpolarizes the heart
Sympathetic stimulation - a positive chronotropic factor
Supplied by cardiac nerves.
Innervate the SA and AV nodes, and the atrial and ventricular myocardium.
Increases heart rate and force of contraction.
Epinephrine and norepinephrine released.
Increased heart beat causes increased cardiac output. Increased force of contraction causes a lower end-systolic volume; heart empties to a greater extent. Limitations: heart has to have time to fill.
Hormonal regulation
Epinephrine and norepinephrine from the adrenal medulla.
Occurs in response to increased physical activity, emotional excitement, stress

Слайд 35Basic heart rate established by pacemaker cells
SA node establishes baseline (sinus
rhythmn)
Modified by ANS
If all ANS nerves to heart are cut, heart rate jumps to about 100 b/min
What does this tell you about which part of the ANS is most dominant during normal period?
Modified by ANS
If all ANS nerves to heart are cut, heart rate jumps to about 100 b/min
What does this tell you about which part of the ANS is most dominant during normal period?
Modified by ANSIf all")

Слайд 37Chemical Regulation of the Heart
The hormones epinephrine and thyroxine increase heart
rate
Intra- and extracellular ion concentrations must be maintained for normal heart function
Intra- and extracellular ion concentrations must be maintained for normal heart function

Слайд 38Regulation of Stroke Volume
SV: volume of blood pumped by a ventricle
per beat
SV= end diastolic volume (EDV) minus end systolic volume (ESV); SV = EDV - ESV
EDV = end diastolic volume
amount of blood in a ventricle at end of diastole
ESV = end systolic volume
amount of blood remaining in a ventricle after contraction
Ejection Fraction - % of EDV that is pumped by the ventricle; important clinical parameter
Ejection fraction should be about 55-60% or higher

Слайд 39Factors Affecting Stroke Volume
EDV - affected by
Venous return - vol. of
blood returning to heart
Preload – amount ventricles are stretched by blood (=EDV)
ESV - affected by
Contractility – myocardial contractile force due to factors other than EDV
Afterload – back pressure exerted by blood in the large arteries leaving the heart
Preload – amount ventricles are stretched by blood (=EDV)
ESV - affected by
Contractility – myocardial contractile force due to factors other than EDV
Afterload – back pressure exerted by blood in the large arteries leaving the heart

Слайд 40Frank-Starling Law of the Heart
Preload, or degree of stretch, of cardiac
muscle cells before they contract is the critical factor controlling stroke volume; ↑EDV leads to ↑stretch of myocard.
↑preload → ↑stretch of muscle → ↑force of contraction → ↑SV
Unlike skeletal fibers, cardiac fibers contract MORE FORCEFULLY when stretched thus ejecting MORE BLOOD (↑SV)
If SV is increased, then ESV is decreased!!
Slow heartbeat and exercise increase venous return (VR) to the heart, increasing SV
VR changes in response to blood volume, skeletal muscle activity, alterations in cardiac output
↑VR → ↑EDV and ↓in VR → ↓ in EDV
Any ↓ in EDV → ↓ in SV
Blood loss and extremely rapid heartbeat decrease SV


Слайд 42Extrinsic Factors Influencing Stroke Volume
Contractility is the increase in contractile strength,
independent of stretch and EDV
Referred to as extrinsic since the influencing factor is from some external source
Increase in contractility comes from:
Increased sympathetic stimuli
Certain hormones
Ca2+ and some drugs
Agents/factors that decrease contractility include:
Acidosis
Increased extracellular K+
Calcium channel blockers

Слайд 43Effects of Autonomic Activity on Contractility
Sympathetic stimulation
Release norepinephrine from symp. postganglionic
fiber
Also, EP and NE from adrenal medulla
Have positive ionotropic effect
Ventricles contract more forcefully, increasing SV, increasing ejection fraction and decreasing ESV
Parasympathetic stimulation via Vagus Nerve -CNX
Releases ACh
Has a negative inotropic effect
Hyperpolarization and inhibition
Force of contractions is reduced, ejection fraction decreased

Слайд 44Contractility and Norepinephrine
Sympathetic stimulation releases norepinephrine and initiates a cyclic AMP
2nd-messenger system
Figure 18.22


Слайд 46Effects of Hormones on Contractility
Epi, NE, and Thyroxine all have positive
ionotropic effects and thus ↑contractility
Digitalis elevates intracellular Ca++ concentrations by interfering with its removal from sarcoplasm of cardiac cells
Beta-blockers (propanolol, timolol) block beta-receptors and prevent sympathetic stimulation of heart (neg. chronotropic effect)
Digitalis elevates intracellular Ca++ concentrations by interfering with its removal from sarcoplasm of cardiac cells
Beta-blockers (propanolol, timolol) block beta-receptors and prevent sympathetic stimulation of heart (neg. chronotropic effect)