- Главная
- Разное
- Дизайн
- Бизнес и предпринимательство
- Аналитика
- Образование
- Развлечения
- Красота и здоровье
- Финансы
- Государство
- Путешествия
- Спорт
- Недвижимость
- Армия
- Графика
- Культурология
- Еда и кулинария
- Лингвистика
- Английский язык
- Астрономия
- Алгебра
- Биология
- География
- Детские презентации
- Информатика
- История
- Литература
- Маркетинг
- Математика
- Медицина
- Менеджмент
- Музыка
- МХК
- Немецкий язык
- ОБЖ
- Обществознание
- Окружающий мир
- Педагогика
- Русский язык
- Технология
- Физика
- Философия
- Химия
- Шаблоны, картинки для презентаций
- Экология
- Экономика
- Юриспруденция
Neuroendocrine tumors overview of treatment презентация
Содержание
- 1. Neuroendocrine tumors overview of treatment
- 2. NET Neuroendocrine tumors (NETs), sometimes referred to
- 3. NETs = Carcinoid tumours - heterogeneous group
- 4. NETs: An Overview Tumours may be sporadic
- 6. Mucosal neuroma
- 8. Increase in NET Incidence Compared with
- 9. GEP-NETs: Rare But Increasing, particularly for small
- 10. NET Pancreatic Non-pancreatic Functioning
- 11. Classification by embryonic origin
- 12. NETs: An Overview Over 60% of NETs
- 13. Median Survival for Patients with Localised and
- 14. Observed 5-Year Survival for GEP-NET Primary
- 15. How Well Do They Resemble Their Normal
- 16. Correlation of Tumour Grade and Cumulative Survival
- 17. Clinical Presentation Adapted from Vinik A, et
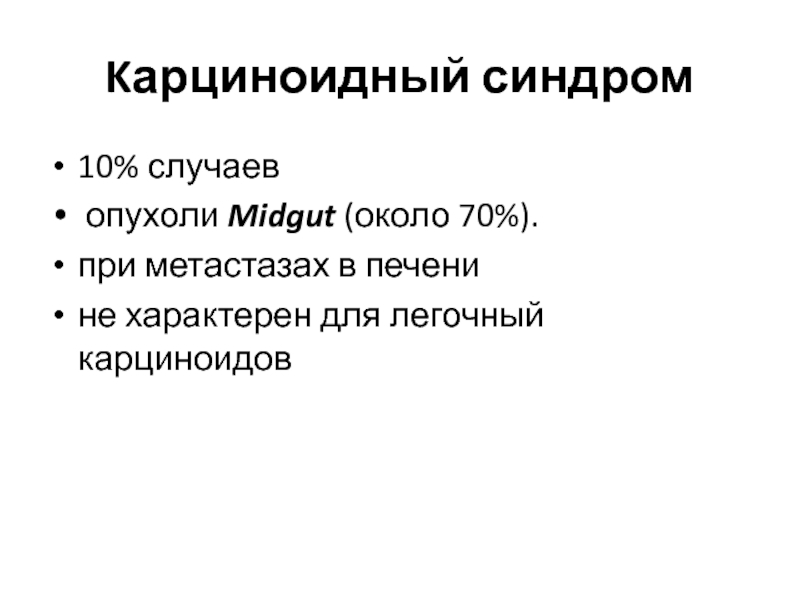
- 18. Kарциноидный синдром 10% случаев опухоли
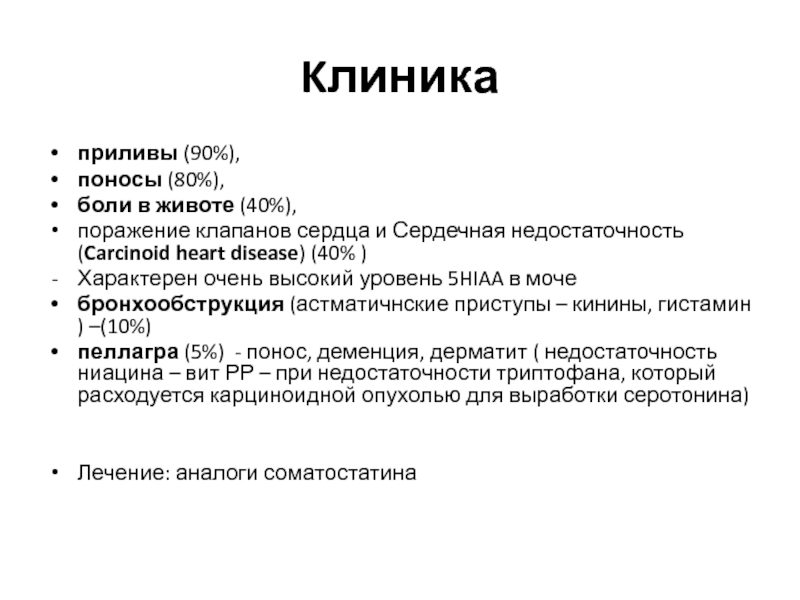
- 19. Kлиника приливы (90%), поносы (80%),
- 20. Карциноидный криз Во время операции резкий выход
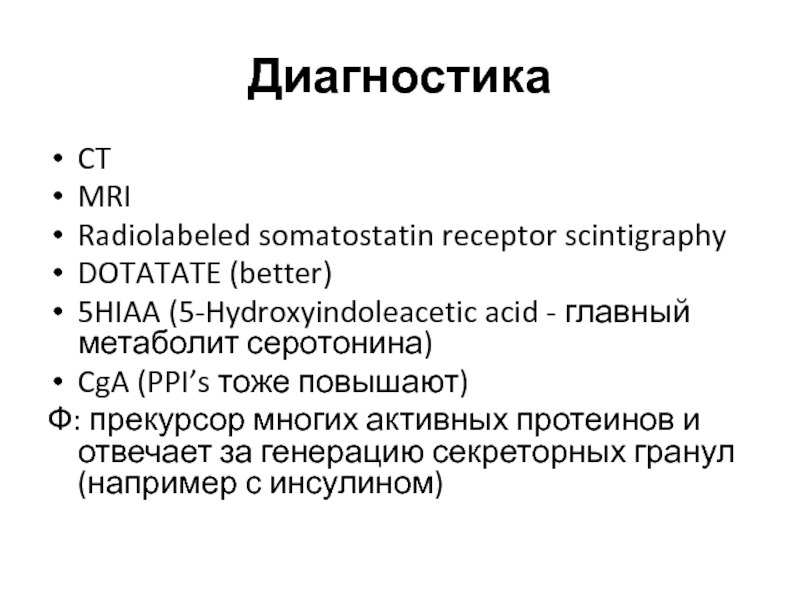
- 21. Диагностика CT MRI Radiolabeled somatostatin receptor scintigraphy
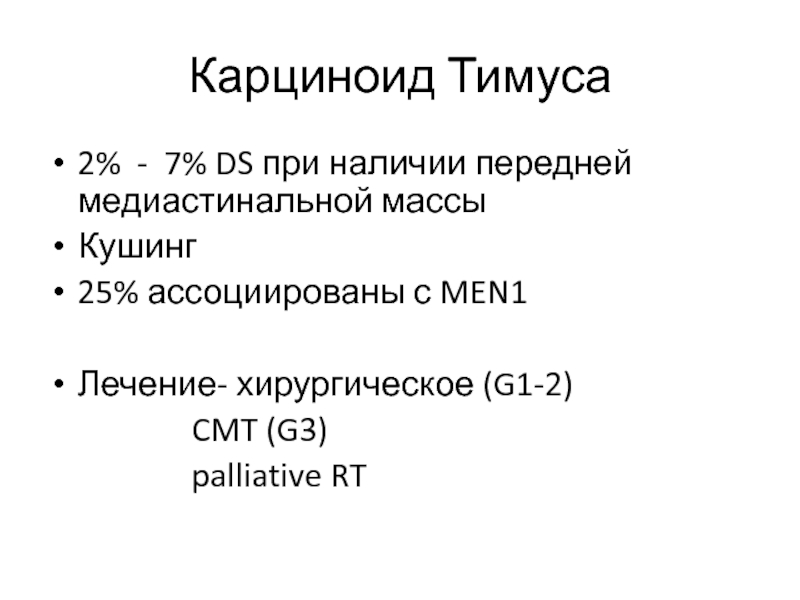
- 22. Карциноид Тимуса 2% - 7% DS при наличии
- 23. Легочный карциноид 25% Typical (low grade) Atypical
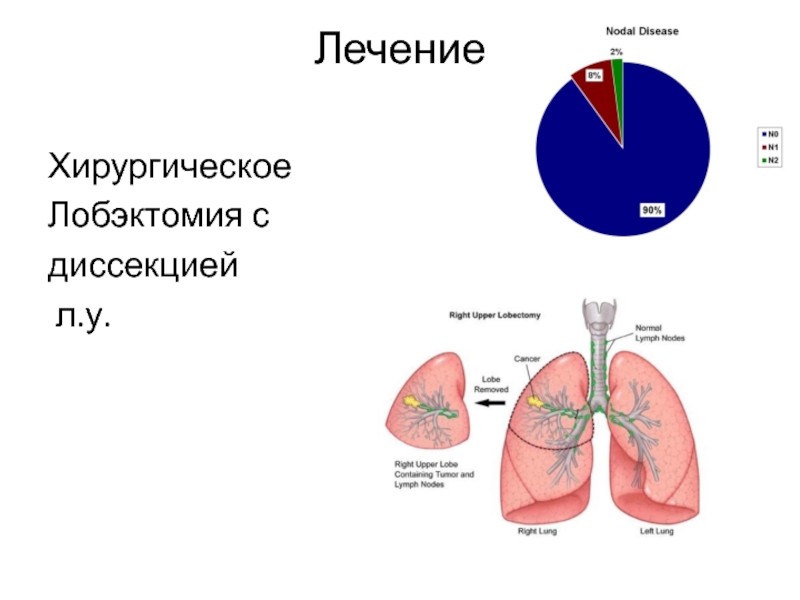
- 24. Лечение Хирургическое Лобэктомия с диссекцией л.у.
- 25. Kарциноид желудка
- 26. Лечение карциноидных опухолей желудка I тип
- 27. Kарциноид кишечника лечение хирургическое Аппендикс - 2
- 28. Нейроэндокринные опухоли поджелудочной железы
- 29. Инсулиномы Cамые частые растет из бета клеток
- 30. Гастриномы (синдром Золлингера – Эллисона) Bторое место
- 31. Випомы (синдром Вернера – Моррисона) Cекреция вазоактивного
- 32. Глюкагономы B α - клетках поджелудочной железы
- 33. Pancreatic polypeptidoma Относится к нефункционирующим опухолям ПЖЖ
- 34. Therapeutic Options NETs Surgery Curative, Ablative Debulking
- 35. Общие принципы лечения локальной болезни в зависимости
- 37. Somatostatin Signalling in NETs More than 90% of NET express somatostatin receptors3-5
- 38. Somatostatin analogs
- 40. Somatostatin analogs Octreotide LAR N=85 TTP
- 41. Tolerability of Somatostatin Analogues Shah T &
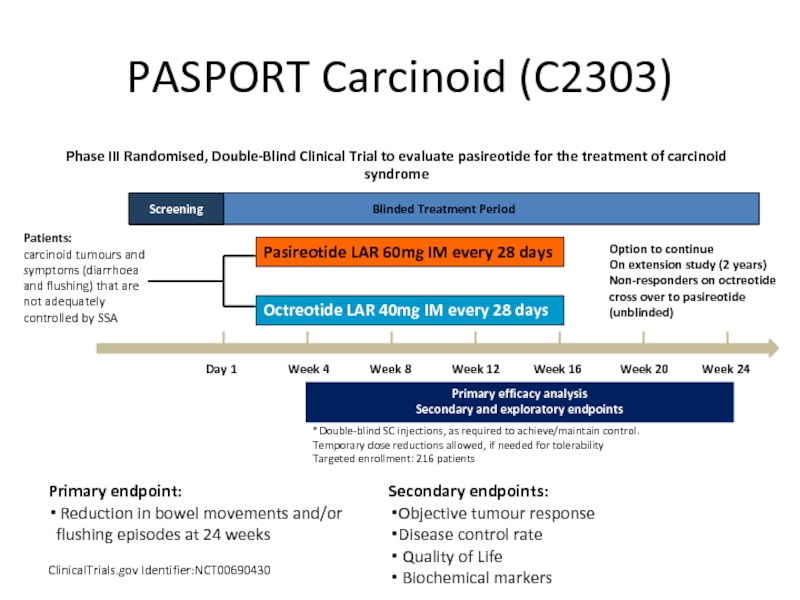
- 42. PASPORT Carcinoid (C2303) ClinicalTrials.gov Identifier:NCT00690430 Primary
- 43. Trial was terminated early based on interim
- 44. High doses of SSA
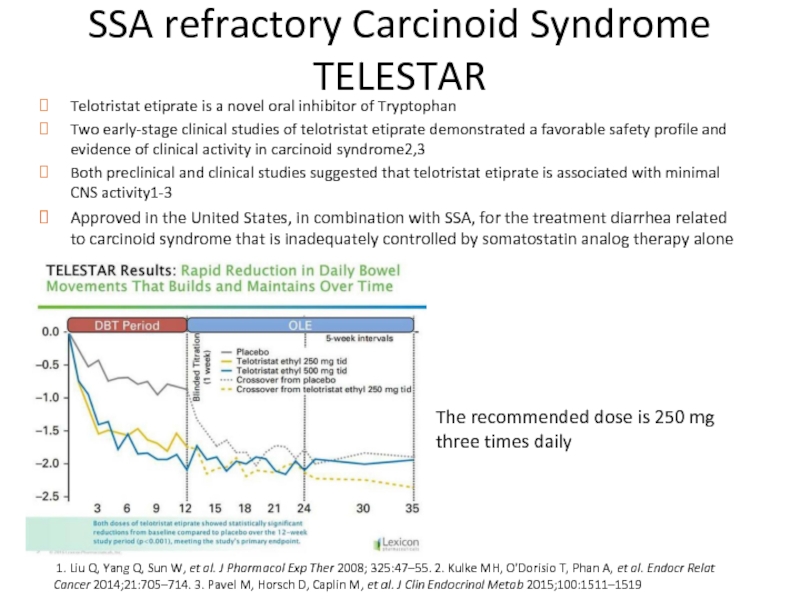
- 45. SSA refractory Carcinoid Syndrome TELESTAR Telotristat
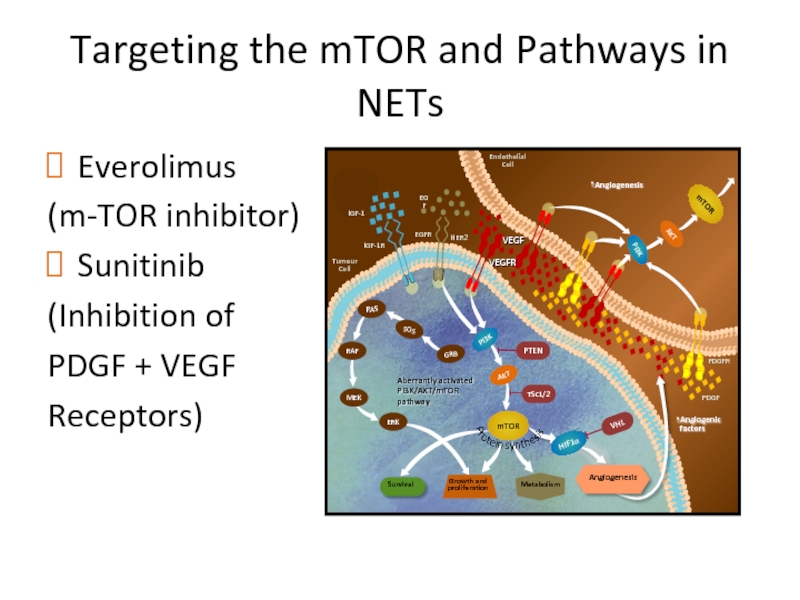
- 46. Targeting the mTOR and Pathways in NETs
- 47. The RADIANT Study Programme (RAD001 In Advanced Neuroendocrine Tumors) EVEROLIMUS
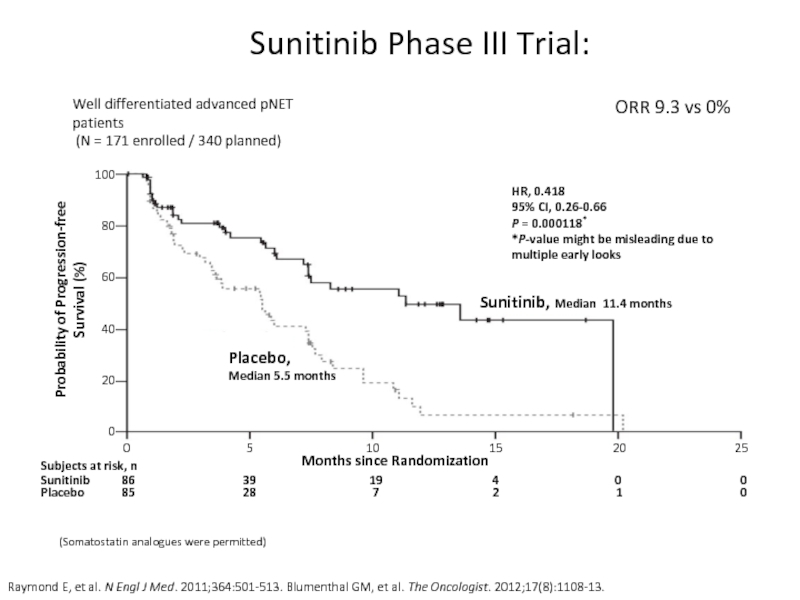
- 48. Sunitinib Phase III Trial: Raymond
- 49. Everolimus vs Sunitinib
- 50. PRRT
- 51. PRRT
- 52. Studies showed efficacy in tumor shrinkage, symptoms
- 53. Netter-1 trial Volume 376(2):125-135 January 12, 2017
- 54. PFS & OS In patients with
- 55. Chemotherapy in NET Well-differentiated NET do not
- 56. Chemotherapy in NET (cont’d)
- 57. Temozolomide Retrospective analysis of temozolomide alone suggests
Слайд 2NET
Neuroendocrine tumors (NETs), sometimes referred to as carcinoids, are abnormal growths
Neuroendocrine cells have roles both in the endocrine system and the nervous system.
They produce and secrete a variety of regulatory hormones (neuropeptides): neurotransmitters and growth factors.
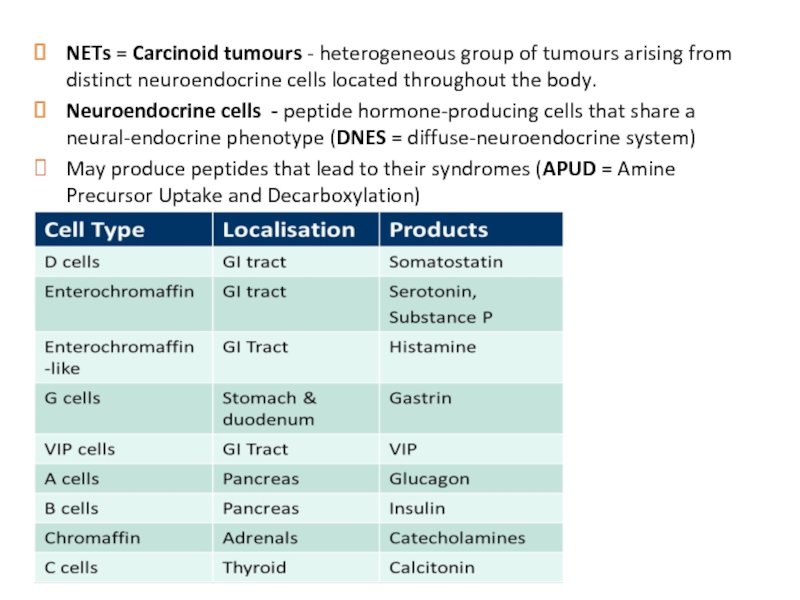
Слайд 3NETs = Carcinoid tumours - heterogeneous group of tumours arising from
Neuroendocrine cells - peptide hormone-producing cells that share a neural-endocrine phenotype (DNES = diffuse-neuroendocrine system)
May produce peptides that lead to their syndromes (APUD = Amine Precursor Uptake and Decarboxylation)
Слайд 4NETs: An Overview
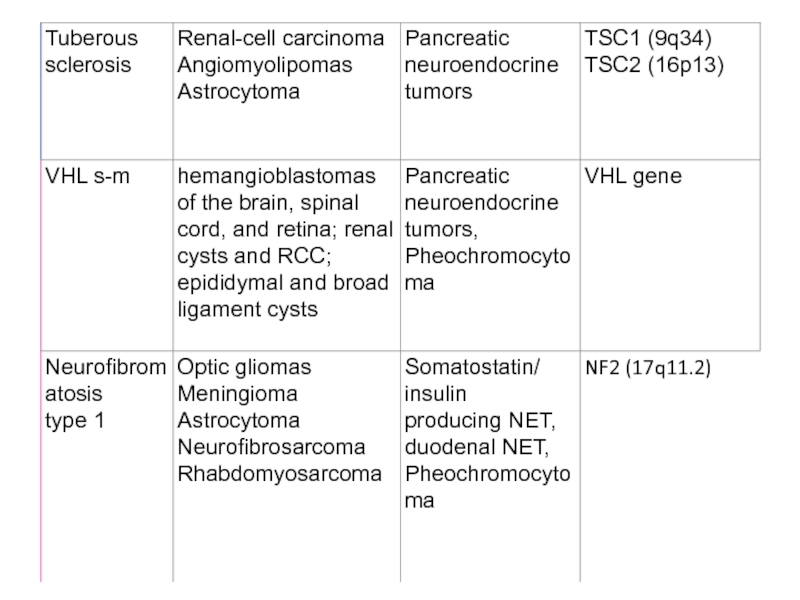
Tumours may be sporadic or hereditary (rare)
When hereditary, they
Multiple endocrine neoplasia type 1 (MEN1)
Multiple endocrine neoplasia type 2 (MEN2)
Von Hippel Lindau (vHL)
Neurofibromatosis type 1 (NF1) – duodenal somatostatinoma
TSC
Слайд 8
Increase in NET Incidence Compared with
All Malignant Neoplasms*
NETs, neuroendocrine tumors; SEER,
*Based on SEER data from 1973-2004.
Yao JC, et al. J Clin Oncol. 2008;26(18):3063-3072.
Incidence of all malignant neoplasms
Incidence of neuroendocrine tumors
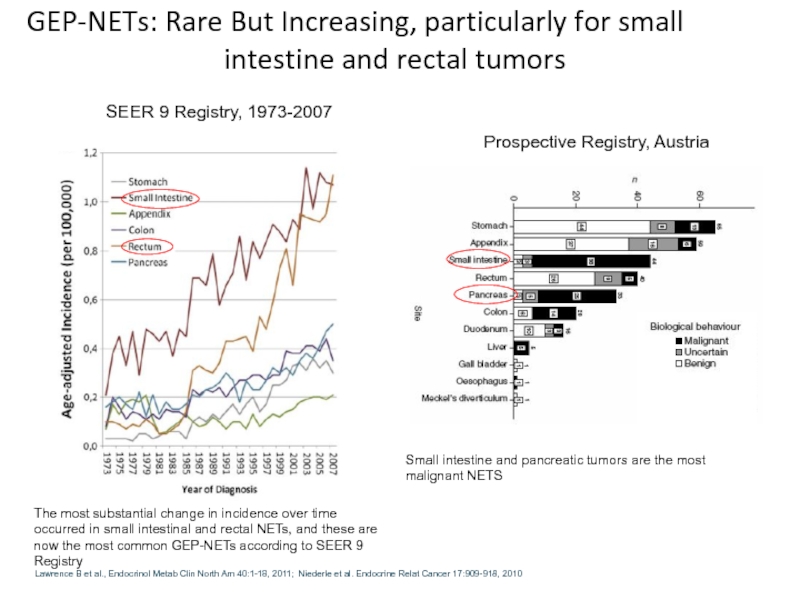
Слайд 9GEP-NETs: Rare But Increasing, particularly for small intestine and rectal tumors
Small
Lawrence B et al., Endocrinol Metab Clin North Am 40:1-18, 2011; Niederle et al. Endocrine Relat Cancer 17:909-918, 2010
Prospective Registry, Austria
SEER 9 Registry, 1973-2007
The most substantial change in incidence over time occurred in small intestinal and rectal NETs, and these are now the most common GEP-NETs according to SEER 9 Registry
Слайд 10
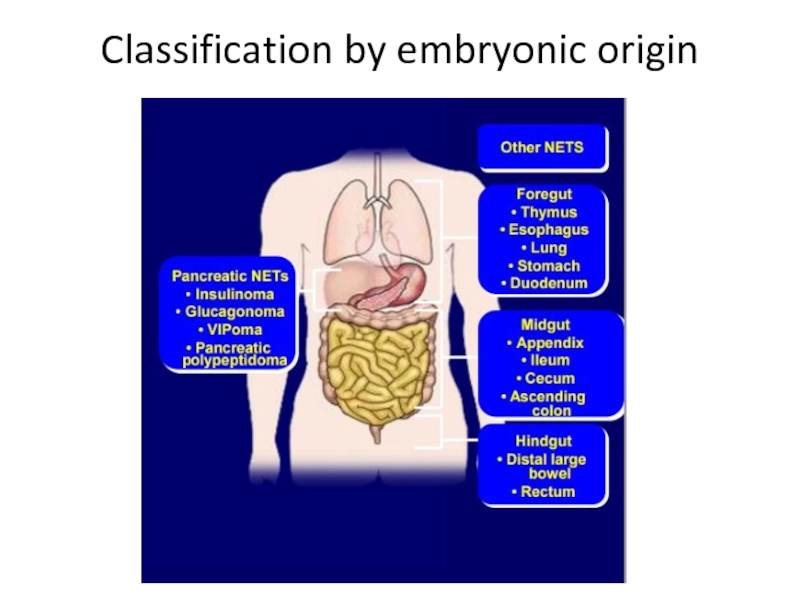
NET
Pancreatic
Non-pancreatic
Functioning
Non-functioning
Functioning
Non-functioning
40%–55% Oberg 2012
45%–60% Oberg 2012
68–80% Falconi 2006
Carcinoid syndrome
Carcinoid crisis
Carcinoid
Insulinoma
Gastrinoma
Glucagonoma
VIPoma
Zollinger Ellison’s syndrome
Pulmonary
Gastro- intestinal
Other
life-threatening complication
10–20% of patients with CS have CHD
Слайд 12NETs: An Overview
Over 60% of NETs are metastatic at the time
Most NETs are non-secretory (non-functional), but some cause symptoms
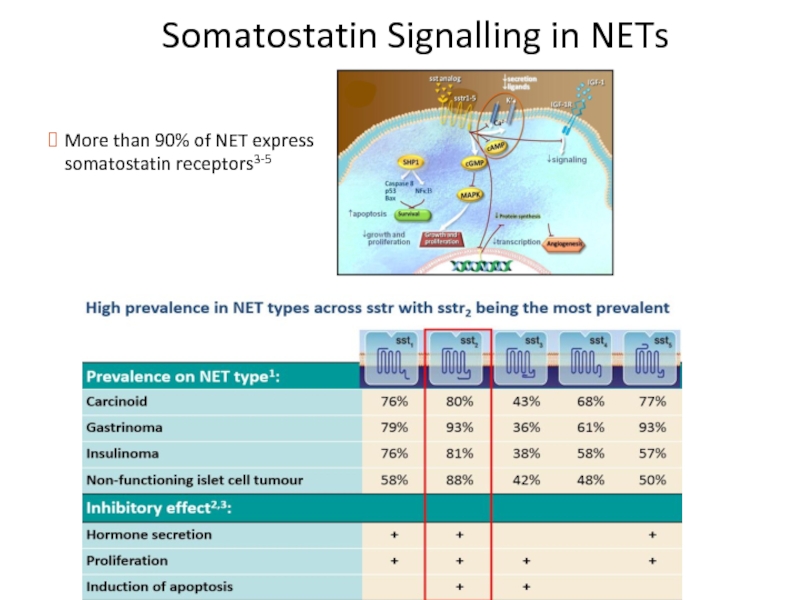
80-90% of GI NETs express somatostatin receptors (sstr 2,5)2
1. Yao JC, et al. J Clin Oncol. 2008; 26: 3063-3072; 2. Hofland LJ & Lamberts SW, Endocrine Reviews. 2003. 24(1): 28-47.
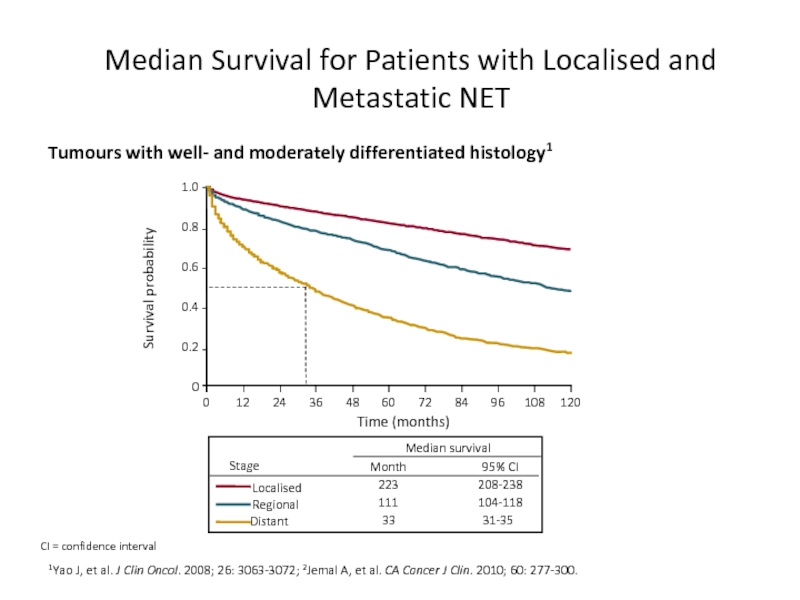
Слайд 13Median Survival for Patients with Localised and Metastatic NET
1Yao J, et
Tumours with well- and moderately differentiated histology1
CI = confidence interval
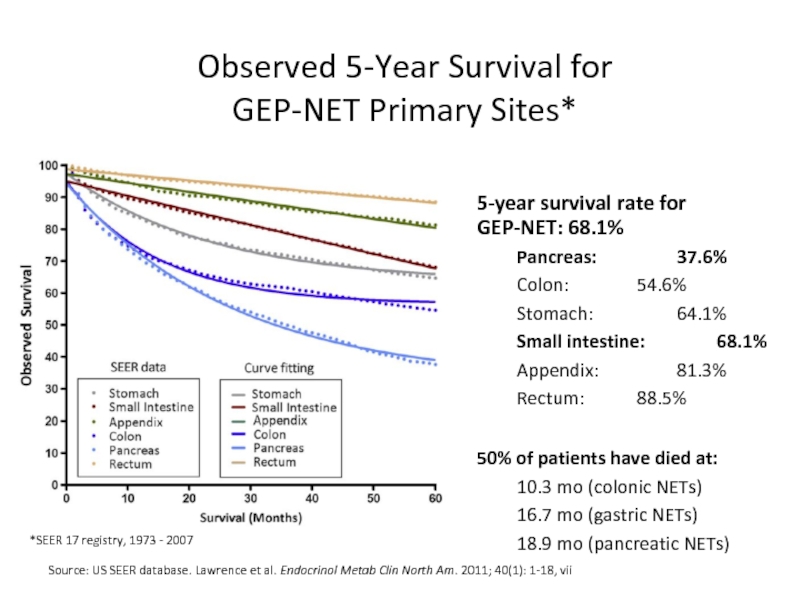
Слайд 14Observed 5-Year Survival for
GEP-NET Primary Sites*
Source: US SEER database. Lawrence
5-year survival rate for GEP-NET: 68.1%
Pancreas: 37.6%
Colon: 54.6%
Stomach: 64.1%
Small intestine: 68.1%
Appendix: 81.3%
Rectum: 88.5%
50% of patients have died at:
10.3 mo (colonic NETs)
16.7 mo (gastric NETs)
18.9 mo (pancreatic NETs)
*SEER 17 registry, 1973 - 2007
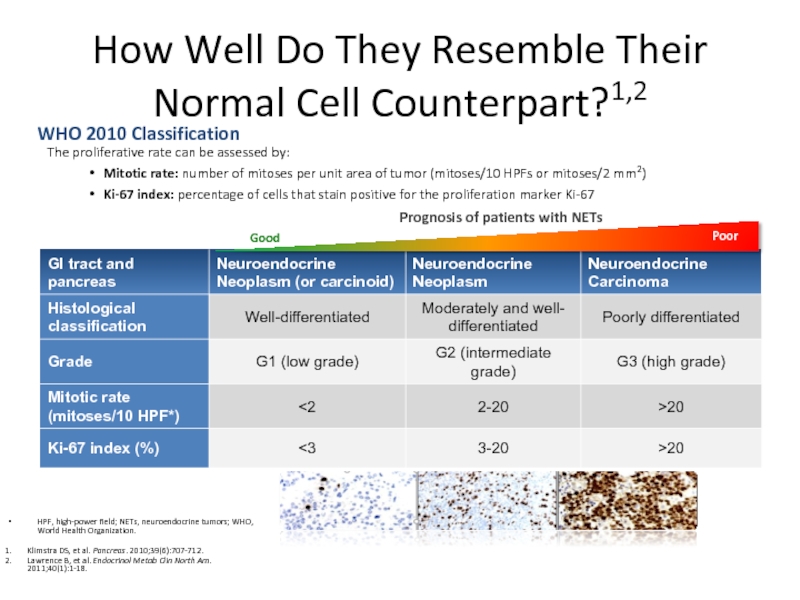
Слайд 15How Well Do They Resemble Their Normal Cell Counterpart?1,2
The proliferative
Mitotic rate: number of mitoses per unit area of tumor (mitoses/10 HPFs or mitoses/2 mm2)
Ki-67 index: percentage of cells that stain positive for the proliferation marker Ki-67
HPF, high-power field; NETs, neuroendocrine tumors; WHO, World Health Organization.
Klimstra DS, et al. Pancreas. 2010;39(6):707-712.
Lawrence B, et al. Endocrinol Metab Clin North Am. 2011;40(1):1-18.
WHO 2010 Classification
Prognosis of patients with NETs
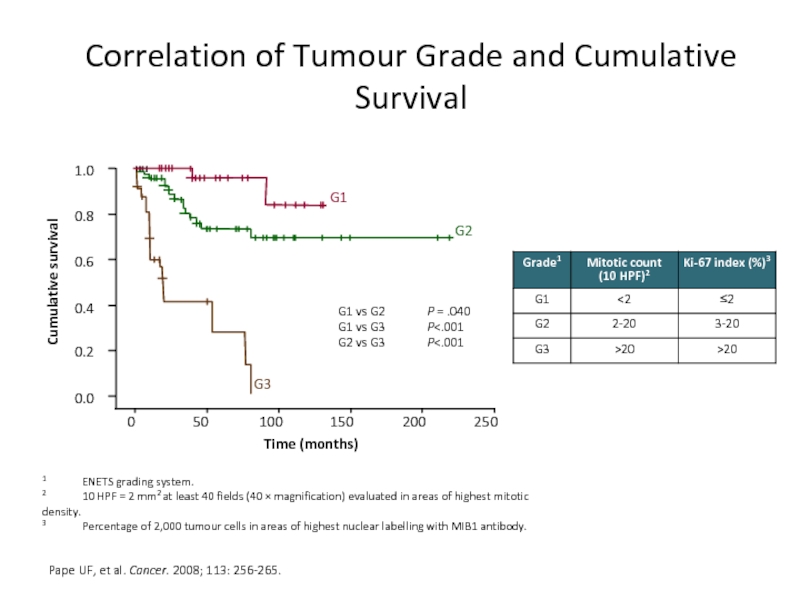
Слайд 16Correlation of Tumour Grade and Cumulative Survival
Pape UF, et al. Cancer.
1 ENETS grading system.
2 10 HPF = 2 mm2 at least 40 fields (40 × magnification) evaluated in areas of highest mitotic density.
3 Percentage of 2,000 tumour cells in areas of highest nuclear labelling with MIB1 antibody.
Слайд 17Clinical Presentation
Adapted from Vinik A, et al. Pancreas. 2009; 38(8): 876-89.
Nausea
Weight
anorexia
Слайд 18Kарциноидный синдром
10% случаев
опухоли Midgut (около 70%).
при метастазах в
не характерен для легочный карциноидов
Слайд 19Kлиника
приливы (90%),
поносы (80%),
боли в животе (40%),
поражение клапанов сердца
Характерен очень высокий уровень 5HIAA в моче
бронхообструкция (астматичнские приступы – кинины, гистамин ) –(10%)
пеллагра (5%) - понос, деменция, дерматит ( недостаточность ниацина – вит РР – при недостаточности триптофана, который расходуется карциноидной опухолью для выработки серотонина)
Лечение: аналоги соматостатина
Слайд 20Карциноидный криз
Во время операции резкий выход серотонина в кровь
Бронхообструкция, гипотензия, аритмии
Профилактика:
Слайд 21Диагностика
CT
MRI
Radiolabeled somatostatin receptor scintigraphy
DOTATATE (better)
5HIAA (5-Hydroxyindoleacetic acid - главный метаболит
CgA (PPI’s тоже повышают)
Ф: прекурсор многих активных протеинов и отвечает за генерацию секреторных гранул (например с инсулином)
Слайд 22Карциноид Тимуса
2% - 7% DS при наличии передней медиастинальной массы
Кушинг
25% ассоциированы с
Лечение- хирургическое (G1-2)
CMT (G3)
palliative RT
Слайд 23Легочный карциноид
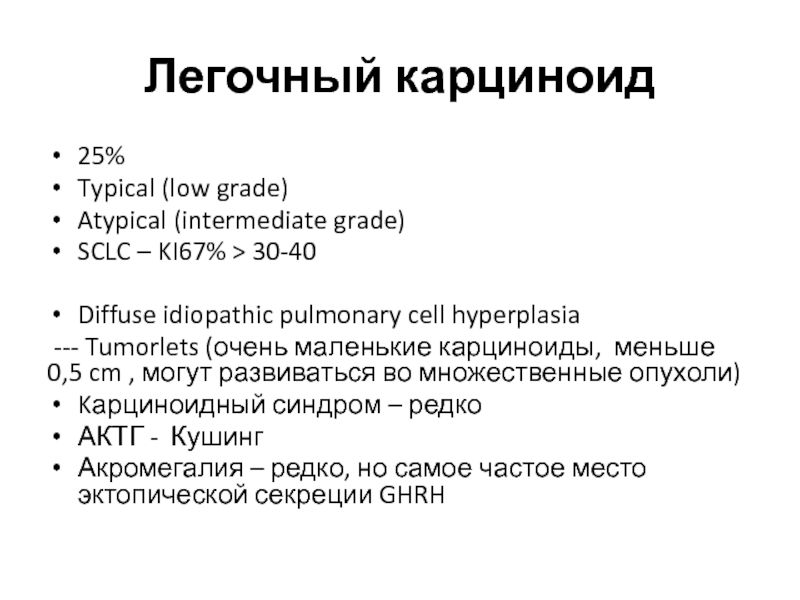
25%
Typical (low grade)
Atypical (intermediate grade)
SCLC – KI67% > 30-40
Diffuse idiopathic
--- Tumorlets (очень маленькие карциноиды, меньше 0,5 cm , могут развиваться во множественные опухоли)
Kарциноидный синдром – редко
АКТГ - Кушинг
Акромегалия – редко, но самое частое место эктопической секреции GHRH
Слайд 26Лечение карциноидных опухолей желудка
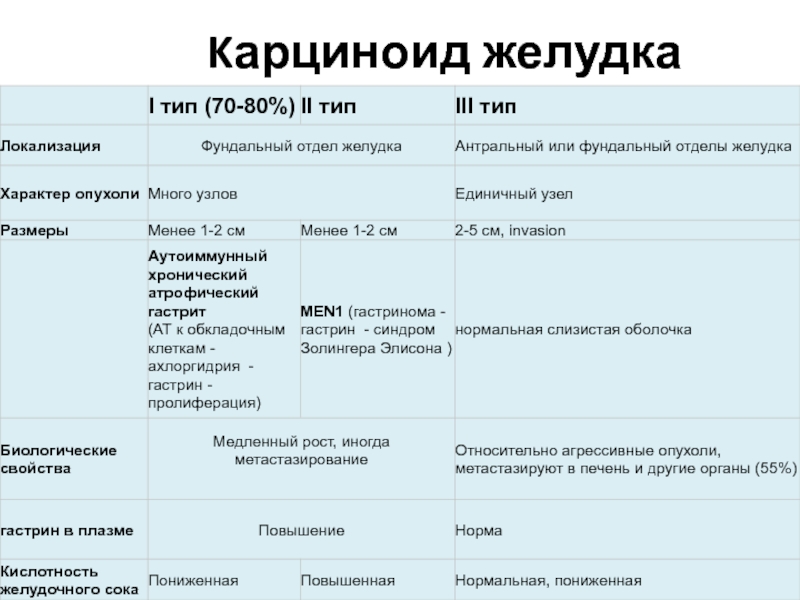
I тип
- эндоскопическое иссечение одиночных опухолей
- частичная резекция желудка при множественных карциноидах
- ? аналоги соматостатина
II и III типы
- резекция желудка
Слайд 27Kарциноид кишечника
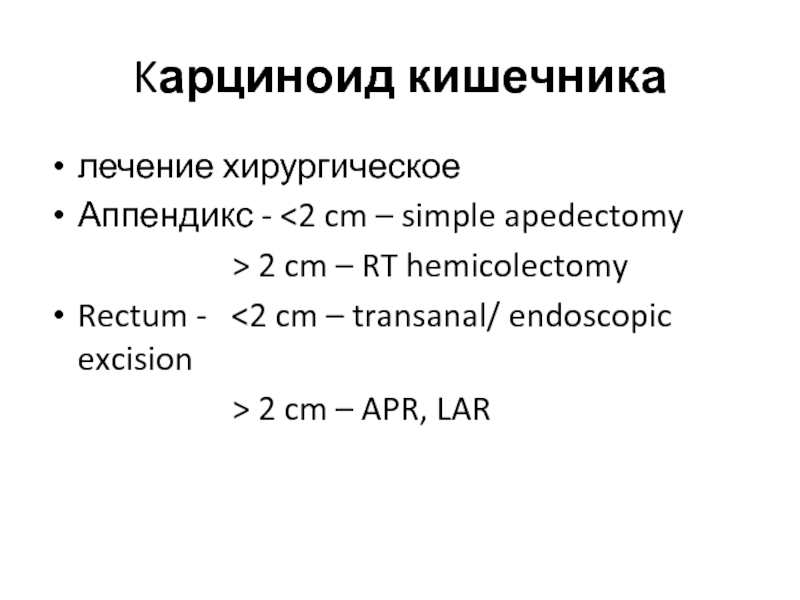
лечение хирургическое
Аппендикс -
Rectum - <2 cm – transanal/ endoscopic excision
> 2 cm – APR, LAR
Слайд 29Инсулиномы
Cамые частые
растет из бета клеток
Только 5-10% злокачественные
Основной симптом – гипогликемия, связан
4-5%имеют отношение к синдрому MEN1
Слайд 30Гастриномы (синдром Золлингера – Эллисона)
Bторое место среди эндокринных опухолей поджелудочной железы
70%
25% – в головке поджелудочной железы
5% – в других органах (желудке, тон кой кишке)
Метастазирование
Множественные пептические язвы
Слайд 31Випомы (синдром Вернера –
Моррисона)
Cекреция вазоактивного интестинального пептида (VIP)
MEN1 - 6%
Метастазирование
Поносы
Слайд 32Глюкагономы
B α - клетках поджелудочной железы
Глюкагон стимулирует распад гликогена, глюконеогенез, кетогенез,
Метастазирование
MEN1 - 15%
Клиническиe проявления :
потеря массы тела (70–80%),
диабет (75%),
дерматит (65– 80%)
стоматит (30–40%)
диарея (15–30%).
Necrolytic migratory erythema эритема, папулы и пустулы на лице, животе
Слайд 33Pancreatic polypeptidoma
Относится к нефункционирующим опухолям ПЖЖ
Как правило Дз в поздних стадиях
Клиника
Слайд 34Therapeutic Options NETs
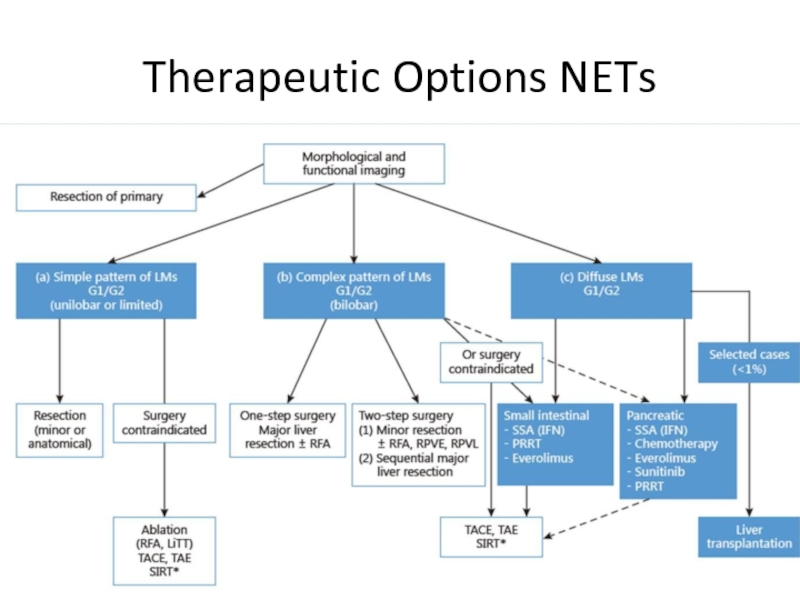
Surgery
Curative, Ablative
Debulking
Radiofrequency ablation (RFA)
Embolization/chemoembolization/radioembolization (SIRT)
Debulking surgery?
Irradiation
External
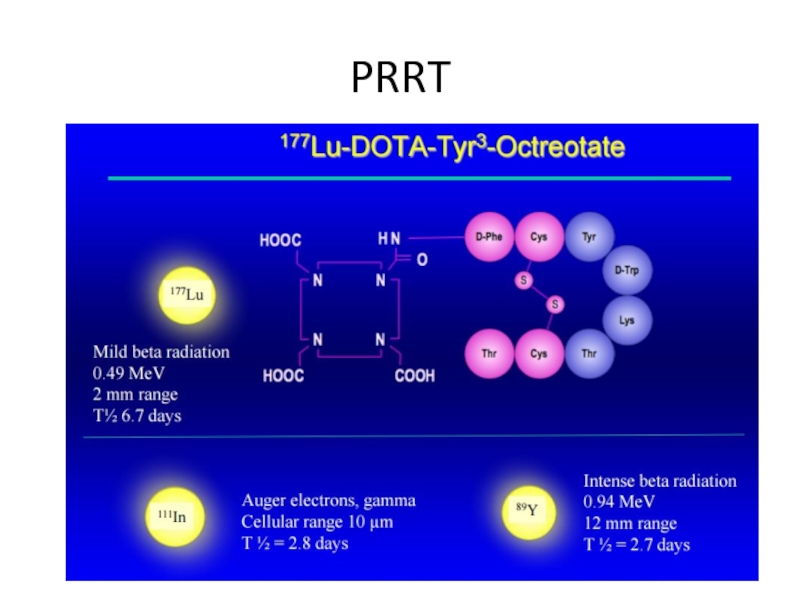
Tumor targeted, radioactive therapy: PRRT (Peptide Receptor Radionuclide Therapy) using e.g. MIBG, Y90-DOTATOC, Lu177 -DOTATATE
Medical therapy
Chemotherapy
Biological or targeted treatment:
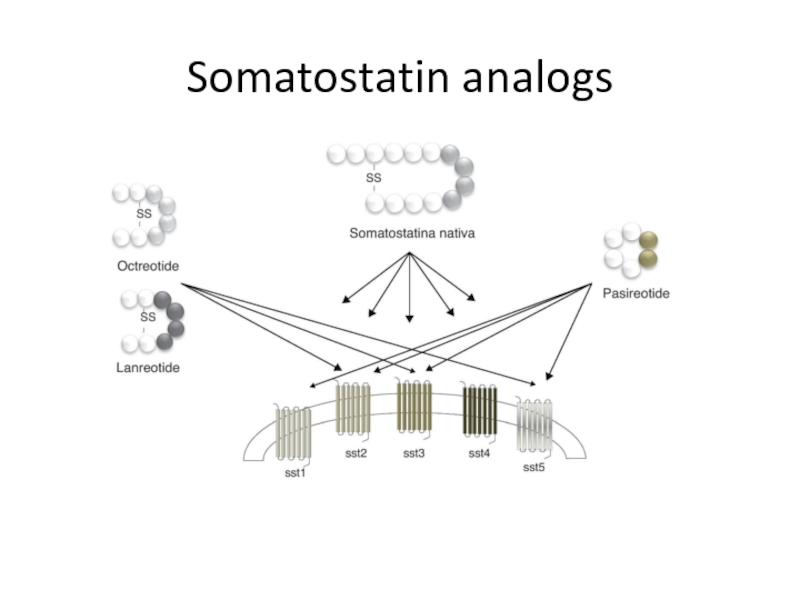
Somatostatin analogs
α-interferon
m-TOR inhibitors
VEGF R inhibitors
Other TKI’s
Courtesy K. Oberg, Uppsala
Слайд 35Общие принципы лечения локальной болезни в зависимости от GRADE
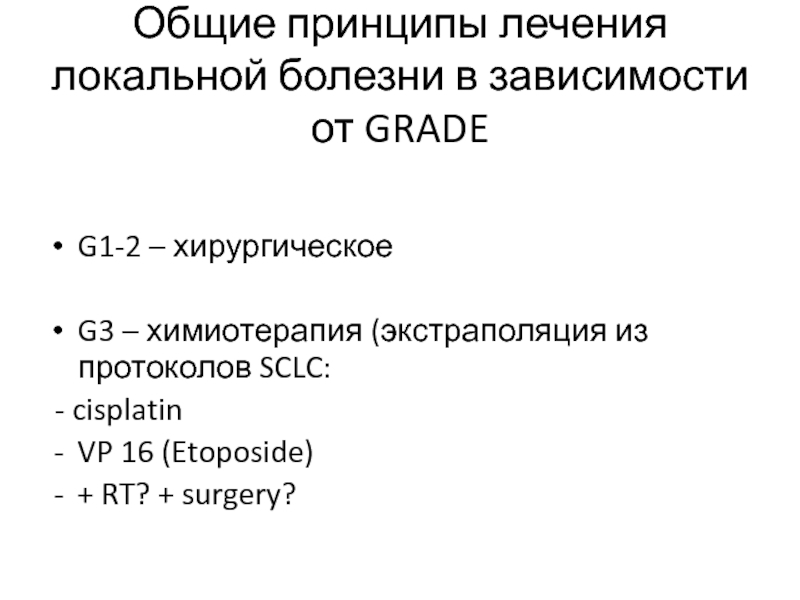
G1-2 – хирургическое
G3
- cisplatin
VP 16 (Etoposide)
+ RT? + surgery?
Слайд 40Somatostatin analogs
Octreotide LAR
N=85
TTP
Midgut
Functional 39%
Octreoscan pos 75%
Live involvement up to 10%
30 mg
Lanreotide autogel 120 mg
N=204
PFS
Midgut, hingut, pancreatic
Non-functional
Octreoscan POS 100%
Live involvement up to 10% - 52%
Progression confirmed by two scans (12-24 week interval)
Слайд 41Tolerability of Somatostatin Analogues
Shah T & Caplin ME, Best Pract Res
Original data from Arnold R, et al. Gut 1996, Öberg K, et al, Acta Oncol. 1991, Trendle MC, et al, Cancer 1997.
Diarrhoea 37.3%
Steatorrhoea 28.6%
Flatulence 28.1%
Pain at injection site 28.1%
Gallstones 17.9%
Emesis 11.5%
Hyperglycaemia 10.8%
Bradycardia 4.3%
Cholangitis 4.3%
Septicaemia < 1%
Most side effects are transient
Very good long-term tolerability
Слайд 42PASPORT Carcinoid (C2303)
ClinicalTrials.gov Identifier:NCT00690430
Primary endpoint:
Reduction in bowel movements and/or
Secondary endpoints:
Objective tumour response
Disease control rate
Quality of Life
Biochemical markers
Blinded Treatment Period
Screening
Pasireotide LAR 60mg IM every 28 days
Octreotide LAR 40mg IM every 28 days
Phase III Randomised, Double-Blind Clinical Trial to evaluate pasireotide for the treatment of carcinoid syndrome
Day 1
Week 4
Week 8
Week 12
Week 16
Week 20
Week 24
Option to continue
On extension study (2 years)
Non-responders on octreotide cross over to pasireotide (unblinded)
Primary efficacy analysis
Secondary and exploratory endpoints
a Double-blind SC injections, as required to achieve/maintain control.
Temporary dose reductions allowed, if needed for tolerability
Targeted enrollment: 216 patients
Patients:
carcinoid tumours and symptoms (diarrhoea and flushing) that are not adequately controlled by SSA
Слайд 43Trial was terminated early based on interim analysis demonstrating futility for
Wolin, EM. et al. J Clin Oncol. 2013; 31 (suppl.) Abstract #4031.
0
3
6
9
12
Time, months
15
21
27
0
Time (months)
3
6
9
12
15
21
27
56
OCT
34
10
3
0
-
-
-
52
PAS
35
22
18
9
4
3
1
Survival Probability
0.0
0.2
0.4
0.6
0.8
1.0
OCT n/N = 20/56
PAS n/N = 18/52
Censored
Kaplan-Meier median PFS
PAS: 11.8 months, 95% CI [11.0–not reached]
OCT: 6.8 months, 95% CI [5.6–not reached]
Hazard ratio = 0.46, 95% CI [0.20–0.98]
Total events = 38
P = 0.045 (log-rank test)
CI, confidence interval; OCT, octreotide LAR; PAS, pasireotide LAR; PFS, progression-free survival
Слайд 45SSA refractory Carcinoid Syndrome TELESTAR
Telotristat etiprate is a novel oral inhibitor
Two early-stage clinical studies of telotristat etiprate demonstrated a favorable safety profile and evidence of clinical activity in carcinoid syndrome2,3
Both preclinical and clinical studies suggested that telotristat etiprate is associated with minimal CNS activity1-3
Approved in the United States, in combination with SSA, for the treatment diarrhea related to carcinoid syndrome that is inadequately controlled by somatostatin analog therapy alone
1. Liu Q, Yang Q, Sun W, et al. J Pharmacol Exp Ther 2008; 325:47–55. 2. Kulke MH, O'Dorisio T, Phan A, et al. Endocr Relat Cancer 2014;21:705–714. 3. Pavel M, Horsch D, Caplin M, et al. J Clin Endocrinol Metab 2015;100:1511–1519
The recommended dose is 250 mg three times daily
Слайд 46Targeting the mTOR and Pathways in NETs
Everolimus
(m-TOR inhibitor)
Sunitinib
(Inhibition of
PDGF +
Receptors)
Слайд 48Sunitinib Phase III Trial:
Raymond E, et al. N Engl J
86
39
19
4
0
0
Sunitinib
85
28
7
2
1
0
Placebo
Subjects at risk, n
HR, 0.418
95% CI, 0.26-0.66
P = 0.000118*
*P-value might be misleading due to multiple early looks
Sunitinib, Median 11.4 months
Placebo,
Median 5.5 months
Probability of Progression-free
Survival (%)
Months since Randomization
Well differentiated advanced pNET patients
(N = 171 enrolled / 340 planned)
(Somatostatin analogues were permitted)
ORR 9.3 vs 0%
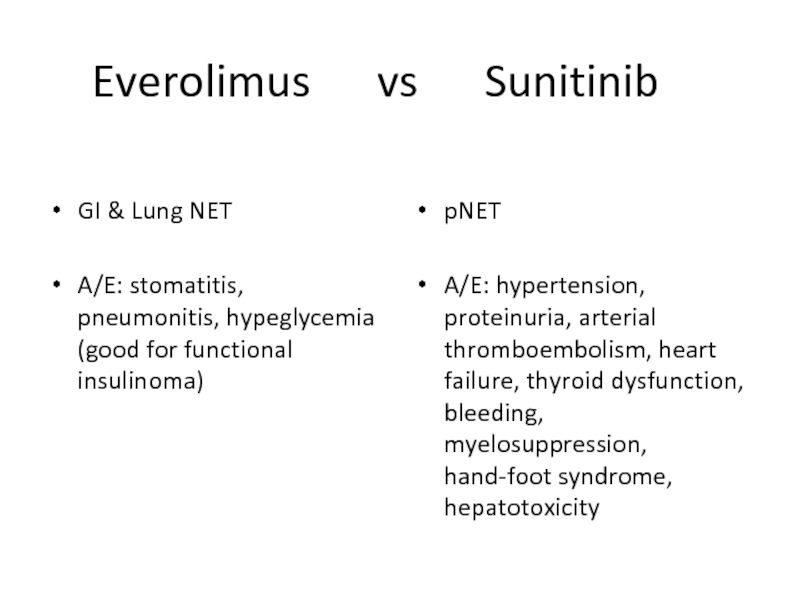
Слайд 49Everolimus vs Sunitinib
GI & Lung NET
A/E: stomatitis,
pNET
A/E: hypertension, proteinuria, arterial thromboembolism, heart failure, thyroid dysfunction, bleeding, myelosuppression, hand-foot syndrome, hepatotoxicity
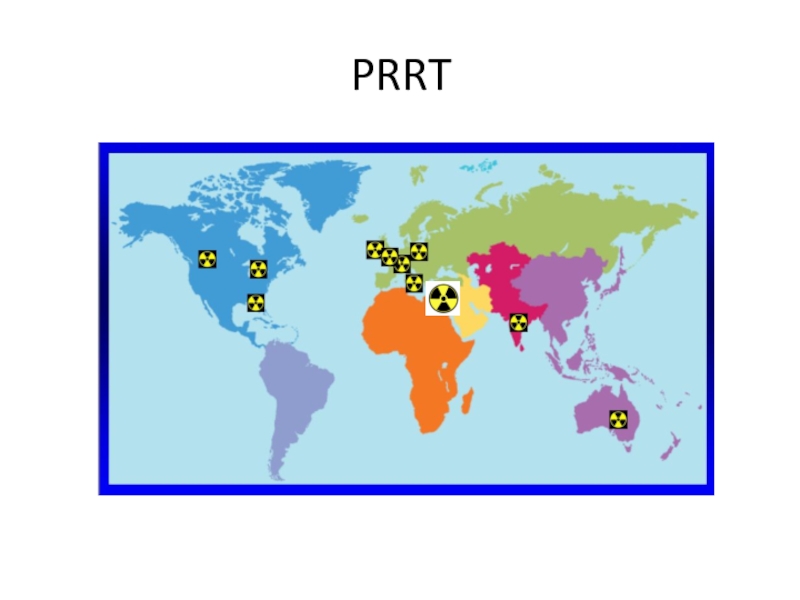
Слайд 52Studies showed efficacy in tumor shrinkage, symptoms relief, QOL and possible
However, there are no RCT and evidence comes from individual cohort studies
Survival with 177L can be estimated at 40 – 72 months after diagnosis and 12 to 21 months from therapy start
Short-term tolerance is good but long-term toxicity can be severe (kidney or bone marrow impairment)
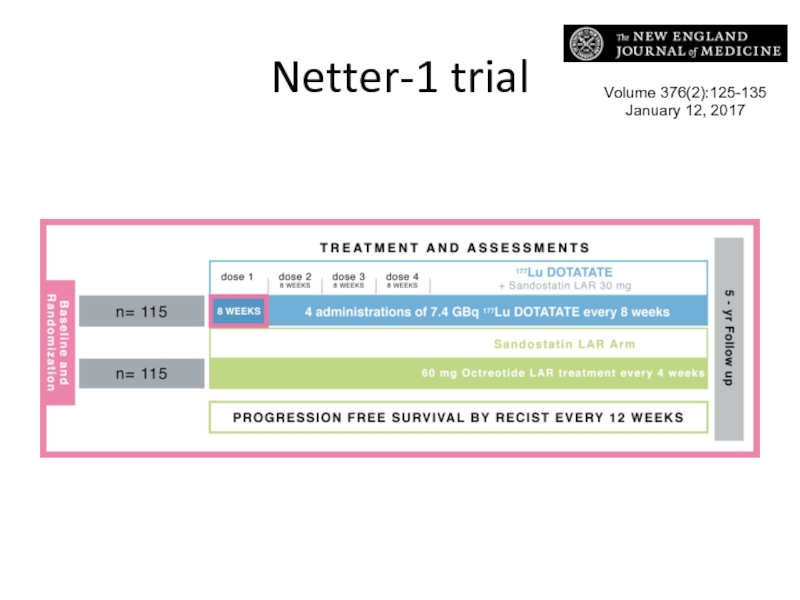
Слайд 54PFS & OS
In patients with midgut neuroendocrine tumors that progressed during
The median PFS has not yet been reached in the 177Lu-DOTATATE group but was 8.4 months on high-dose octreotide.
In the planned interim analysis of overall survival, 14 deaths occurred in the 177Lu-Dotatate group and 26 in the control group (P=0.004).
Слайд 55Chemotherapy in NET
Well-differentiated NET do not exhibit high sensitivity to chemotherapy
of their low mitotic rates
of high levels of anti-apoptotic protein bcl-2
of increased expression of the multi-drug resistant (MDR) gene
Well-differentiated midgut NETs show low response rates (10-15%) to traditional chemotherapeutic agents
streptozotocin in combination with 5-fluorouracil (FU) or doxorubicin
Low-to-moderately differentiated pNET trials with streptozotocin plus 5FU/doxorubicin or dacarbazine showed objective response rates (RR) of 39% and 33%, respectively, and an improved overall survival (OS)
Reviewed ini Demirkan, B. & Eriksson, B. Turk J Gastroenterol 2012; 23 (5): 427-437
Слайд 57Temozolomide
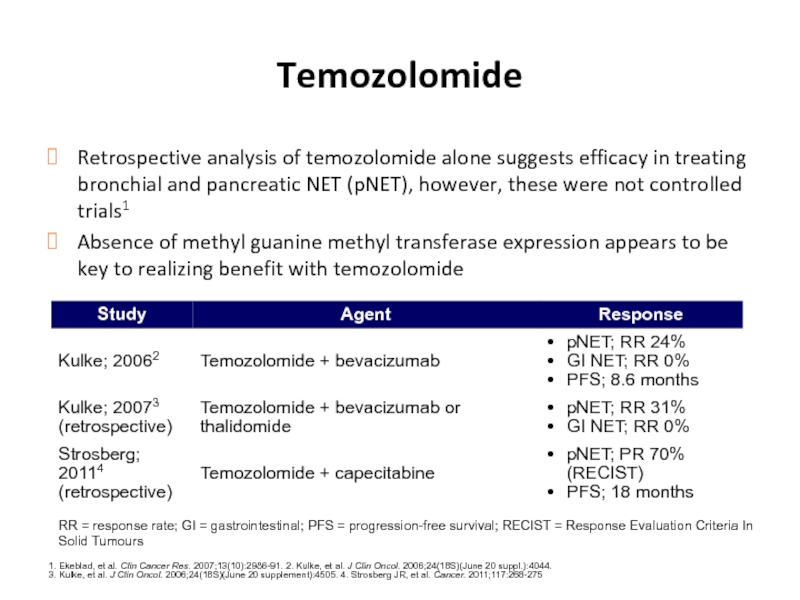
Retrospective analysis of temozolomide alone suggests efficacy in treating bronchial and
Absence of methyl guanine methyl transferase expression appears to be key to realizing benefit with temozolomide
1. Ekeblad, et al. Clin Cancer Res. 2007;13(10):2986-91. 2. Kulke, et al. J Clin Oncol. 2006;24(18S)(June 20 suppl.):4044.
3. Kulke, et al. J Clin Oncol. 2006;24(18S)(June 20 supplement):4505. 4. Strosberg JR, et al. Cancer. 2011;117:268-275
RR = response rate; GI = gastrointestinal; PFS = progression-free survival; RECIST = Response Evaluation Criteria In Solid Tumours

