- Главная
- Разное
- Дизайн
- Бизнес и предпринимательство
- Аналитика
- Образование
- Развлечения
- Красота и здоровье
- Финансы
- Государство
- Путешествия
- Спорт
- Недвижимость
- Армия
- Графика
- Культурология
- Еда и кулинария
- Лингвистика
- Английский язык
- Астрономия
- Алгебра
- Биология
- География
- Детские презентации
- Информатика
- История
- Литература
- Маркетинг
- Математика
- Медицина
- Менеджмент
- Музыка
- МХК
- Немецкий язык
- ОБЖ
- Обществознание
- Окружающий мир
- Педагогика
- Русский язык
- Технология
- Физика
- Философия
- Химия
- Шаблоны, картинки для презентаций
- Экология
- Экономика
- Юриспруденция
Health insurance презентация
Содержание
- 1. Health insurance
- 2. Two Comments First of two comments:
- 3. Two Comments Second comment: Most of us
- 4. “The figures, released early Tuesday by the
- 5. “Young adults were less likely than any
- 6. Mostly adults, not children – half are
- 7. Do the uninsured receive necessary health care?
- 8. Often No… Compared to the Insured Population,
- 9. The Uninsured… Are not known to be
- 10. Health Insurance and the Consumer Role Consumers
- 11. Key Definitions Moral hazard Health insurance affects
- 12. The Demand for Health Insurance Why do
- 13. What is Risk Aversion? A simple
- 14. Private Market Insurance: A Simple Example
- 15. Demand for Health Insurance Keys Presence of
- 16. Health Insurance Main Types Fee-for-service (indemnity) Managed
- 17. Insurance: Declining Block Pricing (Out-of-Pocket Spending)
- 18. Pricing Blocks: Deductibles, Copays and Limits
- 19. Question Why do we observe deductibles, co-pays, limits, and exclusions?
- 20. Moral Hazard and Demand
- 21. Practice Exercise What is the relationship between
- 22. Question: If you designed a health care
- 23. Patterns of Insurance Coverage The losses that
- 24. Question You’re an insurance broker. Suppose
- 25. You be the benefit consultant Harvard University
- 26. Budget Problem 1994, Harvard University was facing
- 27. 1995, Harvard decide to contribute the same
- 28. Changes in Employee Premiums
- 29. Enrollment in the more generous, more expensive
- 30. Enrollment in the more generous, more expensive
- 31. Final Results: Due to decreased enrollment, premiums
- 32. Plan Enrollment
- 33. A Game: Pick One of the Following
- 34. To Better Understand These Choices, It Helps
- 36. Adverse effects of adverse selection Start with
- 37. Percentage of Uninsured Workers Ages 18-64, by Firm Size (1997)
- 38. “Small-business profits are getting pinched because of
- 40. How to Price Insurance Policies? Premium
- 41. Typical Loading Fees by Group Size As a Percent of Benefits (Phelps, p. 343)
- 42. Question: Why is Small Group Health Insurance
- 43. Do People Choose to Die? Actuaries have
- 44. Possible Solutions to the Adverse Selection Problem?
- 45. Possible Solutions to the Moral Hazard Problem?

Слайд 2Two Comments
First of two comments:
From Princeton Economist Uwe Reinhardt: “Why

Слайд 3Two Comments
Second comment: Most of us are not aware of the
Self pay for a visit to a hospital ER, say for a broken leg.
Employers pay on average 11% of salary for health benefits. Roughly equals $2/hr.
FICA-M
A TV in most states, a pay check in Delaware,…

Слайд 4“The figures, released early Tuesday by the U.S. Census Bureau, show
The 5.8% rise in the uninsured resulted from a decline in the percentage of people covered by employer-based insurance -- 61.3% last year, down from 62.6% the year before. That deterioration, economists say, reflected increases in unemployment and the rise in health-care costs, which prompted some employers to drop coverage.”
Number of Americans Who Lack
Health-Care Coverage Is Rising:
Census Bureau Counts 43.6 Million, WSJ 9/30/03

Слайд 5“Young adults were less likely than any other age group to

Слайд 6Mostly adults, not children – half are childless adults.
What age group?
Poor and near-poor – 60% have incomes above federal poverty level
Workers and family members – 80% in families with at least 1 worker
Unskilled laborers, service workers.
Uwe Reinhardt, “working stiffs”
Who Are the Uninsured?


Слайд 8Often No… Compared to the Insured Population, the Uninsured...
Have higher rates
Are less likely to receive care that they feel they need
Have more preventable hospitalizations
Have shorter hospital stays for the same conditions
Are hospitalized sicker and have poorer health outcomes (including death)…

Слайд 9The Uninsured…
Are not known to be a sicker or higher-cost population.
Pay higher medical fees. (NYT, 4/2/01) “A New York gynecologist says he gets $25 for a routine exam for a woman insured by group health insurance and charges $175 for the same exam for a woman without insurance.”…
“The care of the poor once was supported by the wealthy and the insured, but now the opposite is happening.”

Слайд 10Health Insurance and the Consumer Role
Consumers demand health insurance and often
Two key issues that can lead to market failure:
Moral hazard
Adverse selection

Слайд 11Key Definitions
Moral hazard Health insurance affects consumer demand for health care
Adverse selection When given a choice, people who choose to purchase insurance are likely to be a group with higher than average losses. (Also applies to a choice between low-option and high-option plans.)

Слайд 12The Demand for Health Insurance
Why do consumers value health insurance?
Illness, injury
Hospitalizations, serious injury, and rehabilitation and other advanced modern treatments can be very expensive
Most households are averse to risk
What is risk aversion

Слайд 13What is Risk Aversion?
A simple test to see if you
Which would you select?
Your pay check, OR
Double your pay check for correctly picking one coin flip.
Equal expected values; most of us are risk adverse and select the “certain” $500 option.
Risk aversion - the degree to which a certain income is preferred to a risky alternative with the same expected income.

Слайд 14Private Market Insurance: A Simple Example
Start with 100 middle-aged executives
Suppose we can predict that one was going to have a heart attack, requiring a $50k CABG procedure.
But, we don’t know who will be the unlucky one.
Form a club with each exec putting in $500.
“Actuarial fair premium” = 1/100 X $50,000
Would executives be willing to pay a 10% mark-up (loading fee) just to get their premium money back (collectively) as a benefit payment?

Слайд 15Demand for Health Insurance Keys
Presence of aversion makes consumers willing to
Insurance companies specialize in pricing risks, not in taking risks.
Lesson from the theory of insurance: the losses that are insured are: large, infrequent, random, and not associated with a large moral hazard.

Слайд 16Health Insurance
Main Types
Fee-for-service (indemnity)
Managed care (pre-paid)
Key Terms
Deductible
Copay/Coinsurance
Stop Loss
Limit
Managed care (pre-paid)Key TermsDeductibleCopay/CoinsuranceStop Loss Limit")
")


Слайд 21Practice Exercise
What is the relationship between price elasticity of demand and

Слайд 22Question: If you designed a health care plan…
Hospital Care
Surgical & in-hosp
Outpatient doctor
Dental exams/cleaning
Mental health
Over the counter drugs
Flu shots

Слайд 23Patterns of Insurance Coverage
The losses that are insured are: large, infrequent,

Слайд 24Question
You’re an insurance broker.
Suppose the average health expenditure for an
To make a quick $4000, would you accept $10,000 to provide health insurance coverage for one adult?
If not, what’s the minimum premium you’d accept?


Слайд 26Budget Problem
1994, Harvard University was facing a substantial deficit in the
Offered both HMO plans and a more expensive PPO health insurance plan.
Harvard generously subsidized the more expensive, “high-option” PPO plans for employees.
Needed to reduce employee benefit costs…

Слайд 271995, Harvard decide to contribute the same amount to employee plans
Employee contributions increased for both the HMO and PPO plans, but more severely in the more expensive PPO plans.
Harvard’s Strategy


Слайд 29Enrollment in the more generous, more expensive PPO plans decreased.
What would
Employees’ Response:

Слайд 30Enrollment in the more generous, more expensive PPO plans decreased.
What would
Those employees who switched tended to be younger and had spent less on medical care the previous year.
Employees’ Response:

Слайд 31Final Results:
Due to decreased enrollment, premiums for the high option PPO
More employees were (voluntarily) “pushed out” of the expensive PPO plans =>
By 1997, the PPO plan was discontinued, completing the adverse selection “death spiral” in just three years.


Слайд 33A Game: Pick One of the Following 3 Opportunities:
C1: $350 paid
C2: $1000 for correctly picking one coin flip
C3: Flip the coin 1000 times. Your take equals: %heads X $1000.

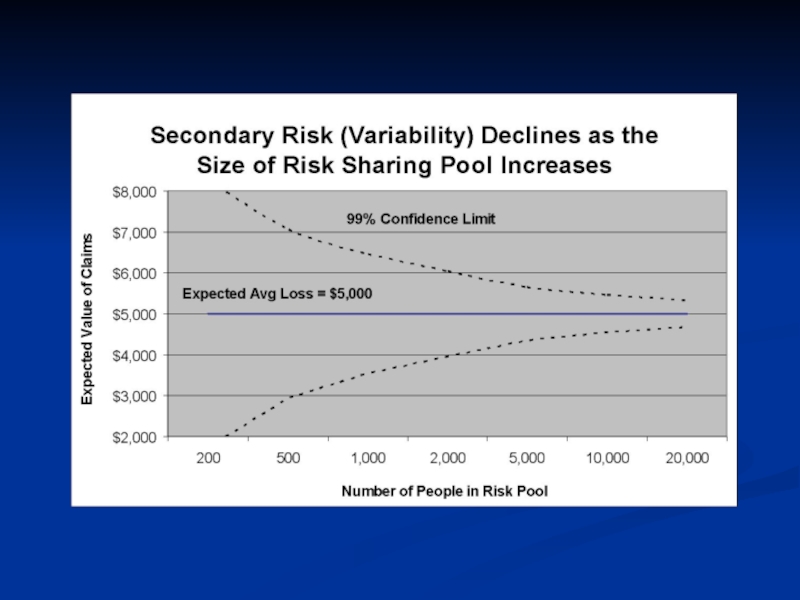
Слайд 34To Better Understand These Choices, It Helps to Know Your Risks
Group insurance reduces “secondary risk.”
Two kinds of risk . . .
Primary risk: calculated odds that a bad event will occur ($6000 expected value of health costs for an adult.)
Secondary risk: chance that the actual payout doesn’t equal the calculated expected value. (The calculation proves to be wrong.) Larger numbers reduce secondary risk.

Слайд 36Adverse effects of adverse selection
Start with a community-rated, self-pay health plan
Community
Person “A” with E(B) = $600
“B” E(B) = $2000
“C” E(B) = $4000
“D” E(B) = $6000
Marginal analysis: E(B) vs E(C)
Decision of healthier enrollees “A” and “B”?
Avg. cost per enrollee increases.
Premiums increase => “C” drops out.
…and this can create a “killer price spiral”
Severe adverse selection can set in motion price spirals that theoretically can cripple or destroy insurance markets.

")
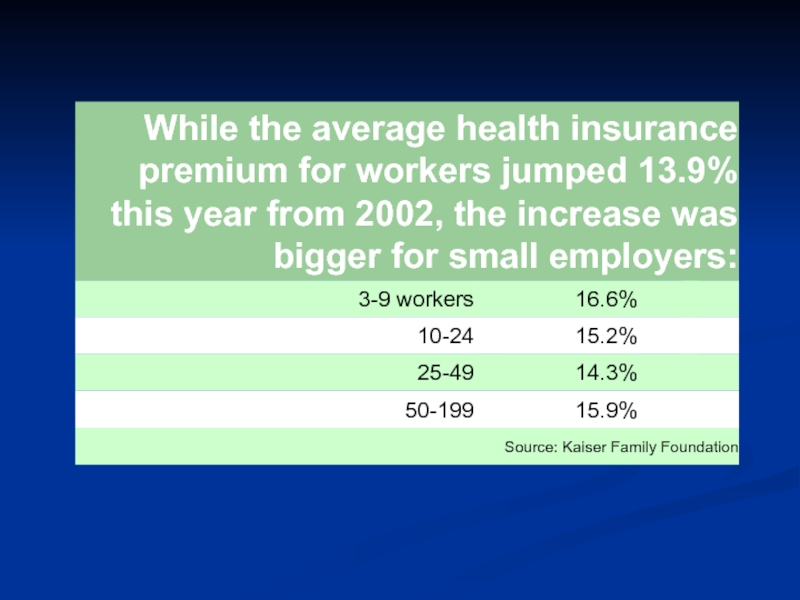
Слайд 38“Small-business profits are getting pinched because of price increases for employee
Rising health costs take bite out of small biz – USA Today 10/5/03

Слайд 40How to Price Insurance Policies?
Premium = f ( Expected value
Loading cost: administrative and other costs associated with underwriting insurance policies.
Loading costs = (risk premium + administrative costs + marketing costs + profits)
Loading costs = “price” of insurance

")
Слайд 42Question: Why is Small Group Health Insurance So Expensive?
Per capita
Loading costs = (risk premium + administrative costs + marketing costs + profits)
Small group purchasers have less bargaining power.
Adverse selection.

Слайд 43Do People Choose to Die?
Actuaries have found that statistically people who
Is this a “moral hazard” or an “adverse selection” problem?

Слайд 44Possible Solutions to the Adverse Selection Problem?
Waiting periods
Preexisting condition exclusions
Risk rating (underwriting)
Insurance that precludes individual selection according to subscribers’ perceptions of their own risk (Universal health insurance, employment-based insurance)
 Insurance")
Слайд 45Possible Solutions to the Moral Hazard Problem?
(Higher) co-payments
(Higher) deductibles
Utilization review
Since
 co-payments(Higher) deductibles Utilization reviewSince size of moral hazard")