- Главная
- Разное
- Дизайн
- Бизнес и предпринимательство
- Аналитика
- Образование
- Развлечения
- Красота и здоровье
- Финансы
- Государство
- Путешествия
- Спорт
- Недвижимость
- Армия
- Графика
- Культурология
- Еда и кулинария
- Лингвистика
- Английский язык
- Астрономия
- Алгебра
- Биология
- География
- Детские презентации
- Информатика
- История
- Литература
- Маркетинг
- Математика
- Медицина
- Менеджмент
- Музыка
- МХК
- Немецкий язык
- ОБЖ
- Обществознание
- Окружающий мир
- Педагогика
- Русский язык
- Технология
- Физика
- Философия
- Химия
- Шаблоны, картинки для презентаций
- Экология
- Экономика
- Юриспруденция
Facility Level Reporting Training Presentations_UNICEF HMIS презентация
Содержание
- 1. Facility Level Reporting Training Presentations_UNICEF HMIS
- 2. Day 1 Understanding your role in HMIS,
- 3. Introductions, Expectations, and ground rules
- 4. Please state: Your
- 5. Training Objectives, Design, and Agenda
- 6. Training Objectives To assist participants in understanding
- 7. Workshop Design You will interact with all
- 8. Agenda Day 1: Understanding your role in
- 9. HMIS Overview and Your Place In It Understanding the system
- 10. Understanding the System To understand data collection
- 11. Patient Level The goal of the health
- 12. Needs at each Level What does each
- 13. Putting it together National: Results
- 14. Understanding the Connectedness Every critical item in
- 15. ? We are now going to connect
- 16. Where do information systems come in? These
- 17. Where do information systems come in?
- 18. Where does the HMIS come in?
- 19. This whole thing is the Health Management
- 20. …..and this is where you fit in
- 21. Current reporting challenges Discussion
- 22. Facility Level Reporting
- 23. How will it work? HMIS Currently: Facility Level Reporting:
- 24. Theory of Change By having you (facility
- 25. Key HMIS indicators Understanding YOUR data
- 26. Maternal and Child Health Fully immunized children
- 27. HIV/AIDS PMTCT Virology/Serology General counselling and Testing Current in ART ART retention VMMC
- 28. Tuberculosis Notifications for TB Percentage of Retreatment
- 29. Sexually Transmitted Infections STI cases STI+ tested for HIV
- 30. Adolescent/Reproductive Health 1st ANC
- 31. Malaria Incidence/1000 Cases under 5 Cases over 5
- 32. Your data collection tools Understanding Facility Registers (DHIO to present)
- 33. Facility Registers These are used to collect
- 34. Tally Sheets These “tally” up totals from
- 35. HIA1 and HIA2 Filled in at the
- 36. HIA4 (Where applicable) Filled in at the
- 37. Exercise Think about registers you have problems
- 38. Tips for making the collection and troubleshooting
- 39. Data Quality
- 40. Generating Quality Data Before submitting reports, data
- 41. What is wrong with this data?
- 42. Exercise Use the registers and tally sheets
- 43. Day 2 Into DHIS2 -- creating charts
- 44. What is DHIS2? District Health Information System
- 45. What does it do?
- 46. The DHIS2 Model
- 47. Pivot Tables Module:
- 48. A pivot table is …
- 49. A pivot table is …
- 50. Open Module Apps Select ‘Pivot Table’ from dropdown
- 51. Default Pivot Table
- 52. Data Selection Define DE
- 53. WHAT Indicator Data Elements Reporting Rates WHEN
- 54. Pivot Table Parameters: When Relative Months
- 55. Pivot Table Parameters: Where Organization Unit
- 56. Harmony RHC
- 57. WHEN: Monthly→ September 2015 WHERE: All subunits
- 58. Result Data Element: ANC
- 59. Pivoting / Changing layout Select ‘Layout’ Drag-n-drop orgunits to rows
- 60. Pivoting / Changing layout Select ‘Layout’ Drag-n-drop orgunits to column
- 61. Options Small modifications in formatting Show totals Show sub-totals
- 62. Worked Example…
- 63. Not very intuitive to read. PIVOT!!! Maternal
- 64. Move Orgunits to Column (below Data) Move Orgunits to Column (above Data) Pivoted
- 65. Pivoted Move Orgunits to Row
- 66. Download Click download Excel (XLS) Can
- 67. Manage Favourites Add New Open saved
- 68. Exercise Sheet Work through each example on
- 69. Charts Module:
- 70. Overview Charts, graphs, and tables
- 71. Overview cont’d In educational settings,
- 72. Six things conveyed by charts & graphs
- 73. Reasons for creating charts and graphs
- 74. Charting considerations Type of data Purpose
- 75. Open Module Apps Select ‘Data Visualizer’ from dropdown
- 76. Default Data Visualizer
- 77. Chart type Select from Column Stacked
- 78. Chart parameters Data: Indicators Date
- 79. Example Chipata District’s 1st ANC coverage over
- 81. Example Chipata’s 1st ANC coverage
- 86. Chipata’s 1 ANC
- 90. Options Small modifications in formatting Change Title Show trendlines
- 91. Worked example …
- 92. Open a saved chart Go to: Favorites
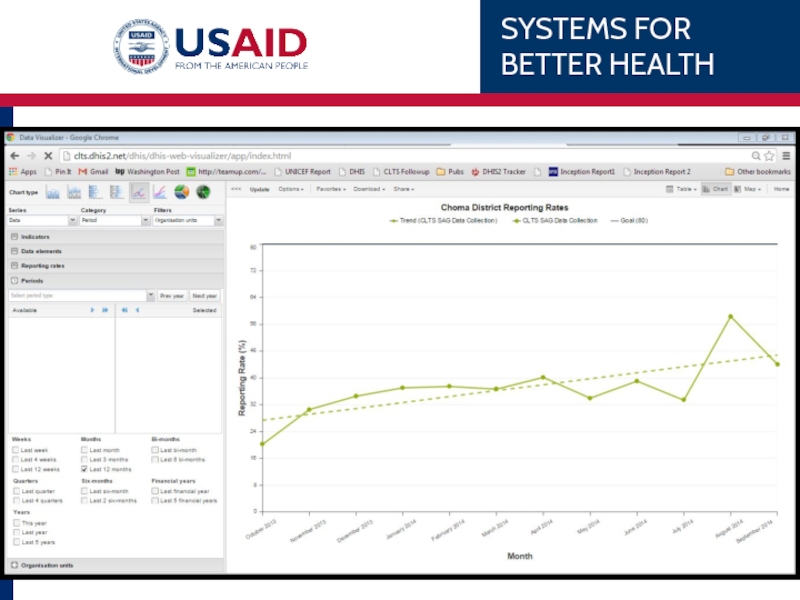
- 93. Choma Reporting Rates Line Chart Series
- 95. Download charts Two options available Standard image
- 96. Manage favorites Rename Overwrite Share Delete
- 97. Exercise Sheet Work through each example
- 98. Data Entry Module
- 99. When to do data entry Entering
- 100. WARNING! Data entry is live No
- 101. HOW Apps > Data Entry
- 102. HOW Select facility Select Form Select Period Enter Data
- 103. Worked Examples Use the tally sheets you
- 104. Group Discussion Feedback Closing
- 105. ZIKOMO! THANK YOU

Слайд 2Day 1
Understanding your role in HMIS, key indicators, understanding your data


Слайд 4 Please state:
Your name
Facility and role
One expectation
The best thing about your job


Слайд 6Training Objectives
To assist participants in understanding their data collection tools better
To

Слайд 7Workshop Design
You will interact with all your data collection tools and

Слайд 8Agenda
Day 1: Understanding your role in HMIS, key indicators, understanding your
Day 2 DHIS2 modules: Charts, Data Entry, and practicing Data Entry


Слайд 10Understanding the System
To understand data collection you have to first understand
People, roles, places, commodities, information systems, policy, training, equipment, etc.
A health system is divided into levels: patient, facility, district, national and sometimes donor.
The health systems primary purpose is to provide care and treatment to people
? We are now going to map out the health system to better understand all of the data requirements. We will start at the lowest, most important level. . .the patient level

Слайд 11Patient Level
The goal of the health system is to ensure that
The goal of the HMIS is to provide the health system with information so we can make sure that happens.
The health system must provide the following patient health cycle:

Слайд 12Needs at each Level
What does each level need to have to
Human Resources
Drugs and Supplies
Medical Equipment
Standard Operating Procedures (SOP)
Facilities
Results
Training
Protocols
Planning
Finance
Management
Results
Results
Policy
Finance
Goals/Targets

Слайд 13Putting it together
National: Results Policy
District: Results Finance Training Protocols Management Protocols
Facility: Results Medical Stores HR Facility Equipment SOP

Слайд 14Understanding the Connectedness
Every critical item in the patient cycle does not
For Example: We cannot treat patients without medicine at the facility and the facility cannot have medicine without district medical stores.
Another example is we cannot have trained clinicians without district protocols which we cannot have without national policy.

Слайд 15? We are now going to connect dependent items between levels
National: Results Policy Etc.
District: Finance Training Protocols Results.
Facility: Facilities HR Medical Stores Results Etc.

Слайд 16Where do information systems come in?
These information systems allow people who
These lines represent the flow of information so decisions and policies can be made, so commodities can be sent, so doctors can be trained, etc.

Слайд 17Where do information systems come in?
National:
District: Finance Training Protocols Results
Facility: Facilities HR Medical Stores Results Etc.
iHRS
IDSR
LMIS
iHRS
Access
IDSR
Facility Registry

Слайд 18Where does the HMIS come in?
National:
District: Finance Training Protocols Results.
Facility: Facilities HR Medical Stores Results Etc.
iHRS
IDSR
LMIS
iHRS
Access
IDSR
Facility Registry

Слайд 19This whole thing is the Health Management Information System
National:
District: Finance Training Protocols Results.
Facility: Facilities HR Medical Stores Results Etc.
iHRS
IDSR
LMIS
iHRS
Access
IDSR
Facility Registry

Слайд 20…..and this is where you fit in data-wise
National:
District: Finance Training Protocols Results.
Facility: Facilities HR Medical Stores Results Etc.
iHRS
IDSR
LMIS
iHRS
Access
IDSR
Patient Monitoring


Слайд 24Theory of Change
By having you (facility staff) directly enter data into
Data Timeliness
Data Quality
Data Analysis
 directly enter data into the HMIS (DHIS2), we")

Слайд 26Maternal and Child Health
Fully immunized children
Underweight children
1st ANC visit
Institutional Deliveries
Family planning

Слайд 27HIV/AIDS
PMTCT
Virology/Serology
General counselling and Testing
Current in ART
ART retention
VMMC

Слайд 28Tuberculosis
Notifications for TB
Percentage of Retreatment cases
Cure Rate
Mortality Rate
Commenced on ARVs
Commenced


")
Слайд 33Facility Registers
These are used to collect raw data
Individual data elements are
This is where you aggregate monthly totals from
Now…
Let’s discuss all registers you use at the facility

Слайд 34Tally Sheets
These “tally” up totals from registers
Consolidate register data into a
Data from these goes into HIA1, HIA2, and for the community registers, HIA4


Слайд 36HIA4 (Where applicable)
Filled in at the end of the month
Sent to
Filled in at the end of the monthSent to facility for entry into DHIS2")
Слайд 37Exercise
Think about registers you have problems with. Depending on what the

Слайд 38Tips for making the collection and troubleshooting process easier
Fill in data
Engage someone else to help you fill in as you see patients (CHW, EHT, CBV, CHA, etc)
Do NOT wait too long to fill in the registers


Слайд 40Generating Quality Data
Before submitting reports, data collectors must:
Spot-check a small percentage
Review data personally to ensure the numbers align with the reality
Be able to explain unexpected values in comments or follow-up to correct.


Слайд 42Exercise
Use the registers and tally sheets you brought with you to

Слайд 43Day 2
Into DHIS2 -- creating charts and pivot tables, saving favorites,

Слайд 44What is DHIS2?
District Health Information System
Open source software
Born out of HISP
Zambia’s


Слайд 48
A pivot table is …
A tool that allows you to reorganize
It does not change the underlying data, but represents it in a different way
To pivot is to turn the data to view it from different perspectives

Слайд 49
A pivot table is …
The foundation of
Data aggregation
Data analysis
Data
Data visualization


Слайд 52
Data Selection
Define
DE / Indicator / Reporting rates (WHAT)
Period (WHEN)
Orgunit (WHERE)
Update
Period (WHEN)Orgunit (WHERE)Update")
Слайд 53WHAT
Indicator
Data Elements
Reporting Rates
WHEN
Relative e.g. last 12 months
Fixed e.g. Feb 2014
WHERE
Standard
Select
Group e.g. Chiefdoms
Pivot Table Parameters
Indicator
A formula, such as 1st ANC coverage or HIV positivity rate
Data Element
Data reported directly from a register
Reporting Rates
Datasets define number of expected reports
Reporting rate = (number received / number expected)*100


Слайд 55Pivot Table Parameters: Where
Organization Unit
+ to show subunits
Ctrl to select multiple
Right


Слайд 57WHEN: Monthly→ September 2015
WHERE: All subunits (i.e. Districts) under Luapula Province
WHAT:
 under Luapula ProvinceWHAT: ANC 1st visit total")
Слайд 58
Result
Data Element: ANC 1st visit
Org Unit: All Luapula Districts
Default pivot table


Слайд 63Not very intuitive to read. PIVOT!!!
Maternal health: ANC and PNC
Data elements
1st
PNC within 2 days
Period
2015
Orgunits
All subunits in Chiengi

Move Orgunits to Column (above Data)Pivoted")
Move Orgunits to Row (below Period)")
Слайд 66Download
Click download
Excel (XLS)
Can then do other calculations / incorporate into other
Can then do other calculations / incorporate into other data etc.")

Слайд 68Exercise Sheet
Work through each example on the worksheet
Don’t skip any sections
Ask


Слайд 70Overview
Charts, graphs, and tables provide a great deal of visual
They allow users to quickly spot trends, examine pronounced data, and see an actual picture.
This power and appeal makes a “picture worth a thousand words.”

Слайд 71Overview cont’d
In educational settings, charts, graphs, and tables can be
Illustrate important patterns or relationships, and observe changes as data is altered

Слайд 72Six things conveyed by charts & graphs
Comparisons
Relationships
Distribution
Trends
Composition
Flow/process, or

Слайд 73Reasons for creating charts and graphs
Make important trends easily recognizable
Allow users
Aid data interpretation

Слайд 74Charting considerations
Type of data
Purpose of the data
Nature of the data or
Accuracy and applicability of the chart.


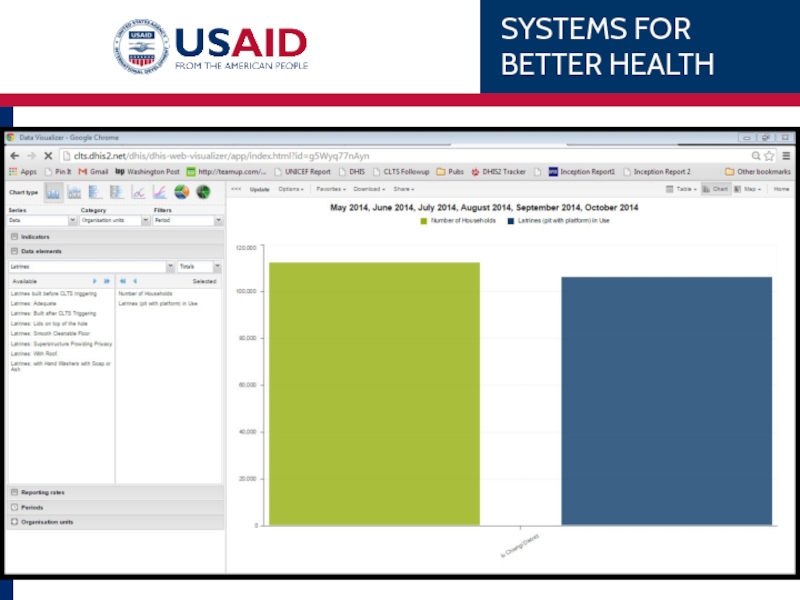
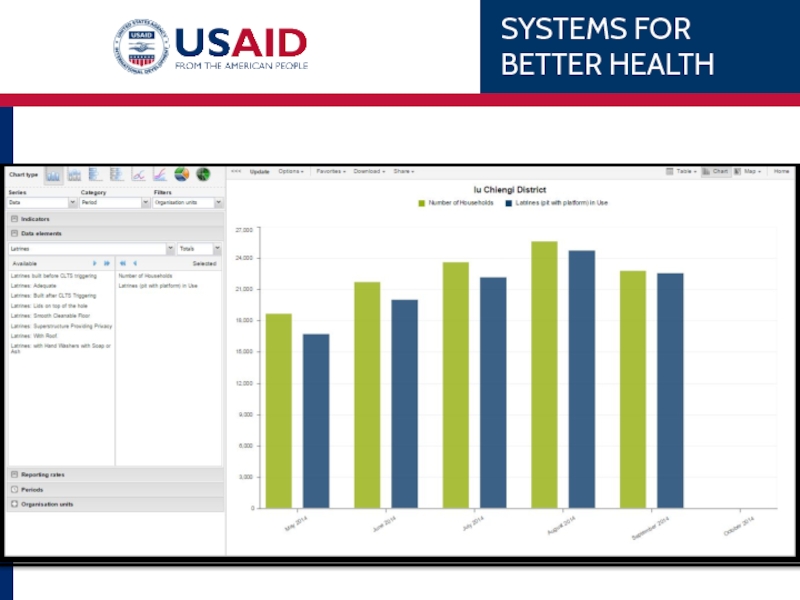
Слайд 77Chart type
Select from
Column
Stacked column
Bar
Stacked bar
Line
Area
Pie
Spider charts
Never use the ‘Back’ button

Слайд 78Chart parameters
Data:
Indicators
Date Elements
Reporting Rates
Period:
Relative e.g. Last quarter
Fixed e.g.
Orgunit:
Standard
Select subunits
Group

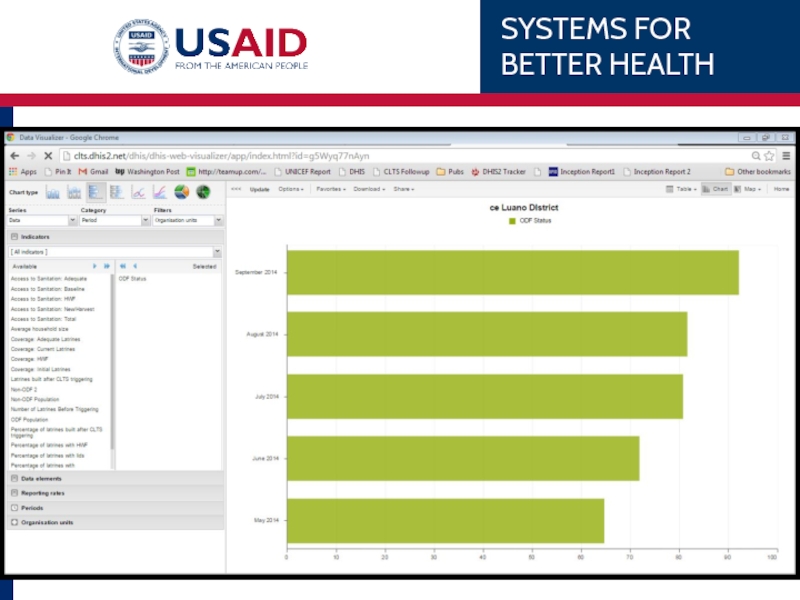
Слайд 79Example
Chipata District’s 1st ANC coverage over the last 6 months.
WHAT
WHEN
WHERE
Indicator –
Monthly, last 6 months
Eastern Province, Chipata District (no subunits)

Слайд 81Example
Chipata’s 1st ANC coverage over the last 6 months
SERIES
CATEGORY
FILTERS
DATA
X-axis
What
Think BACKWARDS! What can you filter out? Periods or Org Units? Set the filter and place the other item in the category.
Update


Слайд 86Chipata’s 1 ANC
WHAT
WHEN
WHERE
Data Element – 1st ANC <14 weeks, Total 1st ANC
Monthly, last 6 months
Eastern Province, Chipata District (no children)
Example

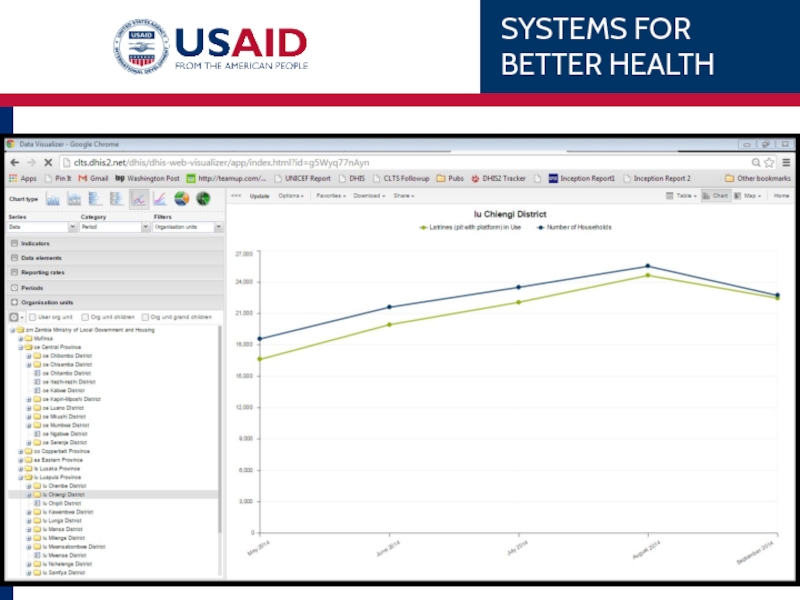


Слайд 93Choma Reporting Rates
Line Chart
Series (Data), Category (Period), Filter (Organisation unit)
What:
Reporting
When
Period: Last 12 Months
Where:
Org Units: Choma District
Update
, Category (Period), Filter (Organisation unit)What: Reporting Rates: HIA2WhenPeriod: Last")
Слайд 95Download charts
Two options available
Standard image (PNG)
PDF
PDF is higher quality if this
PDFPDF is higher quality if this is required")

Слайд 97Exercise Sheet
Work through each example on the work sheet
Don’t skip any
Ask for help if you are unsure


Слайд 99When to do data entry
Entering HIA 1 and 2 forms
Suggested 1

Слайд 100WARNING!
Data entry is live
No undo button
I error in population data impacts


Слайд 103Worked Examples
Use the tally sheets you brought from your facility to