- Главная
- Разное
- Дизайн
- Бизнес и предпринимательство
- Аналитика
- Образование
- Развлечения
- Красота и здоровье
- Финансы
- Государство
- Путешествия
- Спорт
- Недвижимость
- Армия
- Графика
- Культурология
- Еда и кулинария
- Лингвистика
- Английский язык
- Астрономия
- Алгебра
- Биология
- География
- Детские презентации
- Информатика
- История
- Литература
- Маркетинг
- Математика
- Медицина
- Менеджмент
- Музыка
- МХК
- Немецкий язык
- ОБЖ
- Обществознание
- Окружающий мир
- Педагогика
- Русский язык
- Технология
- Физика
- Философия
- Химия
- Шаблоны, картинки для презентаций
- Экология
- Экономика
- Юриспруденция
The normal distribution презентация
Содержание
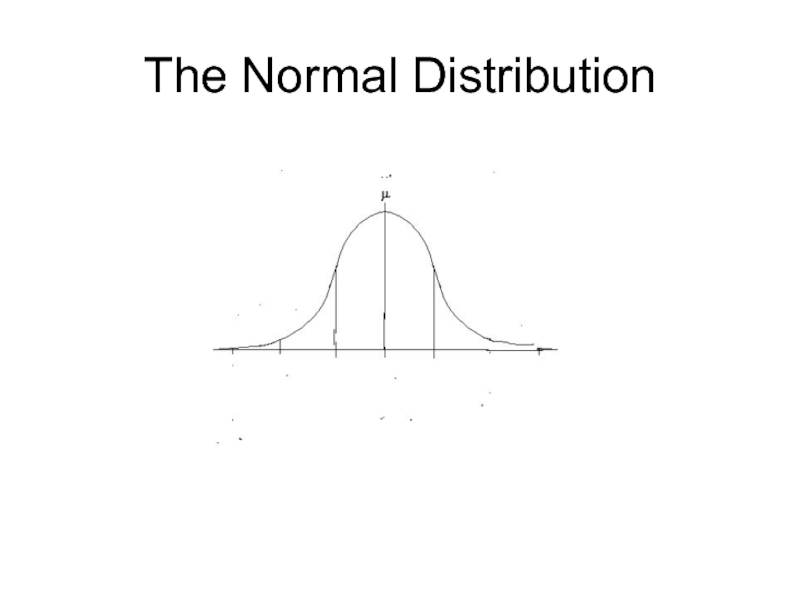
- 1. The normal distribution
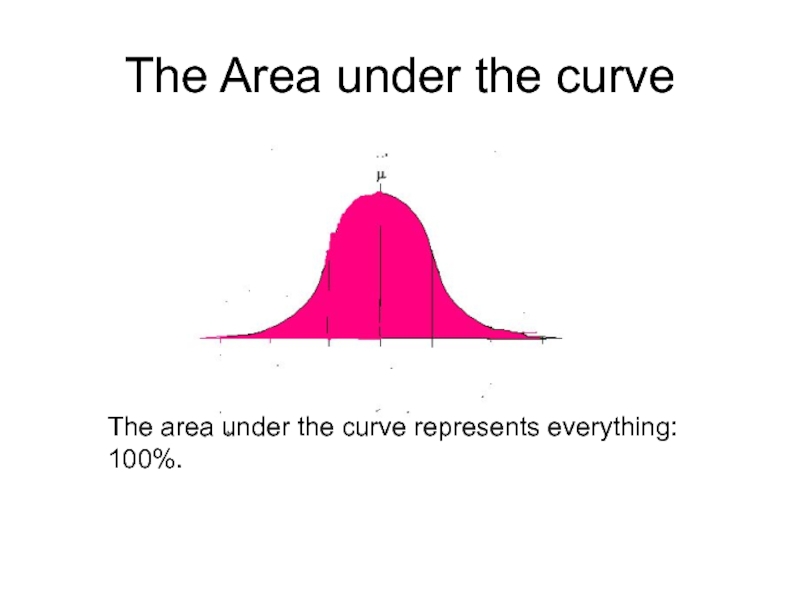
- 2. The Area under the curve The area under the curve represents everything: 100%.
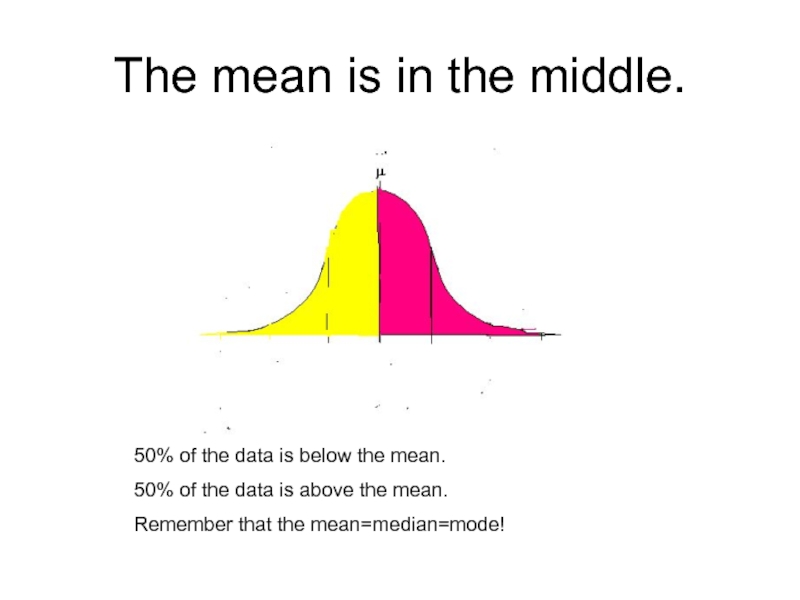
- 3. The mean is in the middle.
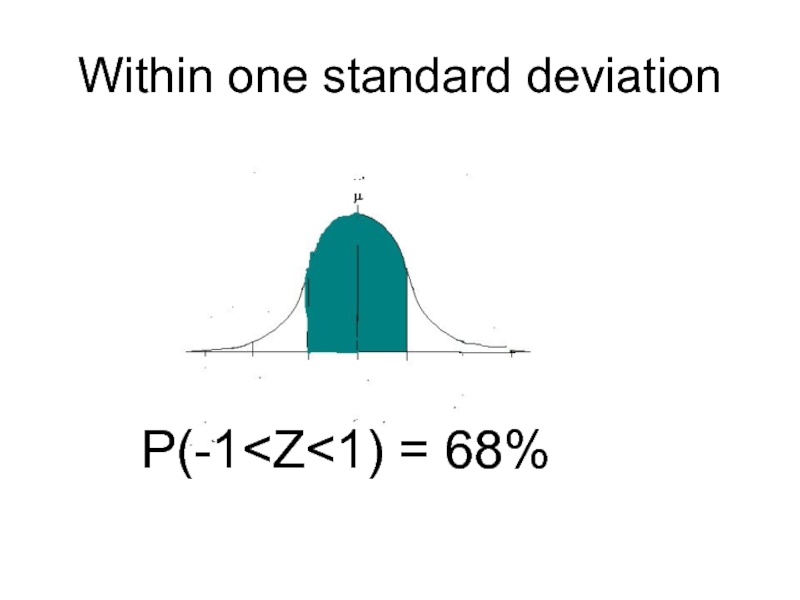
- 4. Within one standard deviation P(-1
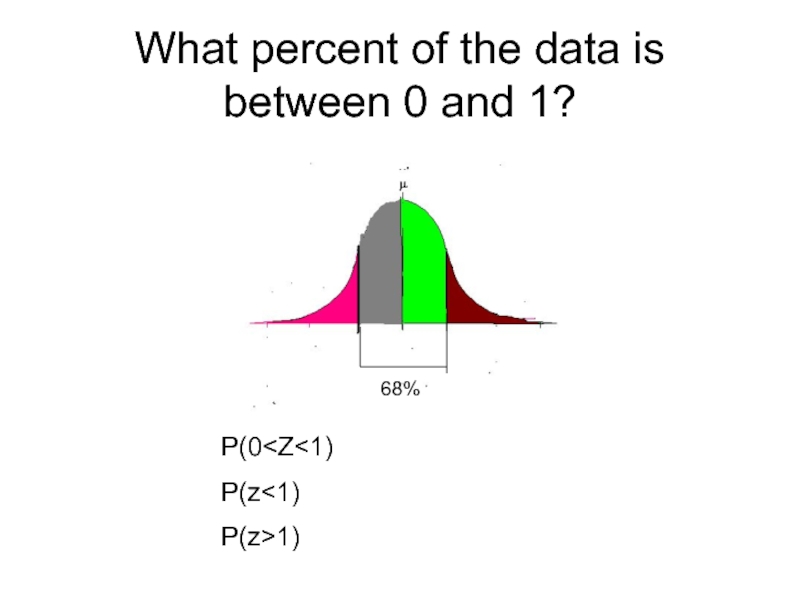
- 5. What percent of the data is between 0 and 1? 68% P(0
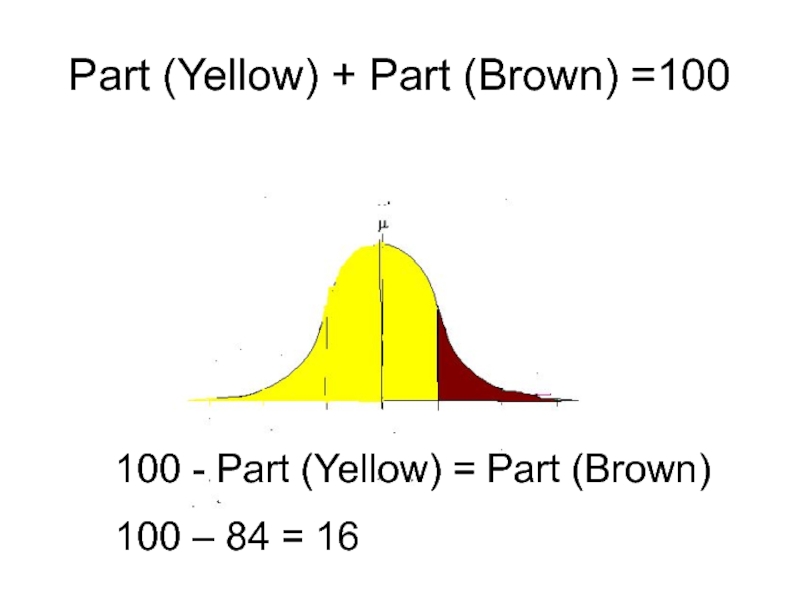
- 6. Part (Yellow) + Part (Brown) =100 100
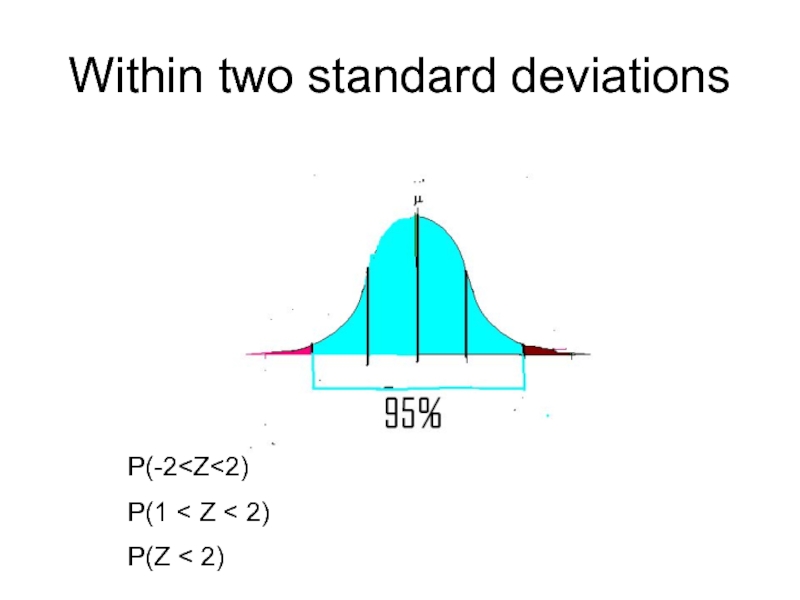
- 7. Within two standard deviations P(-2
- 8. The Normal Distribution A normal curve is
- 9. Example 1 1,000 students take an intelligence
- 10. Label the bell! The mean
- 11. Label the bell! The mean value of
- 12. Label the bell! The mean price of
- 13. Convert x to z Z is the
- 14. The Calculator Finding P(a
- 15. Write the normalcdf for each µ=50 and σ=10 P(20
- 16. ∞ = 1E99 -∞ = -1E99 P(50
- 17. Let’s Do A Graph Normal curves are graphed by normalpdf
Слайд 3The mean is in the middle.
50% of the data is below
the mean.
50% of the data is above the mean.
Remember that the mean=median=mode!
50% of the data is above the mean.
Remember that the mean=median=mode!
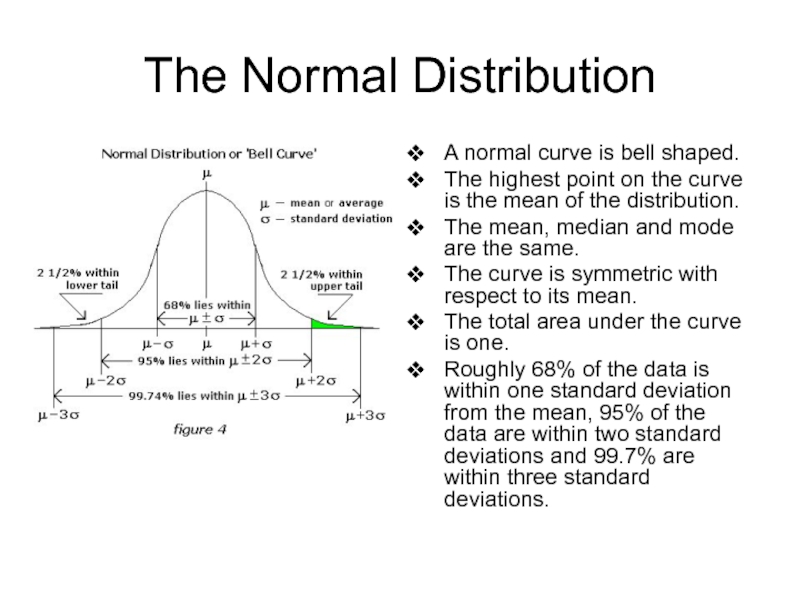
Слайд 8The Normal Distribution
A normal curve is bell shaped.
The highest point on
the curve is the mean of the distribution.
The mean, median and mode are the same.
The curve is symmetric with respect to its mean.
The total area under the curve is one.
Roughly 68% of the data is within one standard deviation from the mean, 95% of the data are within two standard deviations and 99.7% are within three standard deviations.
The mean, median and mode are the same.
The curve is symmetric with respect to its mean.
The total area under the curve is one.
Roughly 68% of the data is within one standard deviation from the mean, 95% of the data are within two standard deviations and 99.7% are within three standard deviations.
Слайд 9Example 1
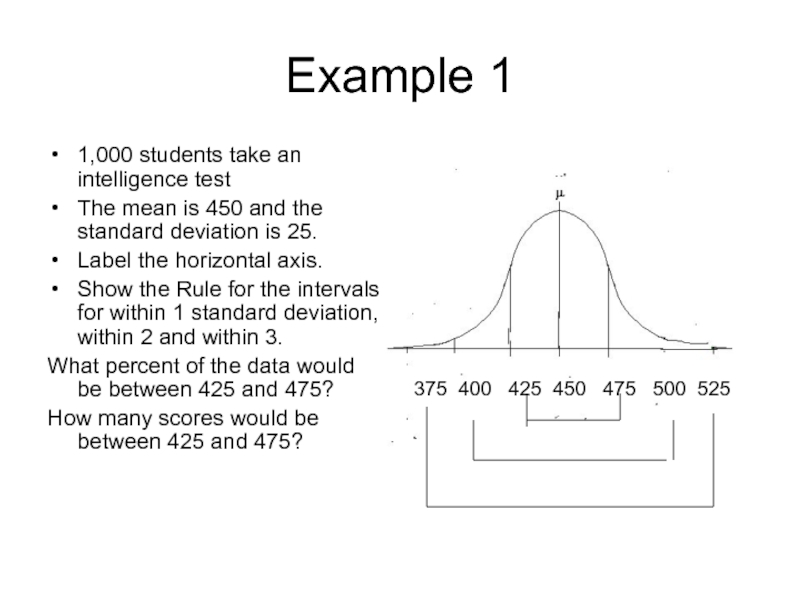
1,000 students take an intelligence test
The mean is 450 and
the standard deviation is 25.
Label the horizontal axis.
Show the Rule for the intervals for within 1 standard deviation, within 2 and within 3.
What percent of the data would be between 425 and 475?
How many scores would be between 425 and 475?
Label the horizontal axis.
Show the Rule for the intervals for within 1 standard deviation, within 2 and within 3.
What percent of the data would be between 425 and 475?
How many scores would be between 425 and 475?
375 400 425 450 475 500 525
Слайд 10Label the bell!
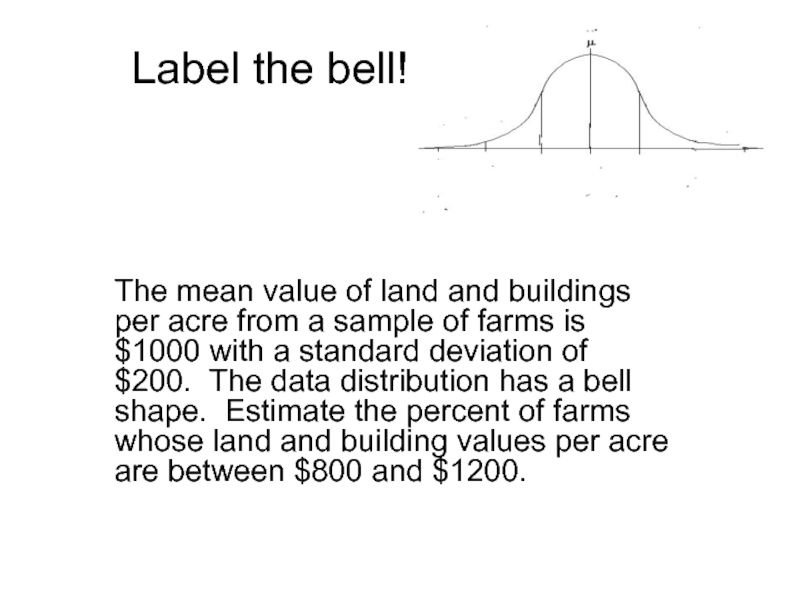
The mean value of land and buildings per acre
from a sample of farms is $1000 with a standard deviation of $200. The data distribution has a bell shape. Estimate the percent of farms whose land and building values per acre are between $800 and $1200.
Слайд 11Label the bell!
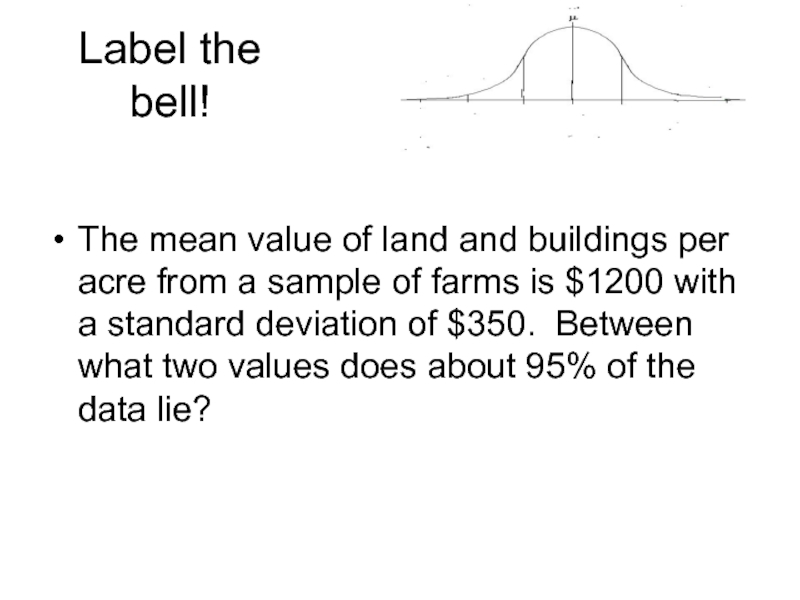
The mean value of land and buildings per acre
from a sample of farms is $1200 with a standard deviation of $350. Between what two values does about 95% of the data lie?
Слайд 12Label the bell!
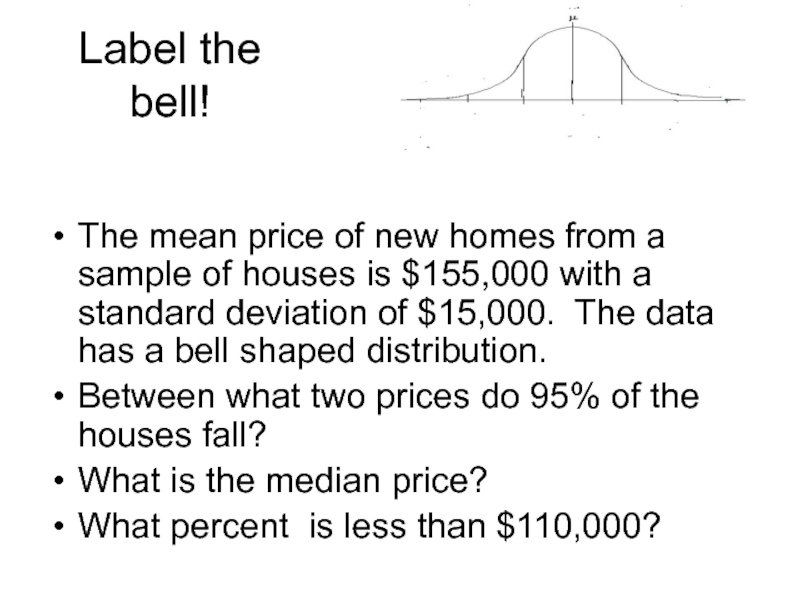
The mean price of new homes from a sample
of houses is $155,000 with a standard deviation of $15,000. The data has a bell shaped distribution.
Between what two prices do 95% of the houses fall?
What is the median price?
What percent is less than $110,000?
Between what two prices do 95% of the houses fall?
What is the median price?
What percent is less than $110,000?
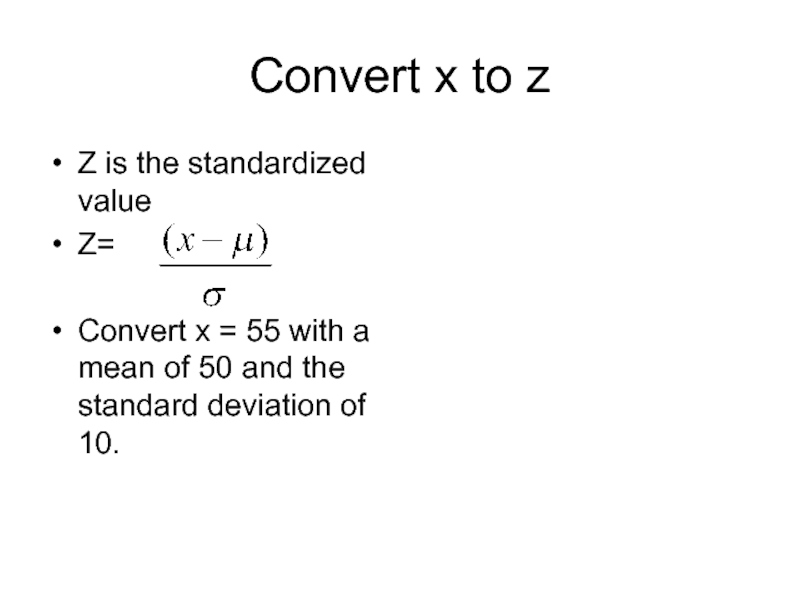
Слайд 13Convert x to z
Z is the standardized value
Z=
Convert x =
55 with a mean of 50 and the standard deviation of 10.
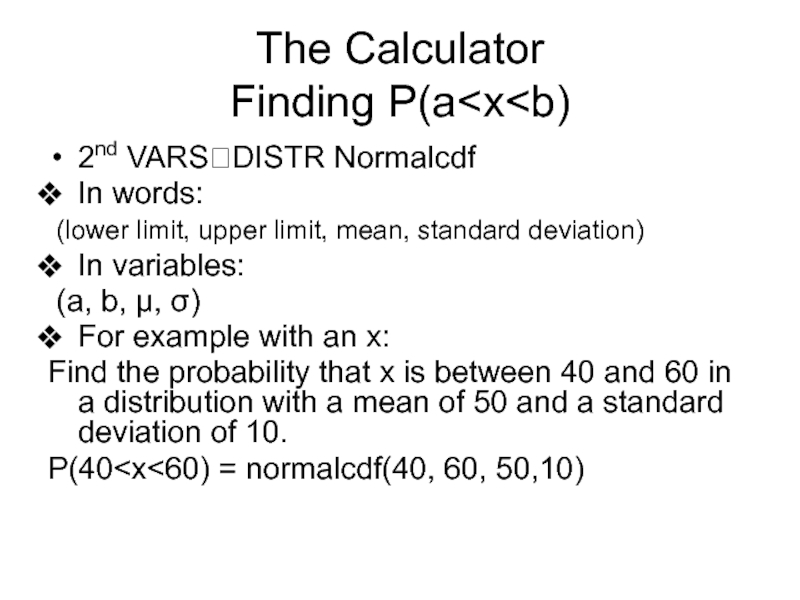
Слайд 14The Calculator Finding P(a
mean, standard deviation)
In variables:
(a, b, µ, σ)
For example with an x:
Find the probability that x is between 40 and 60 in a distribution with a mean of 50 and a standard deviation of 10.
P(40
In variables:
(a, b, µ, σ)
For example with an x:
Find the probability that x is between 40 and 60 in a distribution with a mean of 50 and a standard deviation of 10.
P(40
