- Главная
- Разное
- Дизайн
- Бизнес и предпринимательство
- Аналитика
- Образование
- Развлечения
- Красота и здоровье
- Финансы
- Государство
- Путешествия
- Спорт
- Недвижимость
- Армия
- Графика
- Культурология
- Еда и кулинария
- Лингвистика
- Английский язык
- Астрономия
- Алгебра
- Биология
- География
- Детские презентации
- Информатика
- История
- Литература
- Маркетинг
- Математика
- Медицина
- Менеджмент
- Музыка
- МХК
- Немецкий язык
- ОБЖ
- Обществознание
- Окружающий мир
- Педагогика
- Русский язык
- Технология
- Физика
- Философия
- Химия
- Шаблоны, картинки для презентаций
- Экология
- Экономика
- Юриспруденция
The mean values презентация
Содержание
- 1. The mean values
- 2. Part 1 THE MEAN VALUES
- 3. СHAPTER QUESTIONS Measures of location Types of
- 4. Properties to describe numerical data: Central tendency
- 5. Measures of location include: Arithmetic mean
- 6. Grouped and Ungrouped UNGROUPED or
- 7. What is the mean? The mean -
- 8. Statistics derive the formula of the means
- 9. There are the following types of mean:
- 10. The higher the degree of z, the
- 11. There are two ways of calculating mean:
- 12. Types of means
- 13. Arithmetic mean Arithmetic mean value is
- 14. Characteristics of the arithmetic mean
- 15. 2. If the data values (Xi) divided
- 16. 3. If the frequency divided by a constant number, the mean will not change:
- 17. 4. Multiplying the mean for the amount
- 18. 5.The sum of the deviations of
- 19. Measures of location for ungrouped data In
- 20. Measures of location for ungrouped data
- 21. sum of observations number of observations
- 22. Example - The sales of the six
- 23. MEDIAN for ungrouped data The median of
- 24. MEDIAN Every ordinal-level, interval-level and
- 25. Position of median If n
- 26. Example The median number of people
- 27. MODE for ungrouped data Is the observation
- 28. The simple mean of the sample of
- 29. −4 −3 2 2 5 5 5 6 8 Median item number = (n+1)/2
- 30. Determine the median of the sample of
- 31. Determine the mode of the sample of
- 32. Determine the mode of the sample of
- 33. Is used if М = const:
- 34. For example: One student spends
- 35. Geometric mean for ungrouped data This value
- 36. Where П –
- 37. For example, the known data about the
- 38. Measures of location for grouped data
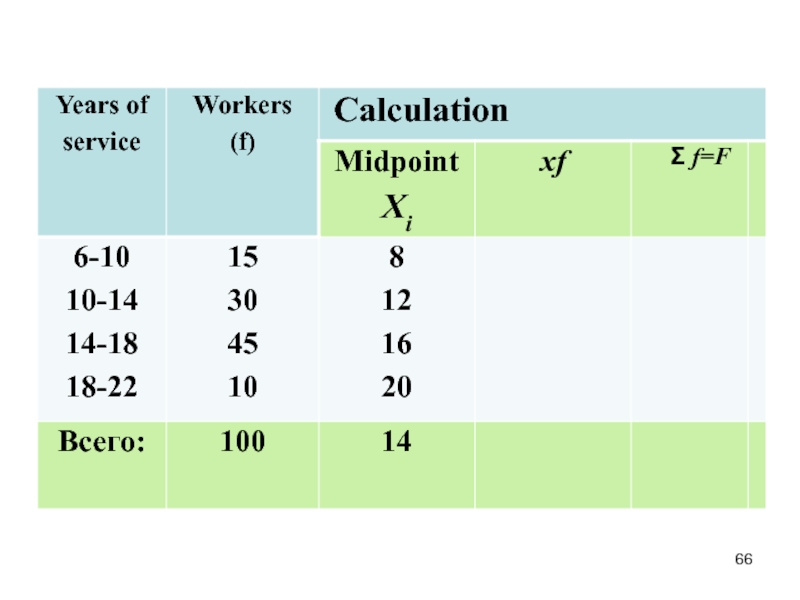
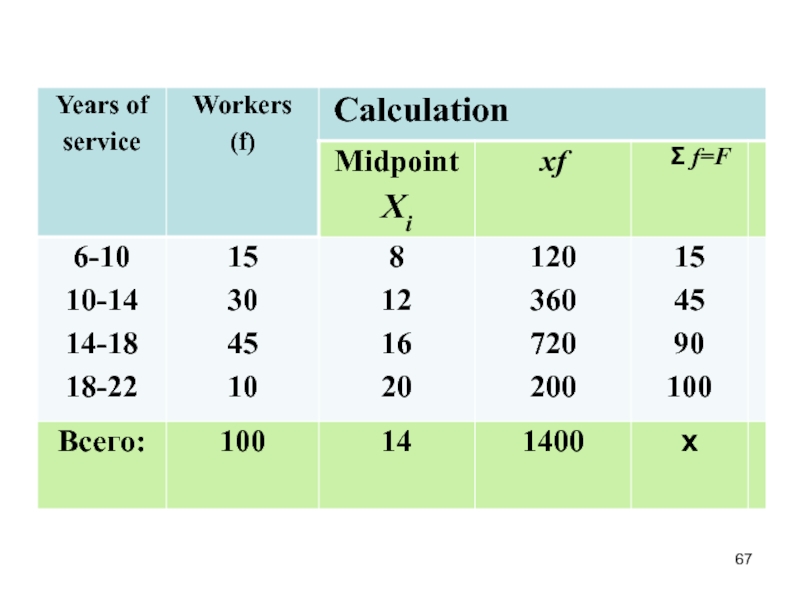
- 39. Example There are data on seniority hundred employees in the table
- 40. Average seniority employee is:
- 41. Harmonic mean for grouped data Harmonic mean
- 42. Harmonic mean for grouped data Harmonic mean
- 43. Example There are data on hárvesting
- 44. is calculated by the formula:
- 45. Calculate the geometric mean. It is 127,5% percent: Geometric mean for grouped data EXAMPLE
- 46. Measures of location for grouped data
- 47. Measures of location for grouped data
- 48. Mode is calculated by the formula:
- 49. To calculate the mean for the sample
- 50. Number of Number of
- 51. To calculate the for the sample median
- 52. Number of Number of
- 53. Measures of location for grouped data
- 54. To calculate the for the sample mode
- 55. We substitute the data into the formula:
- 56. Measures of location for grouped data
- 57. Relationship between mean, median, and mode If
- 59. EXAMPLE Consider a study of the hourly
- 61. So we have three 100-element samples, which
- 62. The histogram for company I (left chart)
- 63. Knowing the median, modal and average values
- 64. We obtain the following relevant indicators (measures)
- 65. Example
- 68. The weighted arithmetic mean
- 69. The median
- 70. The mode


Слайд 3СHAPTER QUESTIONS
Measures of location
Types of means
Measures of location for ungrouped data
-
- Harmonic mean
- Geometric mean
- Median and Mode
4. Measures of location for grouped data
- Arithmetic mean
- Harmonic mean
- Geometric mean
- Median and Mode

Слайд 4Properties to describe numerical data:
Central tendency
Dispersion
Shape
Measures calculated for:
Sample data
Statistics
Entire population
Parameters
Measures of

Слайд 5Measures of location include:
Arithmetic mean
Harmonic mean
Geometric mean
Median
Measures of location and dispersion

Слайд 6
Grouped and Ungrouped
UNGROUPED or raw data refers to data as
GROUPED data refers to data summarised in a frequency table

Слайд 7What is the mean?
The mean - is a general indicator characterizing

Слайд 8Statistics derive the formula of the means of the formula of
We introduce the following definitions
- X-bar - the symbol of the mean
Х1, Х2...Хn – measurement of a data value
f- frequency of a data values;
n – population size or sample size.

Слайд 9There are the following types of mean:
If z = -1
z = 0 - the geometric mean,
z = +1 - arithmetic mean,
z = +2 - mean square,
z = +3 - mean cubic, etc.

Слайд 10The higher the degree of z, the greater the value of
There is the following relation, called the rule the majorizing mean:

Слайд 11There are two ways of calculating mean:
for ungrouped data -
for grouped data -
is calculated weighted mean


Слайд 13Arithmetic mean
Arithmetic mean value is called the mean value of

Слайд 14Characteristics of the arithmetic mean
The arithmetic mean has a
1. If the data values (Xi) to reduce or increase by a constant number (A), the mean, respectively, decrease or increase by a same constant number (A)

Слайд 152. If the data values (Xi) divided or multiplied by a
a) when divided by a constant number:
b) when multiplied by a constant number:
 divided or multiplied by a constant number (A), the")

Слайд 174. Multiplying the mean for the amount of frequency equal to
If
then the following equality holds:

Слайд 18 5.The sum of the deviations of the number in a
If
then
So

Слайд 19Measures of location for ungrouped data
In calculating summary values for a
More important measures of central tendency are presented in this section:
Mean (simple or weighter)
Median and Mode

Слайд 20Measures of location for ungrouped data
ARITHMETIC MEAN
- The arithmetic mean is a summary value calculated by summing the numerical data values and dividing by the number of values
Sample size
Measures of location for ungrouped data

Слайд 21
sum of observations
number of observations
Population mean =
Measures of location for
ARITHMETIC MEAN
This is the most commonly used measure and is also called the mean.
Population size
Xi = observations of the population
∑ = “the sum of”
Mean

Слайд 22Example - The sales of the six largest restaurant chains are
A mean sales amount of 5.280 $ million is computed using Equation of arithmetical mean simple

Слайд 23MEDIAN for ungrouped data
The median of a data is the middle
The median is the measure of location most often reported for annual income and property value data.
A few extremely large incomes or property values can inflate the mean.

Слайд 24MEDIAN
Every ordinal-level, interval-level and ratio-level data set has a
The median is not sensitive to extreme values
The median does not have valuable mathematical properties for use in further computations
Half the values in data set is smaller than median.
Half the values in data set is larger than median.
Order the data from small to large.
Characteristics of the median

Слайд 25Position of median
If n is odd:
Median item number
If n is even:
Calculate (n+1)/2
The median is the average of the values before and after (n+1)/2.
/2 If n is")
Слайд 26Example
The median number of people treated daily at the emergency
Since the data values are arranged from lowest to highest, the median be easily found. If the data values are arranged in a mess, they must rank.
Median item number = (6+1)/2 =3,5
Since the median is item 3,5 in the array, the third and fourth elements need to be averaged: (45+52)/2=48,5. Therefore, 48,5 is the median number of patients treated in hospital emergency room during the six-day period.

Слайд 27MODE for ungrouped data
Is the observation in the data set that
Order the data from small to large.
If no observation repeats there is no mode.
If one observation occurs more frequently:
Unimodal
If two or more observation occur the same number of times:
Multimodal
Used for nominal scaled variables.
The mode does not have valuable mathematical properties for use in future computations

Слайд 28The simple mean of the sample of nine measurements is given
2
5
8
5
2
6
Example – Given the following data sample:
2 5 8 −3 5 2 6 5 −4
−3
5
−4
9

Слайд 29−4 −3 2 2 5 5 5 6 8
Median item number =
(n+1)/2 = (9+1)/2 = 5th measurement
1
2
3
4
5
6
7
8
9
Median =
Odd number
The median of the sample of nine measurements is given by:
Example – Given the following data set:
2 5 8 −3 5 2 6 5 −4
/2 = (9+1)/2 = 5th measurement123456789Median = 5Odd numberThe median of")
Слайд 30Determine the median of the sample of ten measurements.
Order the measurements
Example
Given the following data set:
2 5 8 −3 5 2 6 5 −4 3
−4 −3 2 2 3 5 5 5 6 8
(n+1)/2 = (10+1)/2 = 5,5th measurement
1
2
3
4
5
6
7
8
9
Median = (3+5)/2 = 4
Even number
10

Слайд 31Determine the mode of the sample of nine measurements.
Order the measurements
Given the following data set:
2 5 8 −3 5 2 6 5 −4
−4 −3 2 2 5 5 5 6 8
Mode = 5
Unimodal
Example

Слайд 32Determine the mode of the sample of ten measurements.
Order the measurements
2 5 8 −3 5 2 6 5 −4 2
−4 −3 2 2 2 5 5 5 6 8
Mode = 2 and 5
Multimodal - bimodal
Example

Слайд 33Is used if М = const:
Harmonic mean is also called the
Harmonic mean for ungrouped data

Слайд 34
For example:
One student spends on a solution of task 1/3
Harmonic mean for ungrouped data

Слайд 35Geometric mean for ungrouped data
This value is used as the average

Слайд 36
Where П – the multiplication of the data value (Xi).
n
Geometric mean for ungrouped data
. n – power of root Geometric")
Слайд 37For example, the known data about the rate of growth of
Calculate the geometric mean. It is 127 percent:
Geometric mean for ungrouped data

Слайд 38Measures of location for grouped data
ARITHMETIC MEAN
Data is given
Only an approximate value of the mean


Слайд 41Harmonic mean for grouped data
Harmonic mean - is the reciprocal of
xf = M.


Слайд 44is calculated by the formula:
Where fi – frequency of the data value (Xi)
П – multiplication sign.
Geometric mean for grouped data


Слайд 46Measures of location for grouped data
MEDIAN
Data is given in
First cumulative frequency ≥ n/2 will indicate the median class interval.
Median can also be determined from the ogive.

Слайд 47Measures of location for grouped data
MODE
Class interval that has the
Mode is the class midpoint of this class.
Mode must be determined from the histogram.

Слайд 48Mode is calculated by the formula:
where хМо – lower boundary of
i= хМо – xMo+1 - difference between the lower boundary of the modal interval and upper boundary
fMo, fMo-1, fMo+1 – frequencies of the modal interval, of interval foregoing modal interval and of interval following modal interval

Слайд 49To calculate the mean for the sample of the 48 hours:
Determine
Number of Number of
calls hours fi xi
[2–under 5) 3 3,5
[5–under 8) 4 6,5
[8–under 11) 11 9,5
[11–under 14) 13 12,5
[14–under 17) 9 15,5
[17–under 20) 6 18,5
[20–under 23) 2 21,5 n = 48
Measures of location for grouped data
Example – The following data represents the number of telephone calls received for two days at a municipal call centre. The data was measured per hour.

Слайд 50 Number of Number of
calls hours fi
[2–under 5) 3 3,5
[5–under 8) 4 6,5
[8–under 11) 11 9,5
[11–under 14) 13 12,5
[14–under 17) 9 15,5
[17–under 20) 6 18,5
[20–under 23) 2 21,5 n = 48
Measures of location for grouped data
Example – The following data represents the number of telephone calls received for two days at a municipal call centre. The data was measured per hour.
Average number of calls per hour is 12,44.

Слайд 51To calculate the for the sample median of the 48: hours:
determine
Number of Number of
calls hours fi F
[2–under 5) 3 3
[5–under 8) 4 7
[8–under 11) 11 18
[11–under 14) 13 31
[14–under 17) 9 40
[17–under 20) 6 46
[20–under 23) 2 48 n = 48
Measures of location for grouped data
Example – The following data represents the number of telephone calls received for two days at a municipal call centre. The data was measured per hour.
n/2 = 48/2 = 24
The first cumulative frequency ≥ 24

Слайд 52 Number of Number of
[2–under 5) 3 3
[5–under 8) 4 7
[8–under 11) 11 18
[11–under 14) 13 31
[14–under 17) 9 40
[17–under 20) 6 46
[20–under 23) 2 48 n = 48
Measures of location for grouped data
Example – The following data represents the number of telephone calls received for two days at a municipal call centre. The data was measured per hour.
50% of the time less than 12,38 or 50% of the time more than 12,38 calls per hour.

Слайд 53Measures of location for grouped data
Example – The following data
The median can be determined form the ogive.
n/2 = 48/2 = 24
Median = 12,4 Read at A.
A

Слайд 54To calculate the for the sample mode of the 48 hours
The
Number of Number of
calls hours fi
[2–under 5) 3
[5–under 8) 4
[8–under 11) 11
[11–under 14) 13
[14–under 17) 9
[17–under 20) 6
[20–under 23) 2 n = 48
Measures of location for grouped data
Example – The following data represents the number of telephone calls received for two days at a municipal call centre. The data was measured per hour.
The highest frequency

Слайд 55We substitute the data into the formula:
Mo = 12,3
So, the most
MODE

Слайд 56Measures of location for grouped data
Example – The following data
The mode can be determined form the histogram.
Mode = 12,3 Read at A.
A

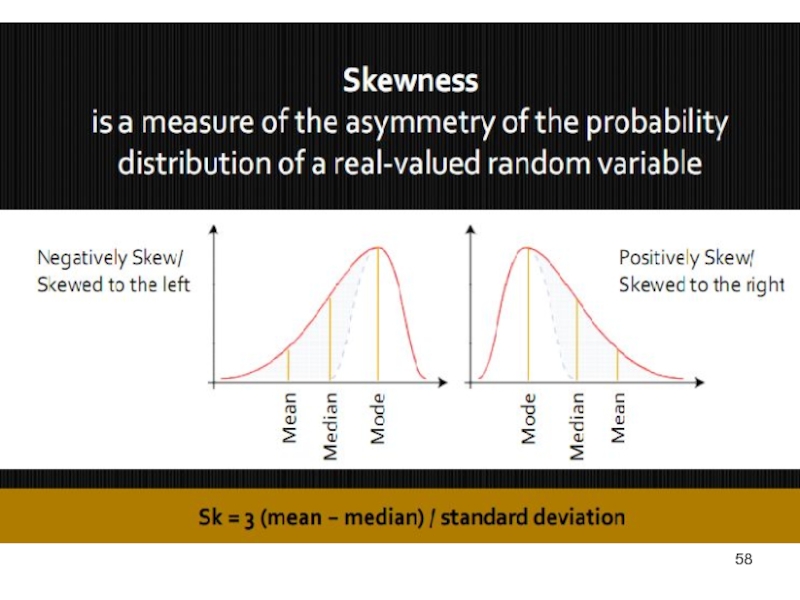
Слайд 57Relationship between mean, median, and mode
If a distribution is symmetrical:
the mean,
If a distribution is non-symmetrical:
skewed to the left or to the right
three measures differ
A positively skewed distribution
(skewed to the right)
A negatively skewed distribution
(skewed to the left)
Measures of location for grouped data

Слайд 59EXAMPLE
Consider a study of the hourly wage rates in three different

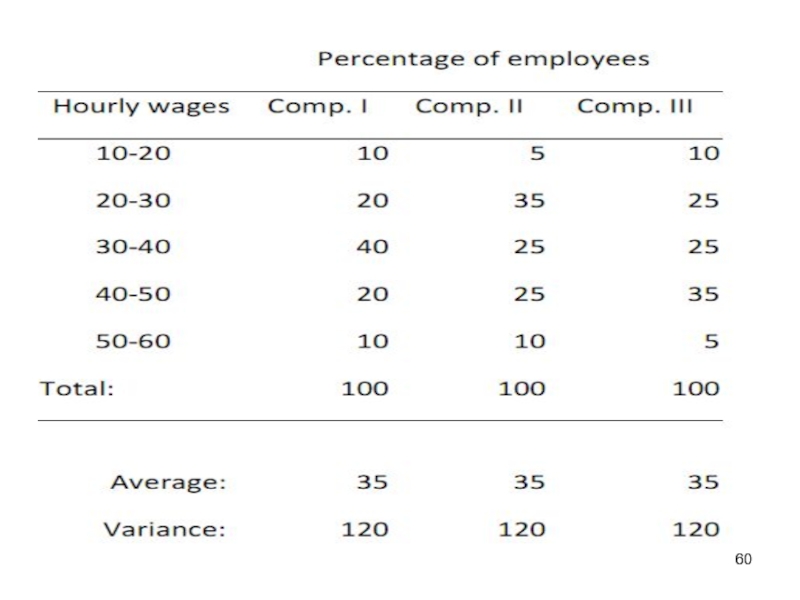
Слайд 61So we have three 100-element samples, which have the same average
 and the")
Слайд 62The histogram for company I (left chart) is symmetric. The histogram
 is symmetric. The histogram for company II (middle")
Слайд 63Knowing the median, modal and average values enables us to resolve
For symmetrical distributions:
x = Me = Mo ,
For right skewed distributions:
x > Me > Mo
For left skewed distributions:
x < Me < Mo .
POSITIONAL CHARACTERISTICS

Слайд 64We obtain the following relevant indicators (measures) of asymmetry:
Index
Standardized skewness ratio:
Coefficient of asymmetry
 of asymmetry: Index of skewness:")