- Главная
- Разное
- Дизайн
- Бизнес и предпринимательство
- Аналитика
- Образование
- Развлечения
- Красота и здоровье
- Финансы
- Государство
- Путешествия
- Спорт
- Недвижимость
- Армия
- Графика
- Культурология
- Еда и кулинария
- Лингвистика
- Английский язык
- Астрономия
- Алгебра
- Биология
- География
- Детские презентации
- Информатика
- История
- Литература
- Маркетинг
- Математика
- Медицина
- Менеджмент
- Музыка
- МХК
- Немецкий язык
- ОБЖ
- Обществознание
- Окружающий мир
- Педагогика
- Русский язык
- Технология
- Физика
- Философия
- Химия
- Шаблоны, картинки для презентаций
- Экология
- Экономика
- Юриспруденция
Getting your data: Sources and samples презентация
Содержание
- 1. Getting your data: Sources and samples
- 2. Sources of psychological data and Data
- 3. Why experiment is not a method
- 4. Data collection exercise - 15 mins -
- 5. Sample What does Sample mean? Sample
- 6. Sample and distribution What is distribution?
- 7. Descriptive statistics…
- 8. Exercise A survey of 20 students was
- 9. Normal distribution Properties of any theoretical normal
- 10. Normal distribution Skewness = asymmetry Kurtosis = flatness
- 11. Where is NORMAL distribution?
- 12. What do we know about STANDARD normal
- 13. Why is it important to know what
- 14. Descriptive statistics… Variance Standard deviation(SD) -
- 15. Are you tall?
- 16. When you know so much about distributions,
- 17. average Less than average More than
- 18. Is this result applicable in other groups?
- 19. Standard scores (Z-scores) your individual height mean
- 20. Standard normal table Shows you a PROBABILITY
- 21. What is the probability to find people
- 23. Sample size and standard error We know
- 24. Standard error SD Sample size Guatemala:
- 25. Why do bigger samples provide better
- 26. Sampling strategies Probability strategy True random
- 27. Exercise: Match the statement with the appropriate term
- 28. I want to study cultural differences…/ I
- 29. Recommended reading: Howitt & Cramer, 2011,
- 30. Why Standardize ... ? Example 2. Here
- 31. Next time Psychological measurement: Psychometrics and psychophysics

Слайд 2Sources of psychological data
and Data collection methods
Data sources
Data collection methods
Behavior
Physiological
Self-reports
Peer-reports
Activity reports (objective/projective)
Biographical or archival data
Observation
Measurement
Focus-groups
Survey
«Archival data»: databases, papers
Biographical or")
Слайд 3
Why experiment is not a method of data collection?
Because it is

Слайд 4Data collection exercise - 15 mins -
In groups of 4
What type of data is the most suitable for your RQ or H?
What data collection method is the most suitable?
WHY?

Слайд 5Sample
What does Sample mean?
Sample is a limited set of research
Why do we need samples?
 which we")
Слайд 6Sample and distribution
What is distribution?
- a relationship between the values
Values of variable
Distribution of values


Слайд 8Exercise
A survey of 20 students was conducted to find out how
2, 4, 5, 1, 3, 2, 5, 6, 1, 2, 4, 3, 6, 10, 12, 10, 2, 8, 6, 7
Answers:
Mean = 4.95.
Median = 4.5
Mode = 2.

Слайд 9Normal distribution
Properties of any theoretical normal distribution:
1) The curve never approaches
2) Symmetrical around the mean.
3) Skewness = 0 and kurtosis = 0.
Standard normal distribution is a special case of theoretical n.d. with 2 properties:
1) μ = 0, σ = 1;
2) area under the curve = 1, and integral of (-∞; z] can be interpreted as probability of finding values equal to or below Z.
 The curve never approaches horizontal axis.2) Symmetrical around")


Слайд 12What do we know about STANDARD normal distribution?
1) The curve never
2) Symmetrical around the mean
3) Skewness = 0 and kurtosis = 0
4) Mean = 0, SD = 1
5) Mean= mode= median =0
Example 1. If you get a score of 90 in Math and 95 in English, you might think that you are better in English than in Math. However, in Math, your score is 2 standard deviations above the mean. In English, it’s only one standard deviation above the mean. It tells you that in Math, your score is far higher than most of the students (your score falls into the tail)
 The curve never approaches horizontal axis2) Symmetrical")
Слайд 13Why is it important to know what kind of distribution your
Non-parametric tests
Parametric tests

Слайд 14Descriptive statistics…
Variance
Standard deviation(SD)
- is the sum of the squared differences
Provides info HOW FAR scores are spread out
M
Difference from M of ind.score
- square root of variance
It is a quantification of scores variation, and it’s expressed in the same units as the data
- is the sum of the squared differences from the M of")

Слайд 16When you know so much about distributions, you can compute a
your personal height
mean height
sample size

Слайд 17
average
Less than average
More than average
When you know Mean and SD, you

Слайд 18Is this result applicable in other groups? Are you tall in other
But…

Слайд 19Standard scores (Z-scores)
your individual height
mean height in a given sample
standard deviation
A very good explanation of Z-scores: https://statistics.laerd.com/statistical-guides/standard-score.php
your individual heightmean height in a given samplestandard deviation in a given sampleA")
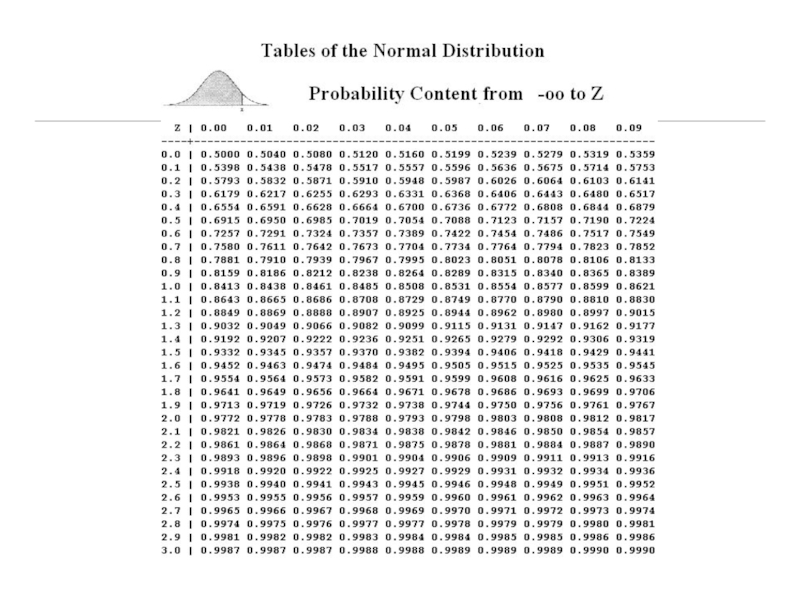
Слайд 20Standard normal table
Shows you a PROBABILITY that all observed values in
The values within the table are the probabilities corresponding to the table type.
The label for rows contains the integer part and the first decimal place of Z.
The label for columns contains the second decimal place of Z.

Слайд 21What is the probability to find people taller than you in…
…Guatemala?
Mean
SD = 6.3
your Z = (your cm - 147.3)/ 6.3
Then look in Z-table
…Hong Kong?
Mean = 160.1 cm
SD = 5.7
your Z = (your cm - 160.1)/ 5.7
Then look in Z-table

Слайд 23Sample size and standard error
We know M and SD in your
And we know M and SD in Guatemala
Which stats provide more trustworthy description of height in a country?
Why?

Слайд 24
Standard error
SD
Sample size
Guatemala:
SE = 6.3/ sqrt(15000) = .05
Our group:
SE =?
SE depends
The bigger the sample the smaller the SE
The smaller SE the more trustworthy estimations you have
 = .05Our group:SE =?SE depends on a sample sizeThe")
Слайд 25
Why do bigger samples provide better estimation?
Law of Large Numbers
In the

Слайд 26Sampling strategies
Probability strategy
True random sampling
using a random number table (a computer)
Stratified sampling / quota sampling
we define the target groups (strata) within our sample (genders, age groups, etc.) and collect respondents from each stratum to get the % you need
Cluster sampling
select the most representative group from a set (a class from a school, a neighborhood from a city
Multi-stage strategies
different strategies used at different sampling stages: e.g., 1) select a school from a city, and 2) select a number of students from that school
Non-probability strategy
Snowball approach:
start with some respondents (e.g., friends), asking each to recruit more people to the study.
Convenience sample:
people at work, students, etc.
Self-selecting sample:
those who agrees to take part in the study; «volunteer bias».
 to select people from")

Слайд 28I want to study cultural differences…/ I want to study how
This is possible only with representative samples collected in few countries!!!!
A non-representative or a sample from 1 country only cannot help you with this kind of RQ
Open access data:
European Social Survey http://www.europeansocialsurvey.org/
World Values Survey http://www.worldvaluessurvey.org/wvs.jsp
European Values Survey http://www.europeanvaluesstudy.eu/

Слайд 29
Recommended reading:
Howitt & Cramer, 2011, p. 232-246 (Samples).
Supplementary reading:
Bakeman, 2000 (Chapter
Cramer, 2007 (in Robins, Fraley, Krueger, 2007) (Archival method)
Diamond & Otter-Henderson, 2007 (in Robins, Fraley, Krueger, 2007) (Physiological measures)
Fraley, 2007 (in Robins, Fraley, Krueger, 2007) (Internet studies)
Wilkinson, Joffe, & Yardley, 2004 (Interviews and focus groups)
.Supplementary reading:Bakeman, 2000 (Chapter 7 in Reis &")
Слайд 30Why Standardize ... ?
Example 2. Here are the students results (out
20, 15, 26, 32, 18, 28, 35, 14, 26, 22, 17
Most students didn't even get 30 out of 60, and most will fail.
The test must have been really hard, so the Prof decides to Standardize all the scores and only fail people 1 standard deviation below the mean.
How many students will fail?
Answer:
The Mean is 23, and the Standard Deviation is 6,6, and these are the Standard Scores:
-0,45, -1,21, 0,45, 1,36, -0,76, 0,76, 1,82, -1,36, 0,45, -0,15, -0,91
Only 2 students will fail (the ones who scored 15 and 14 on the test)
:20, 15,")