2.1 Basics of Functions
and Their Graphs
- Главная
- Разное
- Дизайн
- Бизнес и предпринимательство
- Аналитика
- Образование
- Развлечения
- Красота и здоровье
- Финансы
- Государство
- Путешествия
- Спорт
- Недвижимость
- Армия
- Графика
- Культурология
- Еда и кулинария
- Лингвистика
- Английский язык
- Астрономия
- Алгебра
- Биология
- География
- Детские презентации
- Информатика
- История
- Литература
- Маркетинг
- Математика
- Медицина
- Менеджмент
- Музыка
- МХК
- Немецкий язык
- ОБЖ
- Обществознание
- Окружающий мир
- Педагогика
- Русский язык
- Технология
- Физика
- Философия
- Химия
- Шаблоны, картинки для презентаций
- Экология
- Экономика
- Юриспруденция
Basics of functions and their graphs презентация
Содержание
- 1. Basics of functions and their graphs
- 2. Find the domain and range of a
- 3. Definition of a Relation A relation is
- 4. Example: Finding the Domain and Range of
- 5. Definition of a Function A function is
- 6. Example: Determining Whether a Relation is a
- 7. Functions as Equations If an equation is
- 8. Example: Determining Whether an Equation Represents a
- 9. Function Notation The special notation f(x), read
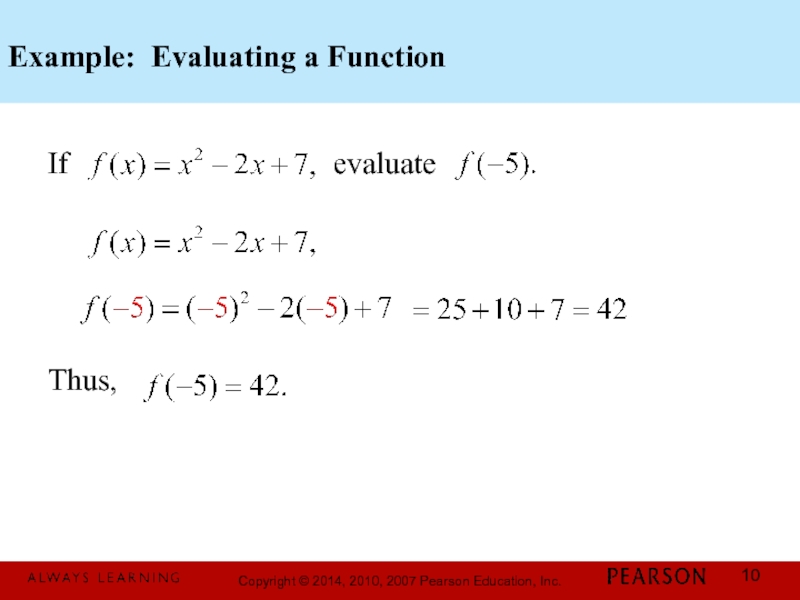
- 10. Example: Evaluating a Function If
- 11. Graphs of Functions The graph of a function is the graph of its ordered pairs.
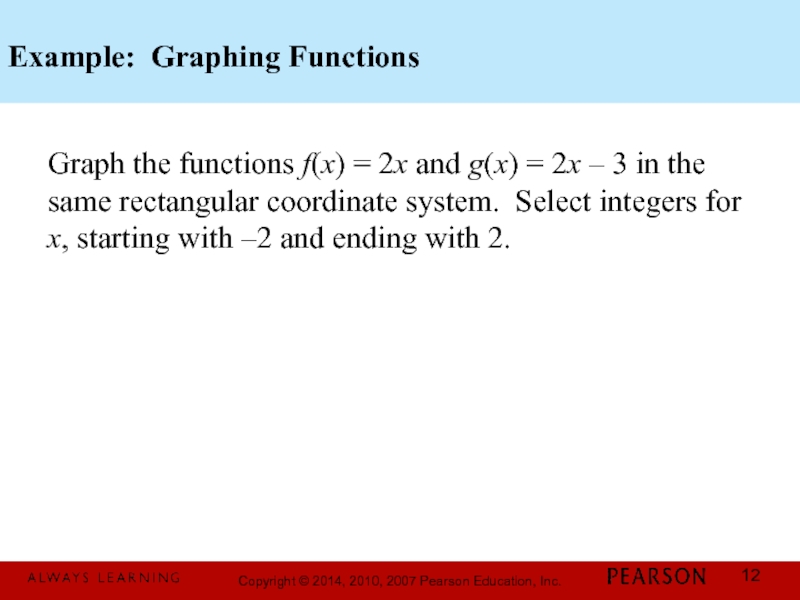
- 12. Example: Graphing Functions Graph the functions f(x)
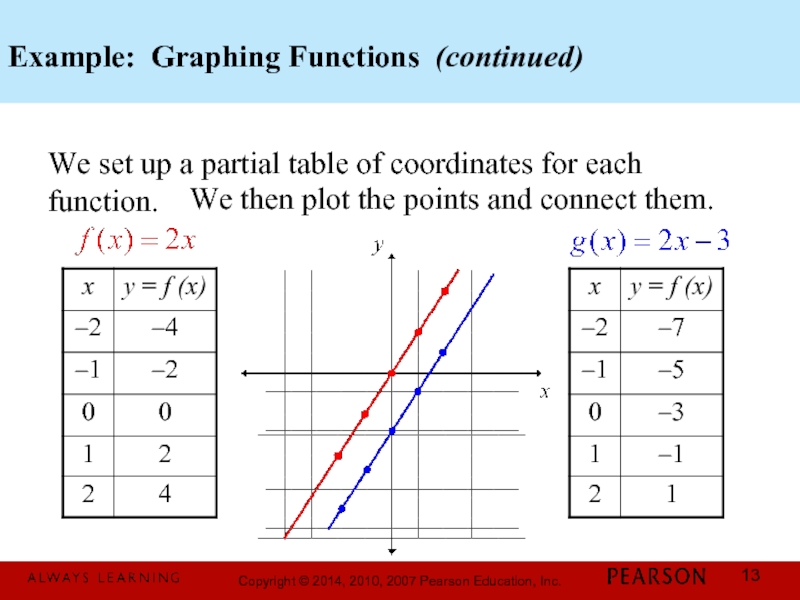
- 13. Example: Graphing Functions (continued) We set up
- 14. The Vertical Line Test for Functions If
- 15. Example: Using the Vertical Line Test Use
- 16. Example: Analyzing the Graph of a Function
- 17. Identifying Domain and Range from a Function’s
- 18. Example: Identifying the Domain and Range of
- 19. Example: Identifying the Domain and Range of
- 20. Identifying Intercepts from a Function’s Graph To
- 21. Example: Identifying Intercepts from a Function’s Graph
Слайд 1 Chapter 2
Functions and Graphs
Copyright © 2014, 2010, 2007 Pearson Education,
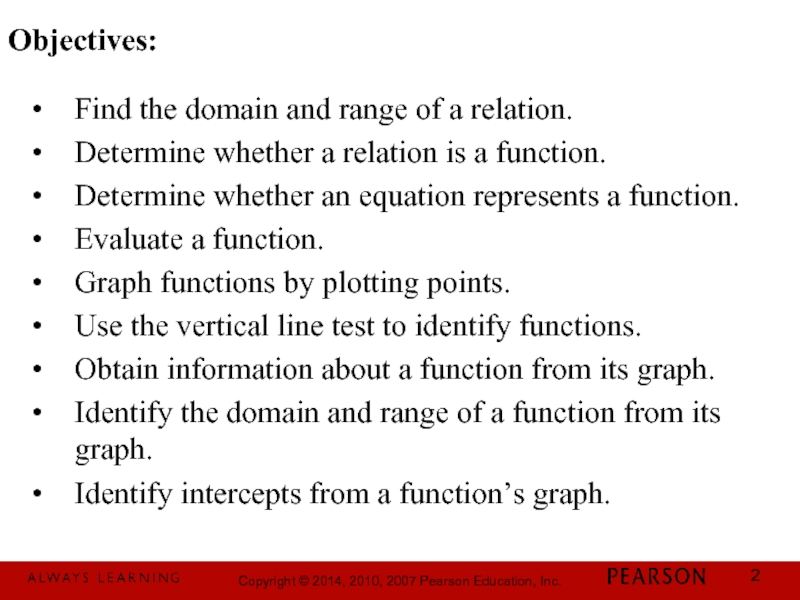
Слайд 2Find the domain and range of a relation.
Determine whether a relation
Determine whether an equation represents a function.
Evaluate a function.
Graph functions by plotting points.
Use the vertical line test to identify functions.
Obtain information about a function from its graph.
Identify the domain and range of a function from its graph.
Identify intercepts from a function’s graph.
Objectives:
Слайд 3Definition of a Relation
A relation is any set of ordered pairs.
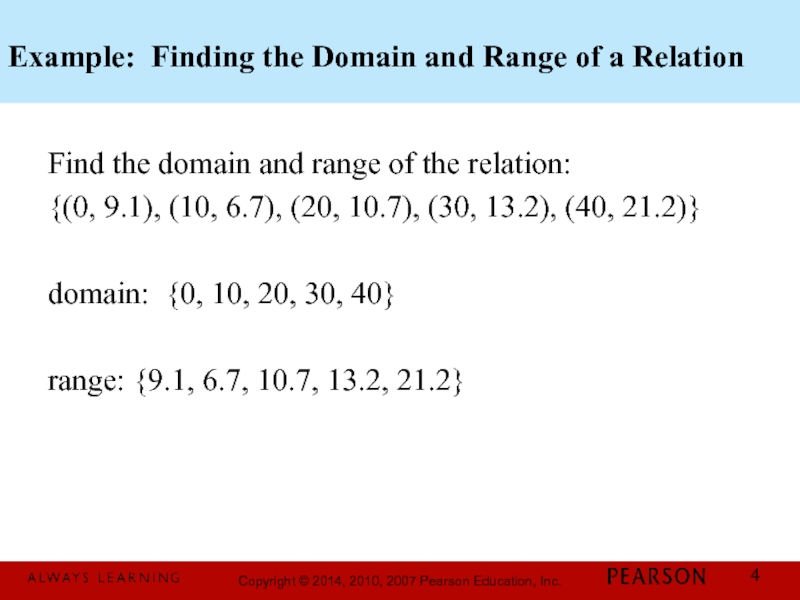
Слайд 4Example: Finding the Domain and Range of a Relation
Find the domain
{(0, 9.1), (10, 6.7), (20, 10.7), (30, 13.2), (40, 21.2)}
domain: {0, 10, 20, 30, 40}
range: {9.1, 6.7, 10.7, 13.2, 21.2}
Слайд 5Definition of a Function
A function is a correspondence from a first
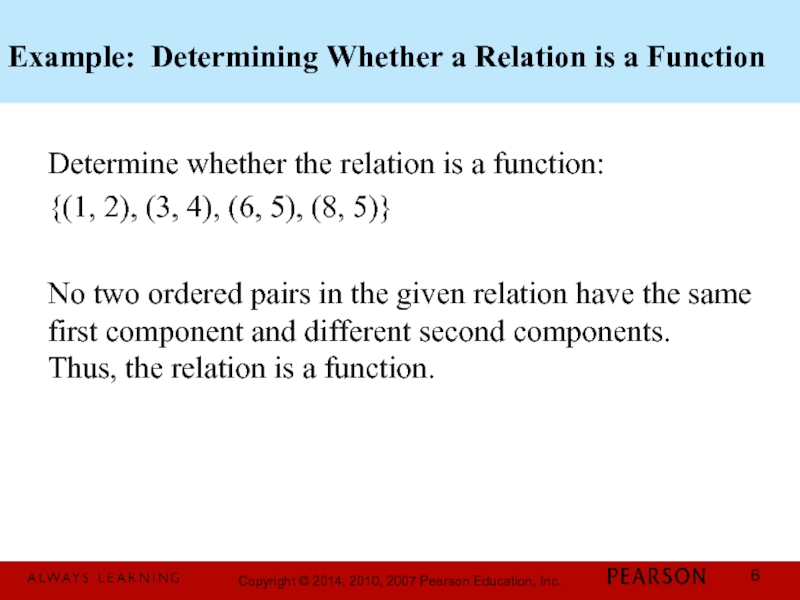
Слайд 6Example: Determining Whether a Relation is a Function
Determine whether the relation
{(1, 2), (3, 4), (6, 5), (8, 5)}
No two ordered pairs in the given relation have the same first component and different second components. Thus, the relation is a function.
Слайд 7Functions as Equations
If an equation is solved for y and more
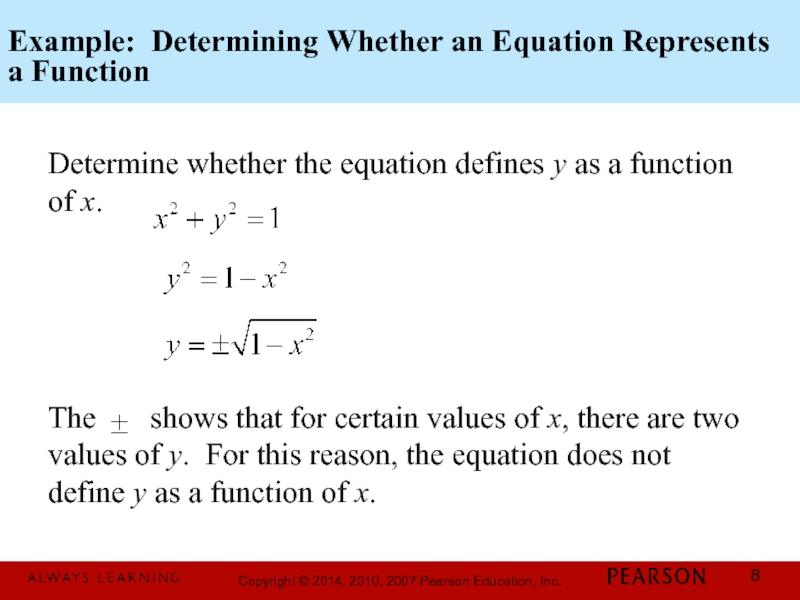
Слайд 8Example: Determining Whether an Equation Represents a Function
Determine whether the equation
The shows that for certain values of x, there are two values of y. For this reason, the equation does not define y as a function of x.
Слайд 9Function Notation
The special notation f(x), read “f of x” or “f
Слайд 12Example: Graphing Functions
Graph the functions f(x) = 2x and g(x) =
Слайд 13Example: Graphing Functions (continued)
We set up a partial table of coordinates
We then plot the points and connect them.
Слайд 14The Vertical Line Test for Functions
If any vertical line intersects a
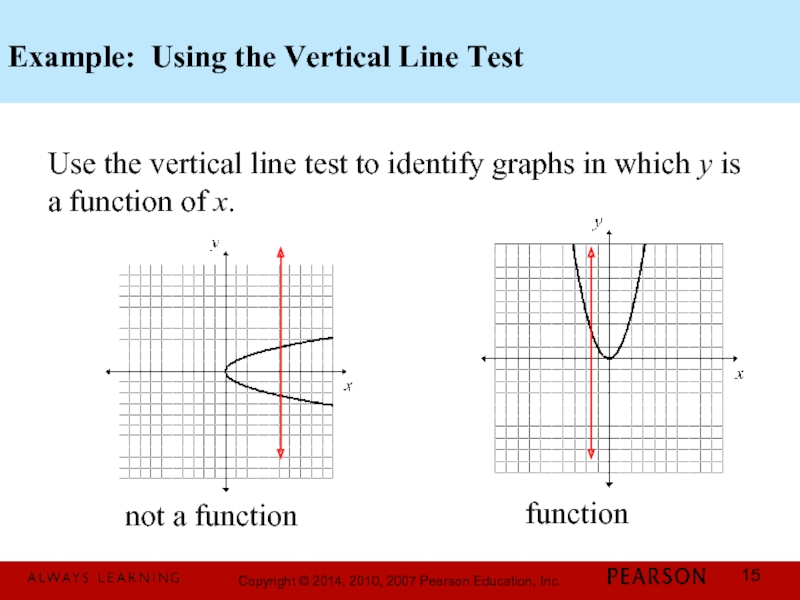
Слайд 15Example: Using the Vertical Line Test
Use the vertical line test to
not a function
function
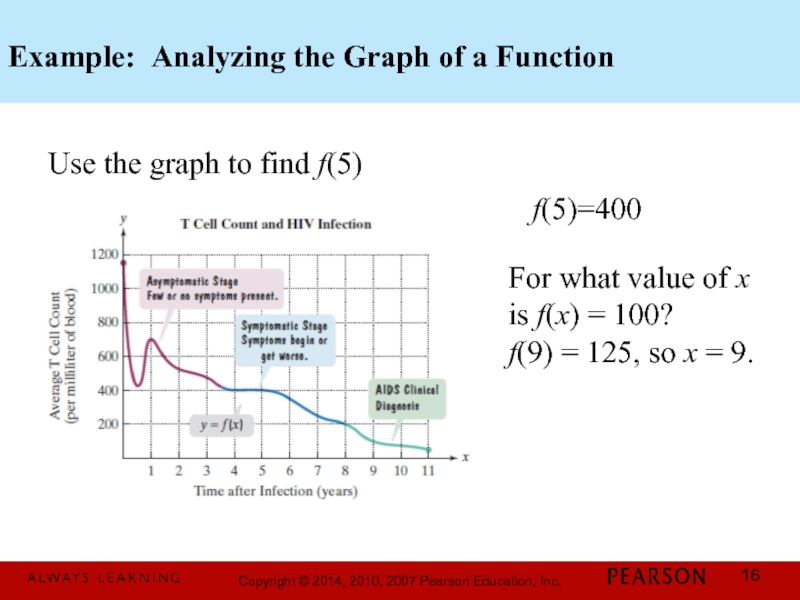
Слайд 16Example: Analyzing the Graph of a Function
Use the graph to
For what value of x
is f(x) = 100?
f(9) = 125, so x = 9.
f(5)=400
Слайд 17Identifying Domain and Range from a Function’s Graph
To find the domain
To find the range of a function from it’s graph, look for all the outputs on the y-axis that correspond to points on the graph.
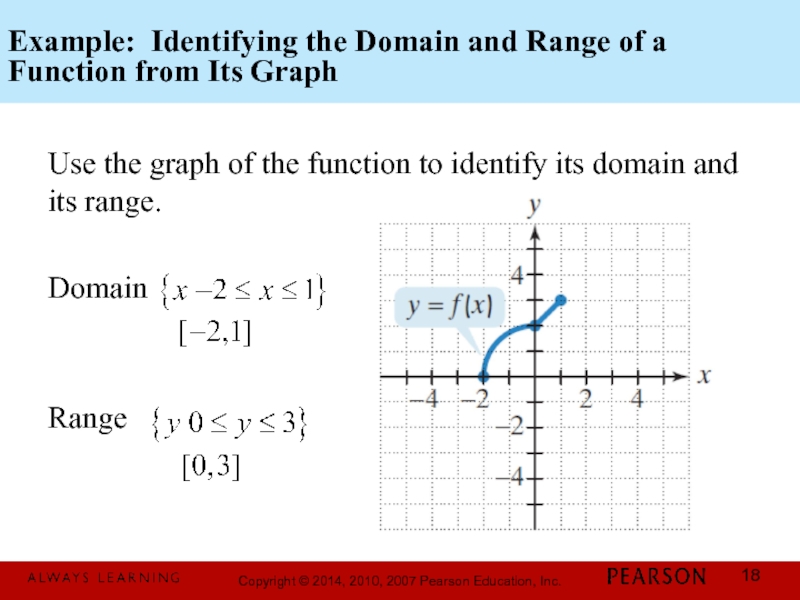
Слайд 18Example: Identifying the Domain and Range of a Function from Its
Use the graph of the function to identify its domain and its range.
Domain
Range
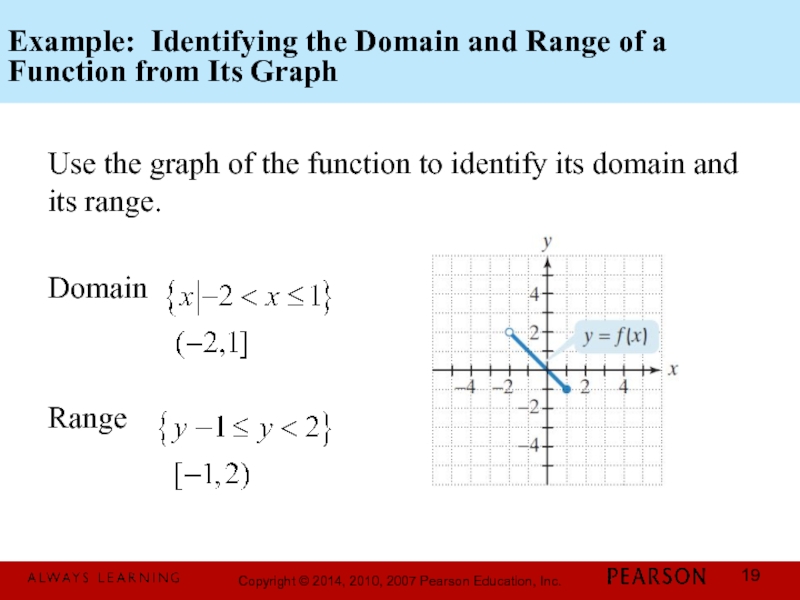
Слайд 19Example: Identifying the Domain and Range of a Function from Its
Use the graph of the function to identify its domain and its range.
Domain
Range
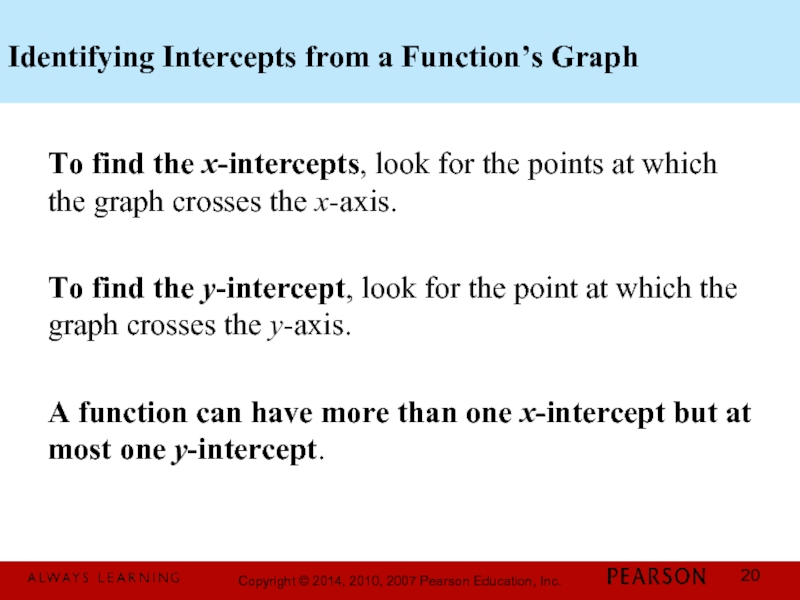
Слайд 20Identifying Intercepts from a Function’s Graph
To find the x-intercepts, look for
To find the y-intercept, look for the point at which the graph crosses the y-axis.
A function can have more than one x-intercept but at most one y-intercept.
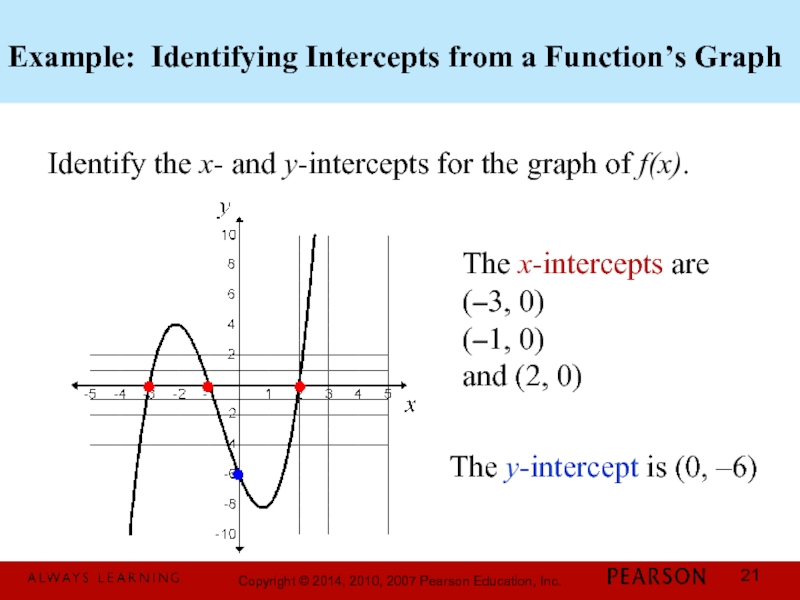
Слайд 21Example: Identifying Intercepts from a Function’s Graph
Identify the x- and y-intercepts
The x-intercepts are
(–3, 0)
(–1, 0)
and (2, 0)
The y-intercept is (0, –6)

