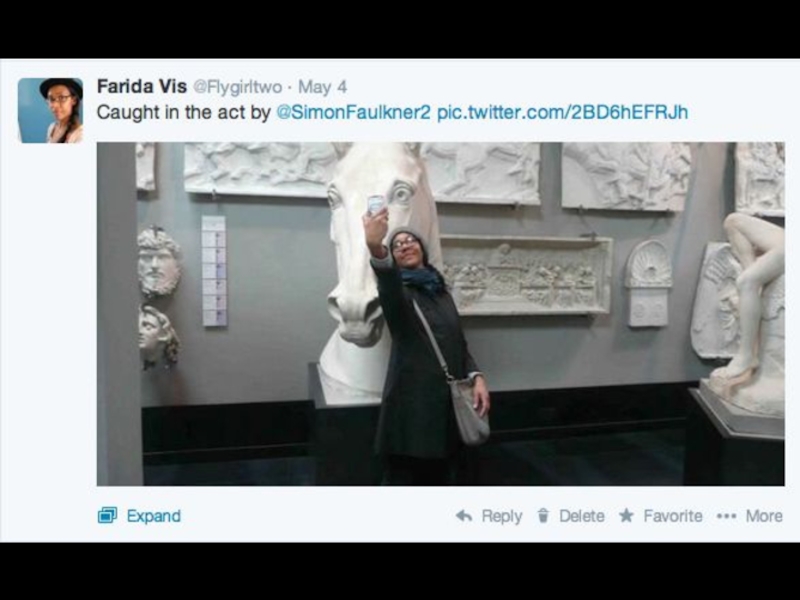
Farida Vis, Information School
University of Sheffield
@flygirltwo
- Главная
- Разное
- Дизайн
- Бизнес и предпринимательство
- Аналитика
- Образование
- Развлечения
- Красота и здоровье
- Финансы
- Государство
- Путешествия
- Спорт
- Недвижимость
- Армия
- Графика
- Культурология
- Еда и кулинария
- Лингвистика
- Английский язык
- Астрономия
- Алгебра
- Биология
- География
- Детские презентации
- Информатика
- История
- Литература
- Маркетинг
- Математика
- Медицина
- Менеджмент
- Музыка
- МХК
- Немецкий язык
- ОБЖ
- Обществознание
- Окружающий мир
- Педагогика
- Русский язык
- Технология
- Физика
- Философия
- Химия
- Шаблоны, картинки для презентаций
- Экология
- Экономика
- Юриспруденция
From Flickr to Snapchat: The challenge of analysing images on social media презентация
Содержание
- 1. From Flickr to Snapchat: The challenge of analysing images on social media
- 2. Images posses the ability to grab our attention
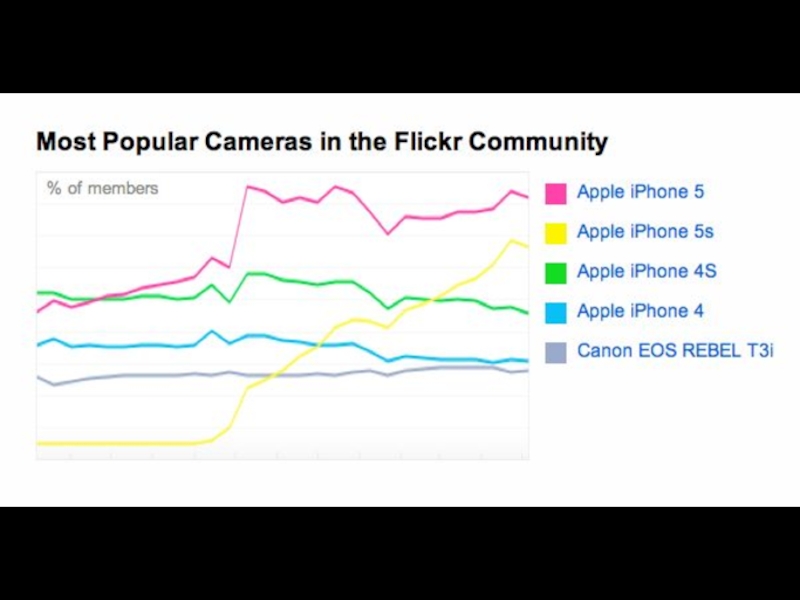
- 3. Social media companies know this
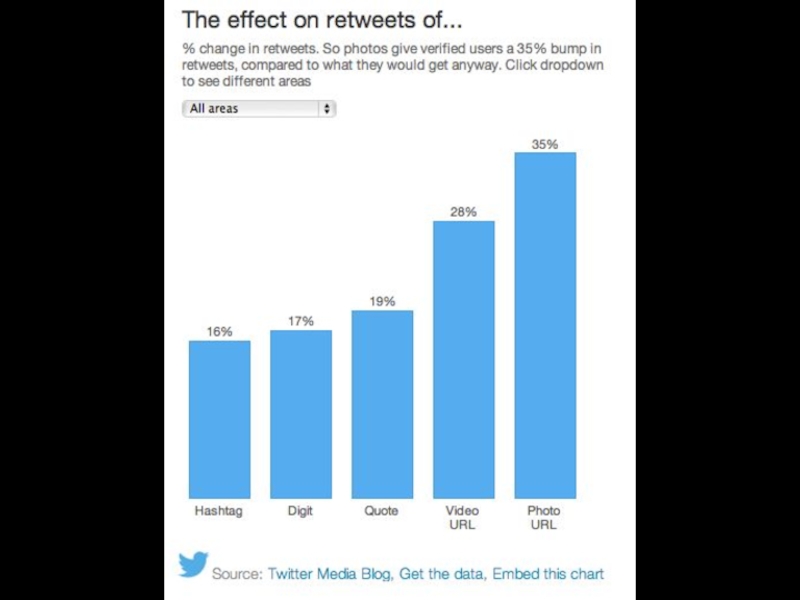
- 4. Images are key to engagement
- 5. 750 MILLION IMAGES SHARED DAILY
- 8. Camera: used to be
- 9. Everyday snaps Witnessing events
- 10. US 65% smartphone
- 11. UK: The over-55s
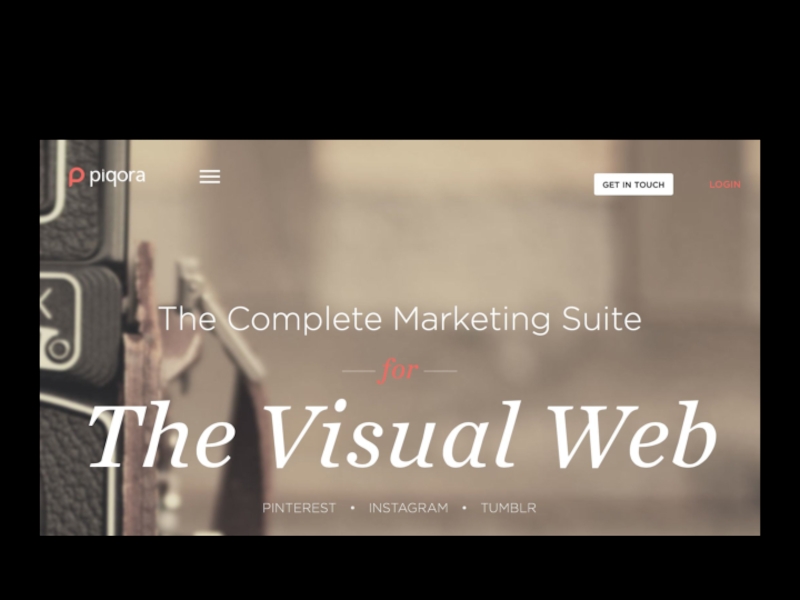
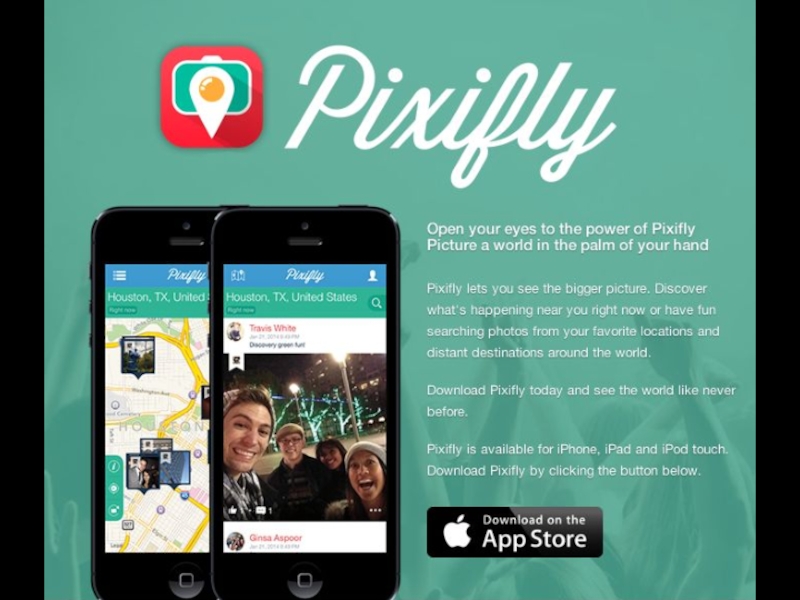
- 12. Rise of platforms and apps focused
- 13. Facebook daily image uploads: 350
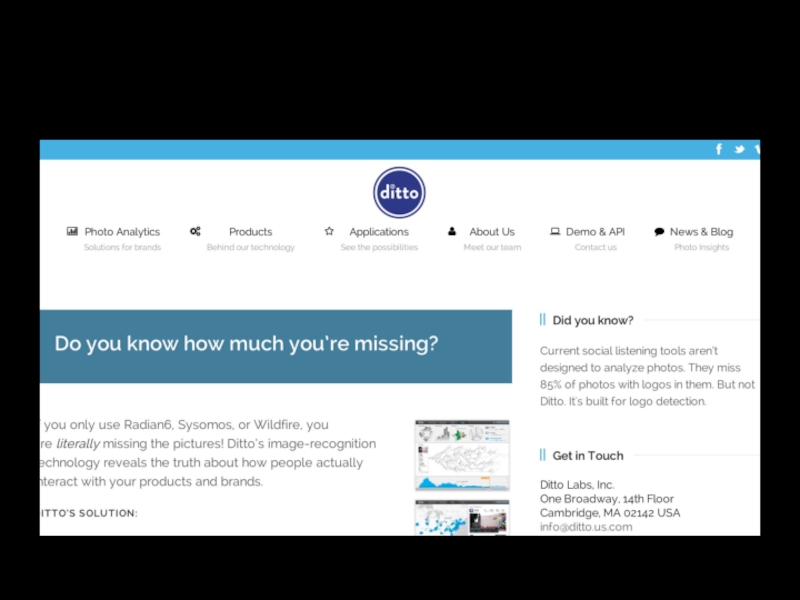
- 16. Images largely ignored in
- 21. Images in crisis communication
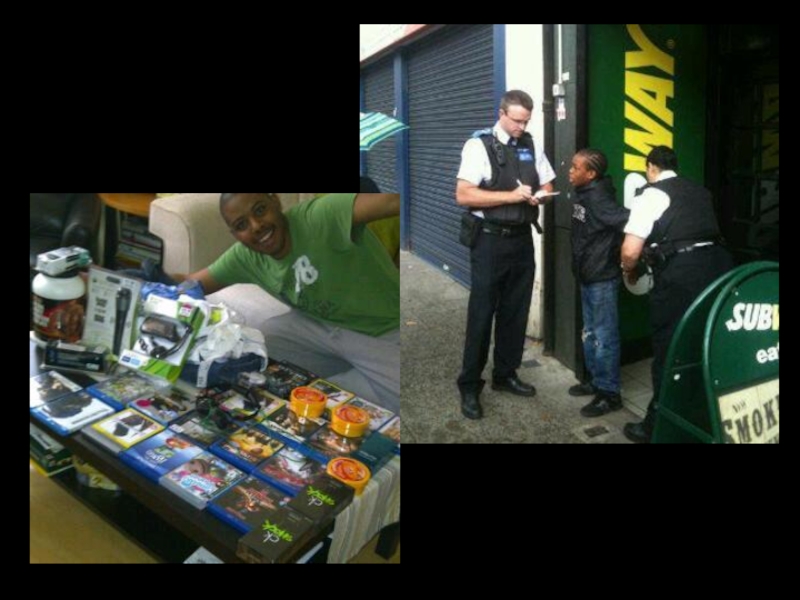
- 22. Social Reading the Riots, 2011 Social Users debunking rumours
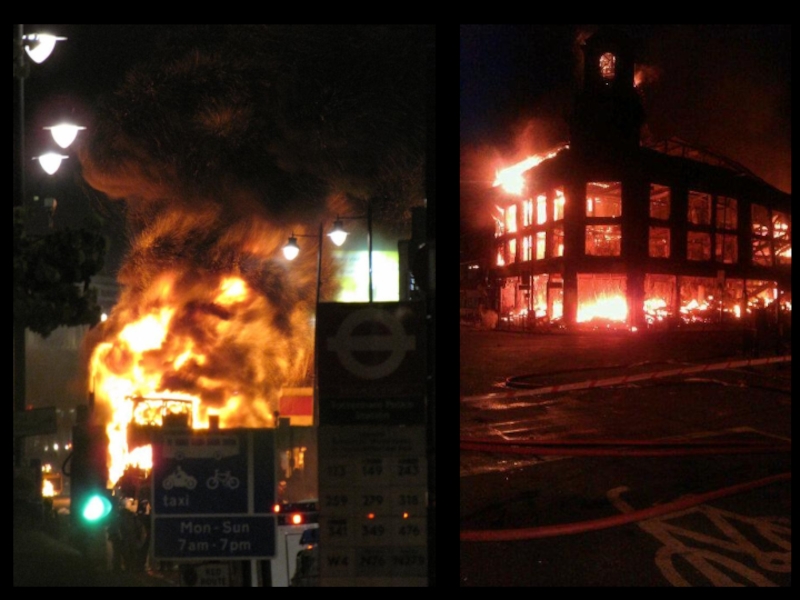
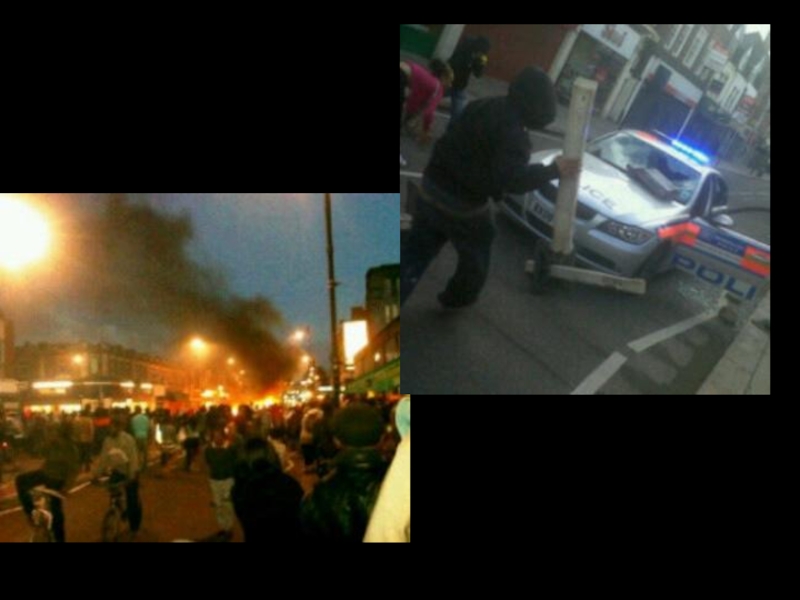
- 23. Image sharing during the 2011 UK riots
- 27. ‘Although the Twitter user chose the
- 28. The burning bus: 57 unique URLs
- 29. Hurricane Sandy Image sharing practices during crises: fakes
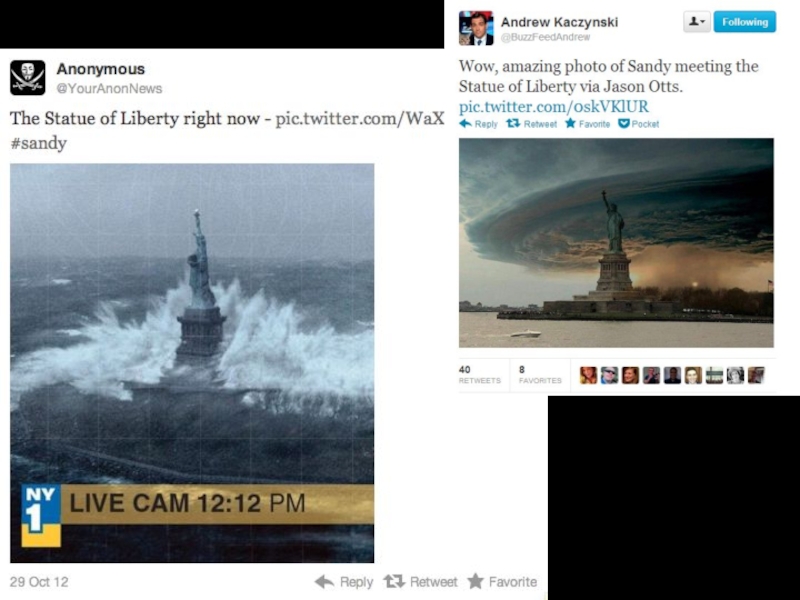
- 35. Hurricane Sandy images Fake as
- 36. "Picturing the Social: transforming our understanding
- 37. Farida Vis (PI)
- 38. “Qualitative data on a quantitative scale” (D’Orazio, 2013)
- 39. Traditional broadcasting model Production of message
- 40. Building new theory and method Structures Users Content
- 41. Structures Users Content
- 42. How do social media companies make images visible?
- 43. Address the quantitative magnitude
- 44. Screen Shot 2014-07-09 at 06.05.51
- 45. Doing interdisciplinarity
- 46. Images shared on Twitter (natively uploaded)
- 53. Seeing like software/like a human
- 54. Direct Visualisation/Lev Manovich
- 55. Aby Warburg’s mnemosyne
- 56. visualsocialmedialab.org @VisSocMedLab f.vis@sheffield.ac.uk @flygirltwo
Слайд 1From Flickr to Snapchat: The challenge of analysing images on social
media


Слайд 10
US 65% smartphone penetration
Smartphones overtaken desktop usage to access the internet
Mobile
internet accounts for majority of internet use in US (57%)
Users typically access the internet via apps on mobile devices
All figures from comScore, US Digital Future in Focus, 2014
Users typically access the internet via apps on mobile devices
All figures from comScore, US Digital Future in Focus, 2014

Слайд 11
UK: The over-55s will experience the fastest year-on-year rises in smartphone
penetration.
Smartphone ownership should increase to about 50% by year-end, a 25% increase from 2013, but trailing 70% penetration among 18-54s.
The difference in smartphone penetration by age will disappear, but differences in usage of smartphones remain substantial. Many over 55s use smartphones like feature phones.
All figures from Deloitte, predictions for 2014

Слайд 12
Rise of platforms and apps focused on visual content
Pinterest
Tumblr
Instagram
Vine
Snapchat
‘Mobile first’ –>
‘… and only’ | simple easy, user friendly design

Слайд 13
Facebook daily image uploads: 350 million (November 2013)
Instagram daily image uploads:
60 million (March 2014)
Twitter: 500 million tweets daily (March 2014)
Snapchat daily snaps: 400 million (November 2013)
Twitter: 500 million tweets daily (March 2014)
Snapchat daily snaps: 400 million (November 2013)
Instagram daily image uploads: 60 million (March 2014)Twitter:")
Слайд 16
Images largely ignored in
social media research
Not easy to ‘mine’
Hard to
figure out meaning
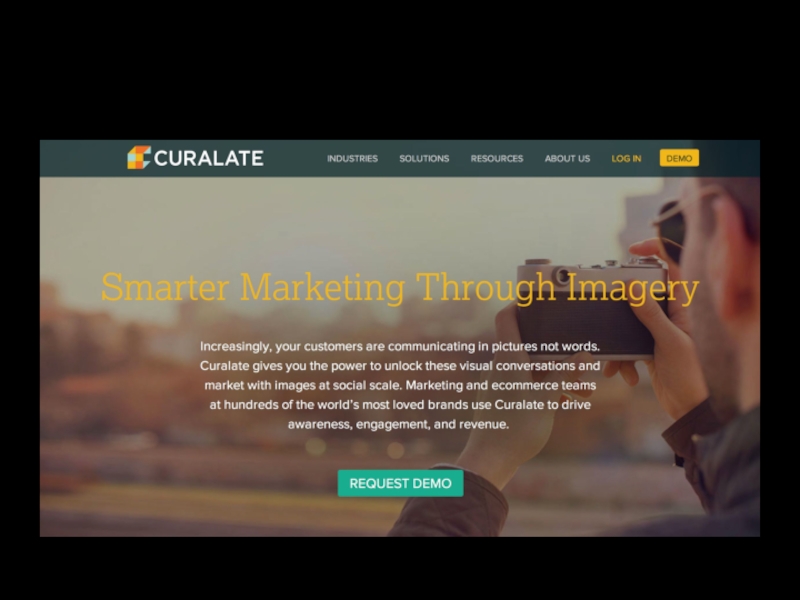
Huge interest in industry
Huge interest in industry


Слайд 27
‘Although the Twitter user chose the viewing position and shared the
image through Yfrog the original image data was created by one of Google’s ‘numerous data collection vehicles’ using their R5 ‘panoramic camera system’’ (Anguelov et al., 2010, pp. 32-33).


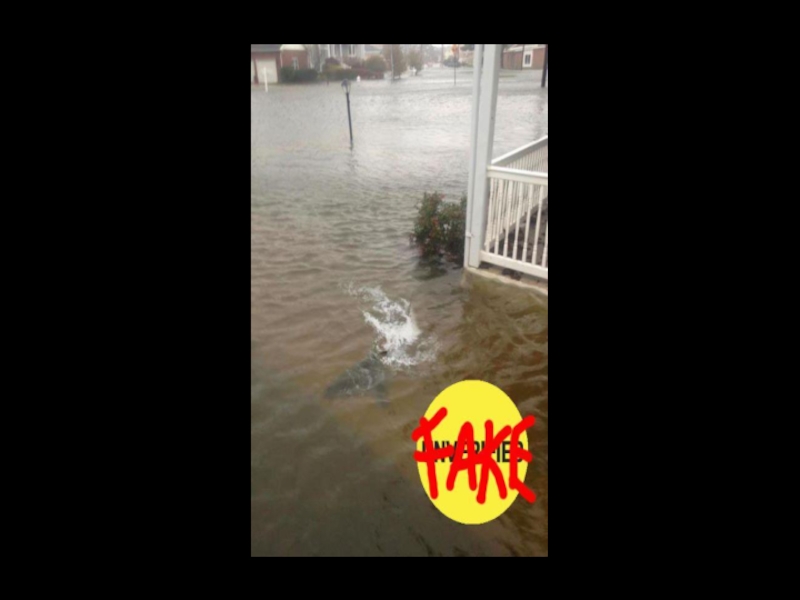

Слайд 34 #FakeSandy pics 250,000 tweets (4hrs) 1 weekend http://istwitterwrong.tumblr.com/ ‘fakes’ What is shared by
locals vs wider social media audiences/users?
Where in the ‘long tail’ might we find useful information?
Most visible ≠ most valuable
 1")
Слайд 35Hurricane Sandy images
Fake as in Photoshopped
Fake as in still from Hollywood
disaster movie
Fake as in not what we think we’re looking at
Perceived fake, but in fact real
Intensions of users? What do we think they are doing?
Fake as in not what we think we’re looking at
Perceived fake, but in fact real
Intensions of users? What do we think they are doing?

Слайд 36
"Picturing the Social: transforming our understanding of images in social media
and Big Data research.”
ESRC Transformative Research grant
ESRC Transformative Research grant
Слайд 37
Farida Vis (PI) – Media and Communication
Simon Faulkner – Art History/Visual
Culture
James Aulich - Art History/Visual Culture
Olga Gorgiunova – Software Studies/Sociology
Mike Thelwall – Information Science/software
Francesco D’Orazio – Industry/Media/software
+ Research Associate – Digital Ethnography
James Aulich - Art History/Visual Culture
Olga Gorgiunova – Software Studies/Sociology
Mike Thelwall – Information Science/software
Francesco D’Orazio – Industry/Media/software
+ Research Associate – Digital Ethnography
 – Media and CommunicationSimon Faulkner – Art History/Visual CultureJames Aulich - Art")
")


Слайд 43
Address the quantitative magnitude and the qualitative intensity of social media
image production and circulation


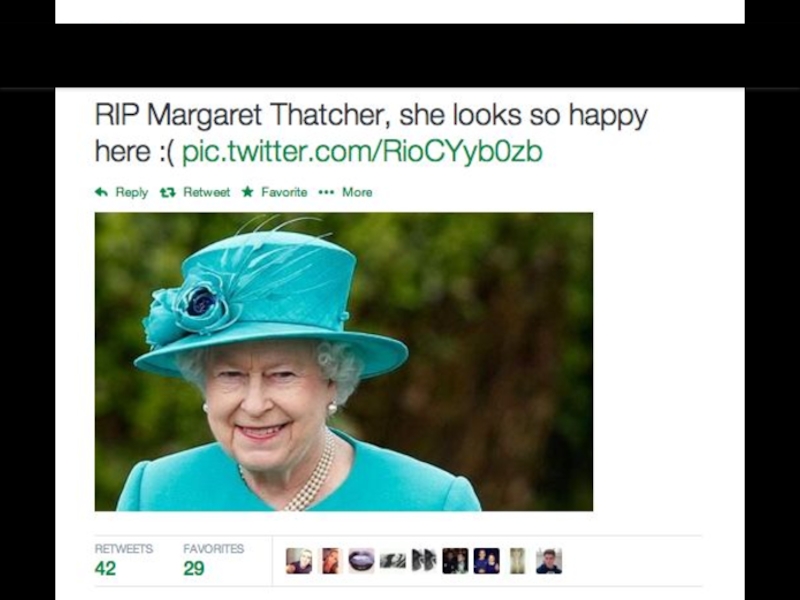
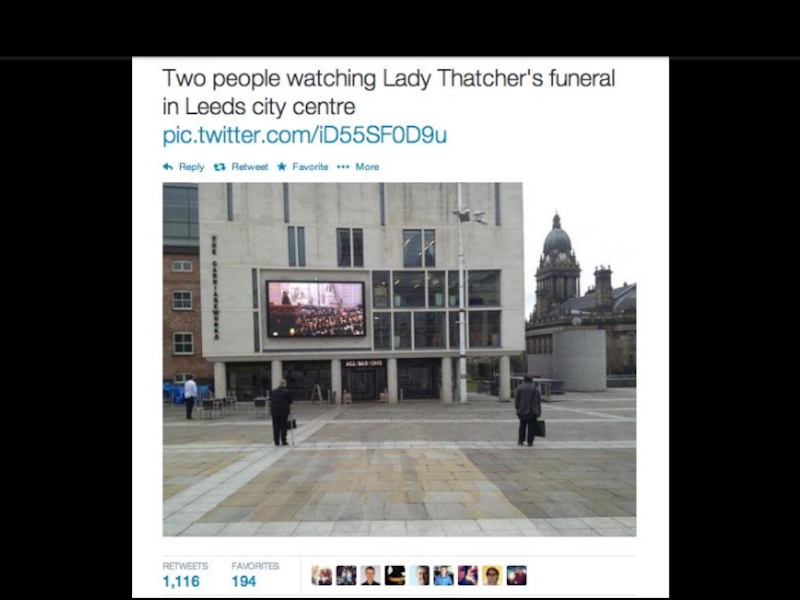
Слайд 46
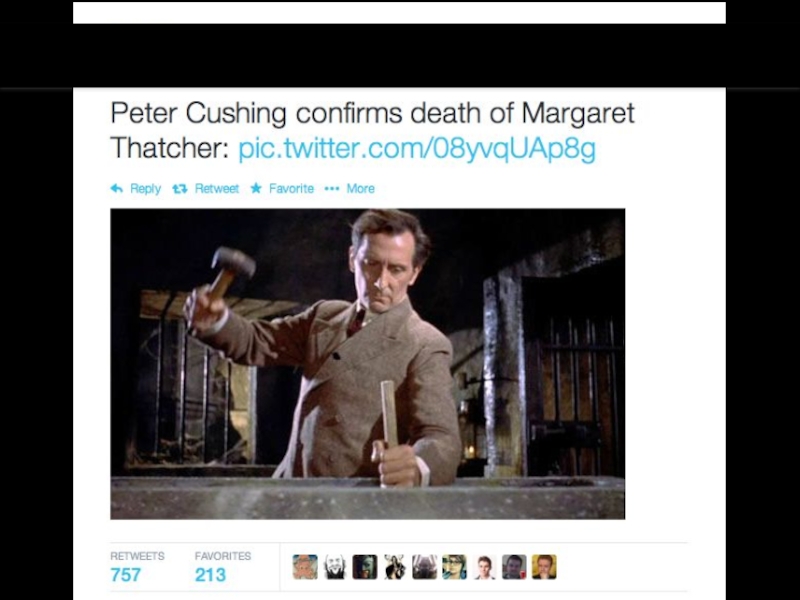
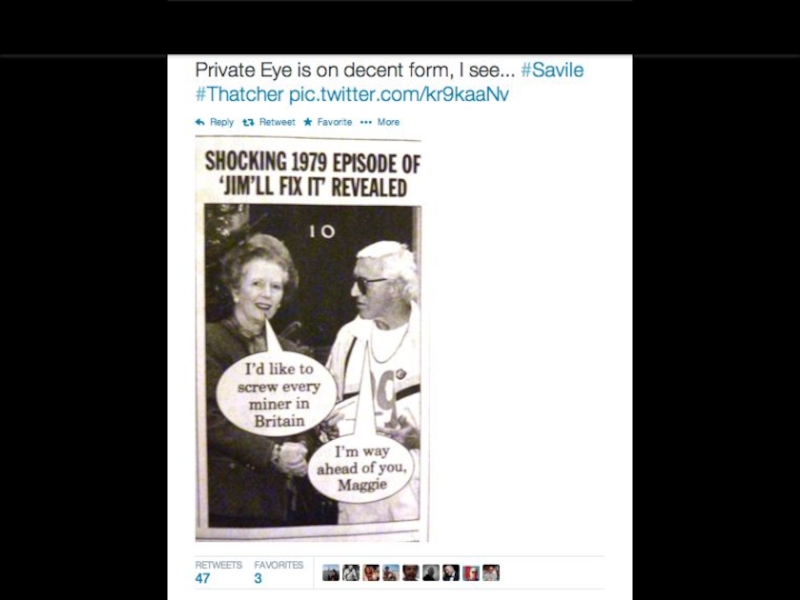
Images shared on Twitter (natively uploaded) around the death and funeral
of Margaret Thatcher
150,000 tweets
17,000 different images
150,000 tweets
17,000 different images
 around the death and funeral of Margaret Thatcher150,000 tweets17,000")
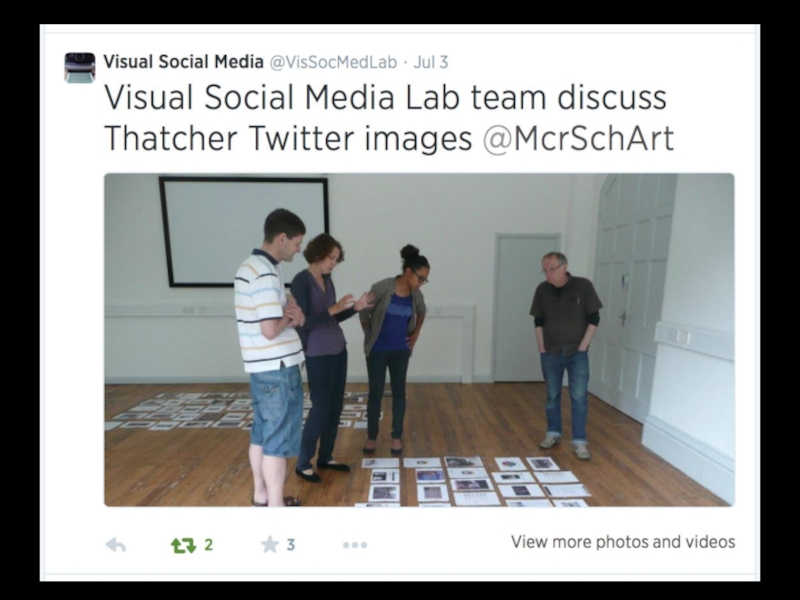
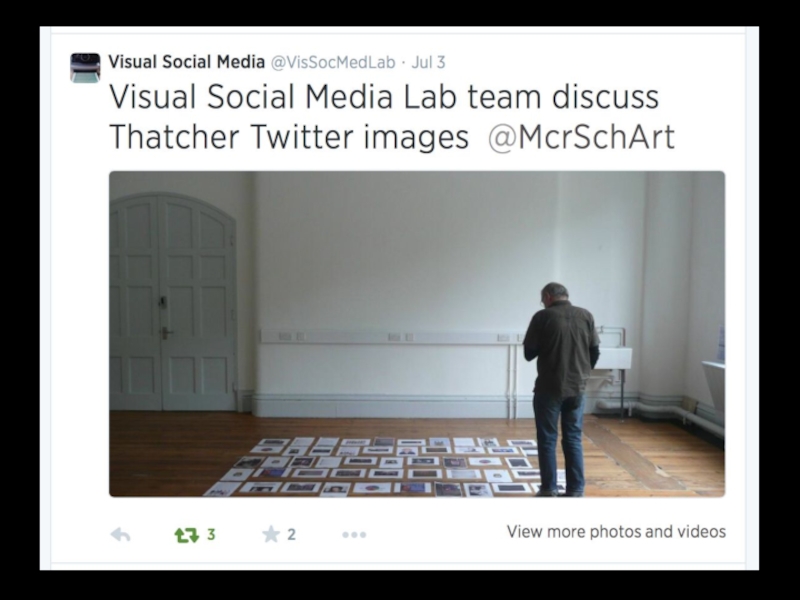
Слайд 53
Seeing like software/like a human
How are images sorted and organised?
How do
we select what to look at?
How do these images circulate/
Where have they come from?
How do we (re)present them?
How do these images circulate/
Where have they come from?
How do we (re)present them?