- Главная
- Разное
- Дизайн
- Бизнес и предпринимательство
- Аналитика
- Образование
- Развлечения
- Красота и здоровье
- Финансы
- Государство
- Путешествия
- Спорт
- Недвижимость
- Армия
- Графика
- Культурология
- Еда и кулинария
- Лингвистика
- Английский язык
- Астрономия
- Алгебра
- Биология
- География
- Детские презентации
- Информатика
- История
- Литература
- Маркетинг
- Математика
- Медицина
- Менеджмент
- Музыка
- МХК
- Немецкий язык
- ОБЖ
- Обществознание
- Окружающий мир
- Педагогика
- Русский язык
- Технология
- Физика
- Философия
- Химия
- Шаблоны, картинки для презентаций
- Экология
- Экономика
- Юриспруденция
A Study of Top Brands Across 13 Verticals презентация
Содержание
- 1. A Study of Top Brands Across 13 Verticals
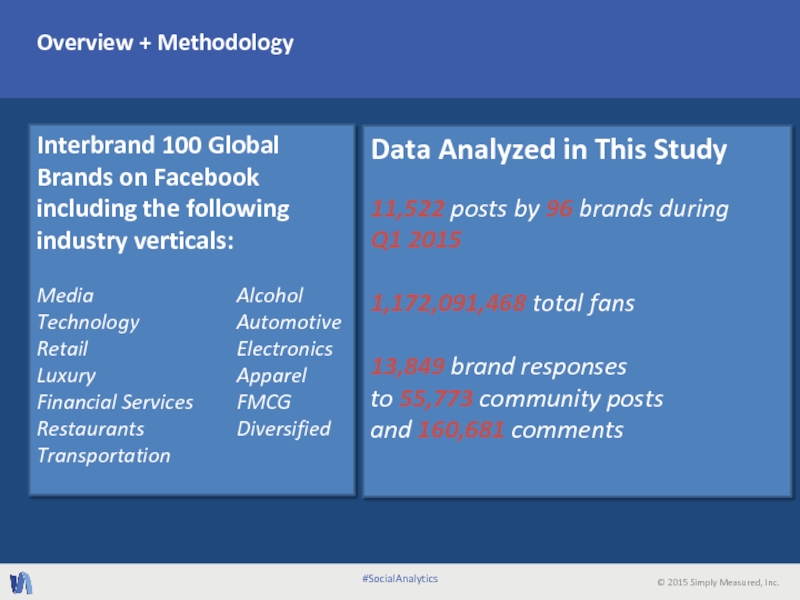
- 2. Overview + Methodology Interbrand 100 Global Brands
- 3. Vertical Comparisons
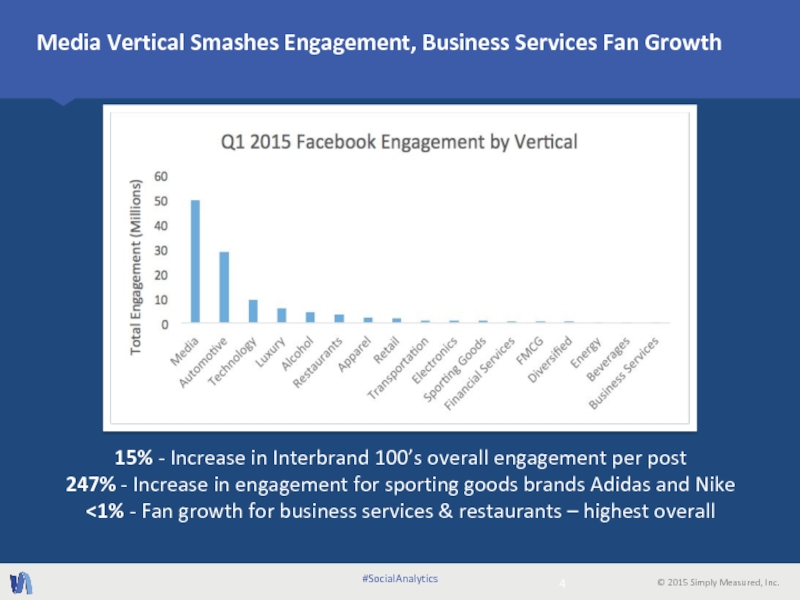
- 4. 15% - Increase in Interbrand 100’s overall
- 5. 2,467 - Number of times retail brands
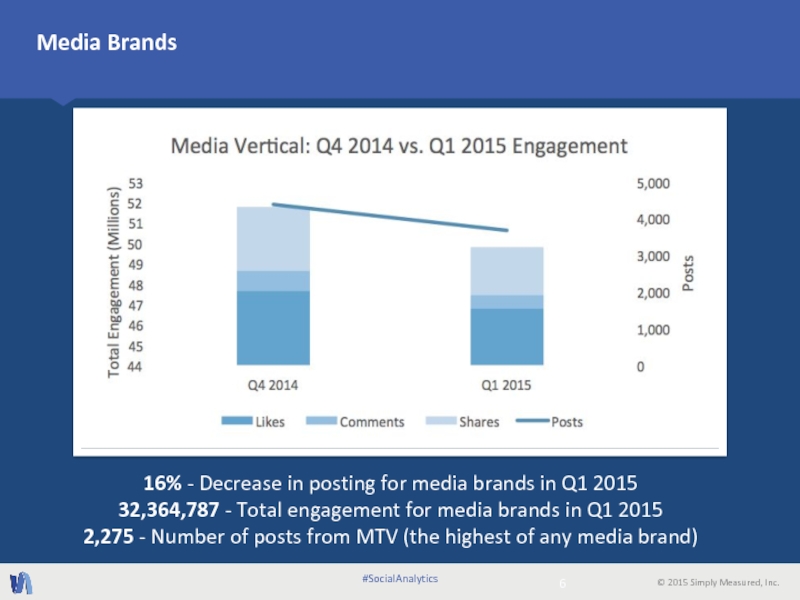
- 6. 16% - Decrease in posting for media
- 7. 40% - Decrease in posting in Q1
- 8. Vertical Close-Ups
- 9. 32% - Decrease in posting
- 10. • Longer videos that pulled at the
- 11. 9% - Increase in posting in Q1
- 12. 0% - Increase in posting in Q1
- 13. 113% - Increase
- 14. • Gratitude towards fans • Facebook
- 15. 27% - Decrease in brand posts in
- 16. 13% - Decrease in brand posts in
- 17. 16% - Increase in brand posts in
- 18. 2% - Decrease in brand posts in
- 19. 12% - Decrease in brand posts in
- 20. 24% - Increase in brand posts in
- 21. 104% - Increase in posts in
- 22. • Building on excitement around popular holidays
- 23. 12% - Decrease in brand posts in
- 24. 1% - Decrease in brand posts in
- 25. 124% - Increase in brand posts in
- 26. • Visually stunning, science-based videos which suavely
- 27. 33% - Decrease in brand posts in
- 28. Simply Measured is the most complete social
Слайд 2Overview + Methodology
Interbrand 100 Global Brands on Facebook including the following
Media Alcohol
Technology Automotive
Retail Electronics
Luxury Apparel
Financial Services FMCG
Restaurants Diversified
Transportation
#SocialAnalytics
Data Analyzed in This Study
11,522 posts by 96 brands during
Q1 2015
1,172,091,468 total fans
13,849 brand responses
to 55,773 community posts
and 160,681 comments
Слайд 415% - Increase in Interbrand 100’s overall engagement per post
247%
<1% - Fan growth for business services & restaurants – highest overall
Media Vertical Smashes Engagement, Business Services Fan Growth
#SocialAnalytics
Слайд 52,467 - Number of times retail brands responded to Facebook users
1 - Number of times sporting goods brands responded
4 - Average response time (hours) for electronics brands
Retail and Automotive Respond Most, Electronics and Media Fastest
#SocialAnalytics
Слайд 616% - Decrease in posting for media brands in Q1 2015
32,364,787 - Total engagement for media brands in Q1 2015
2,275 - Number of posts from MTV (the highest of any media brand)
Media Brands
#SocialAnalytics
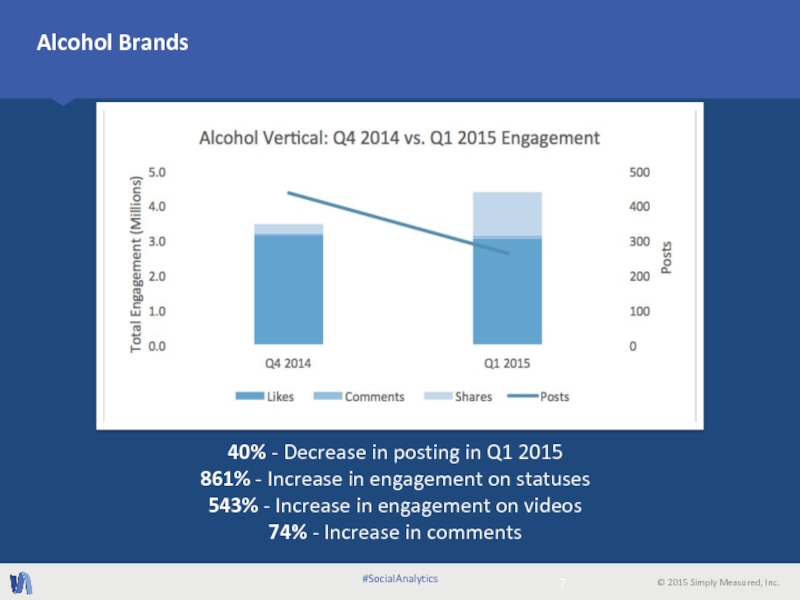
Слайд 740% - Decrease in posting in Q1 2015
861% - Increase
543% - Increase in engagement on videos
74% - Increase in comments
Alcohol Brands
#SocialAnalytics
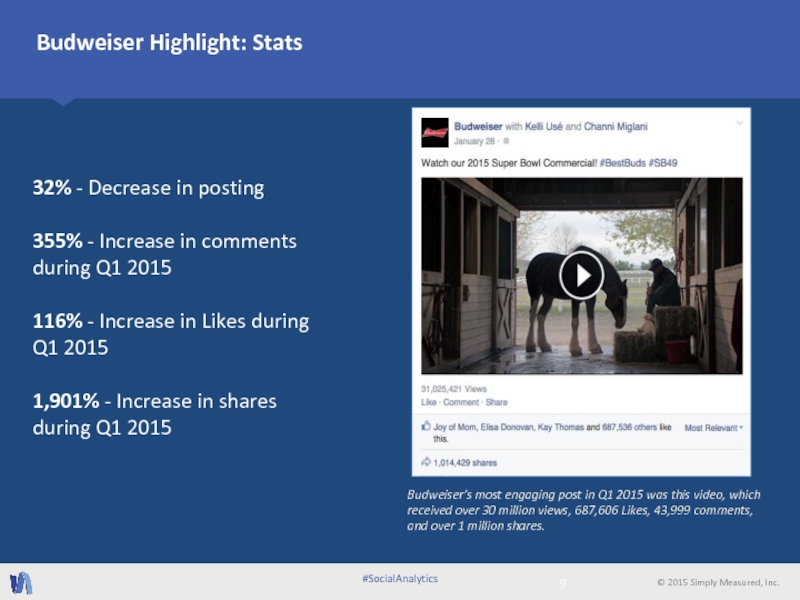
Слайд 932% - Decrease in posting
355% - Increase in comments
during
116% - Increase in Likes during
Q1 2015
1,901% - Increase in shares
during Q1 2015
Budweiser Highlight: Stats
#SocialAnalytics
Budweiser’s most engaging post in Q1 2015 was this video, which received over 30 million views, 687,606 Likes, 43,999 comments,
and over 1 million shares.
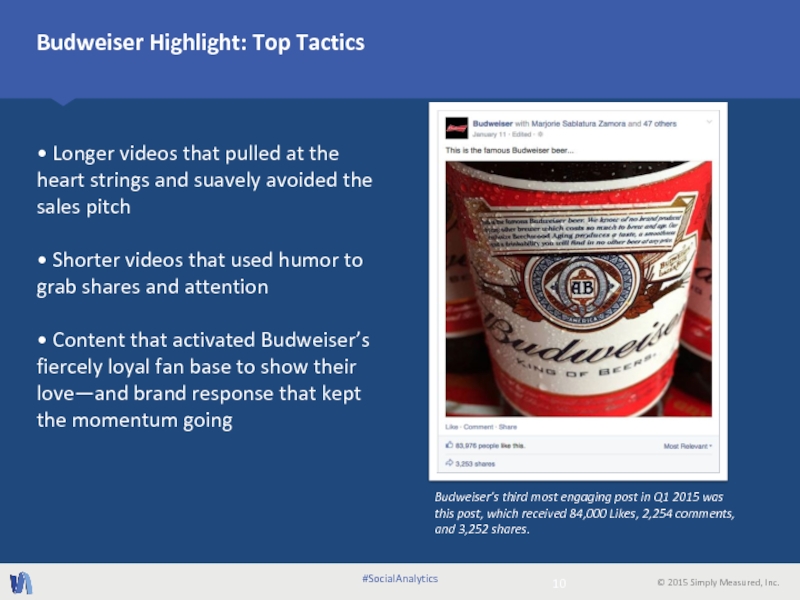
Слайд 10• Longer videos that pulled at the heart strings and suavely
• Shorter videos that used humor to grab shares and attention
• Content that activated Budweiser’s fiercely loyal fan base to show their love—and brand response that kept the momentum going
Budweiser Highlight: Top Tactics
#SocialAnalytics
Budweiser’s third most engaging post in Q1 2015 was this post, which received 84,000 Likes, 2,254 comments, and 3,252 shares.
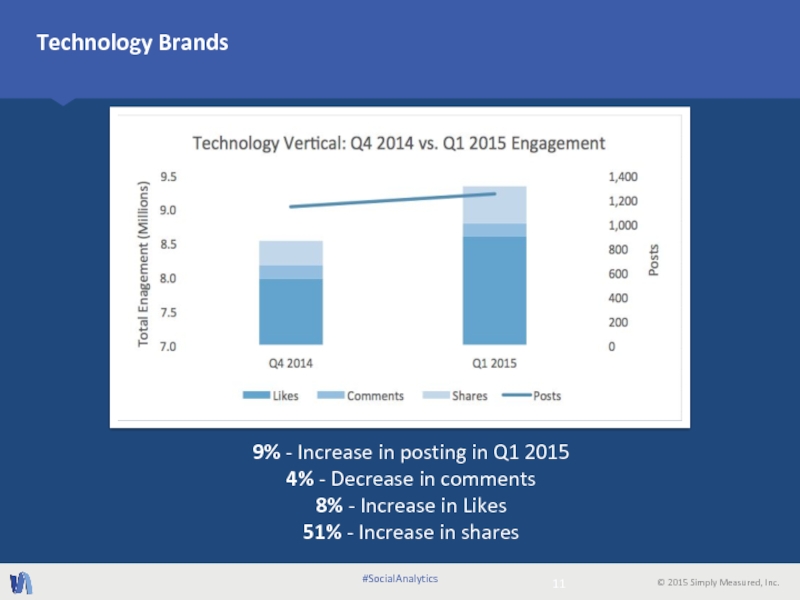
Слайд 119% - Increase in posting in Q1 2015
4% - Decrease
8% - Increase in Likes
51% - Increase in shares
Technology Brands
#SocialAnalytics
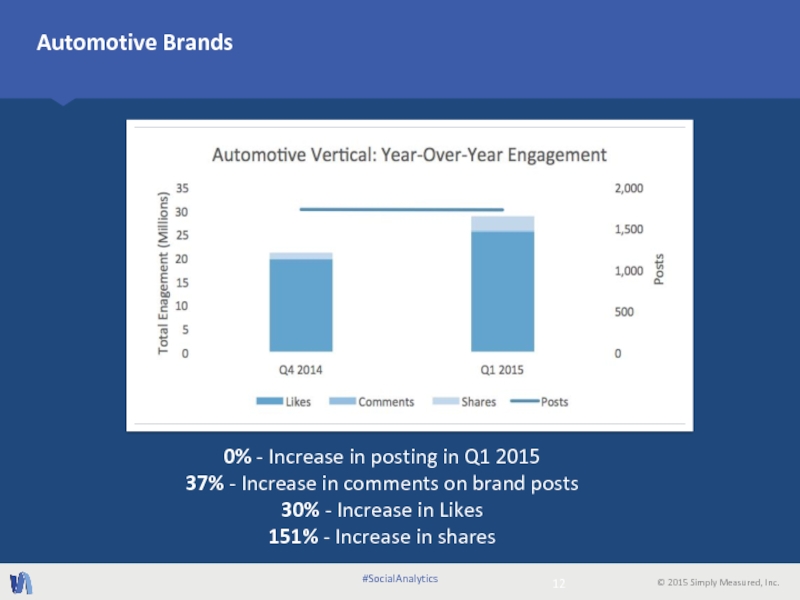
Слайд 120% - Increase in posting in Q1 2015
37% - Increase in
30% - Increase in Likes
151% - Increase in shares
Automotive Brands
#SocialAnalytics
Слайд 13
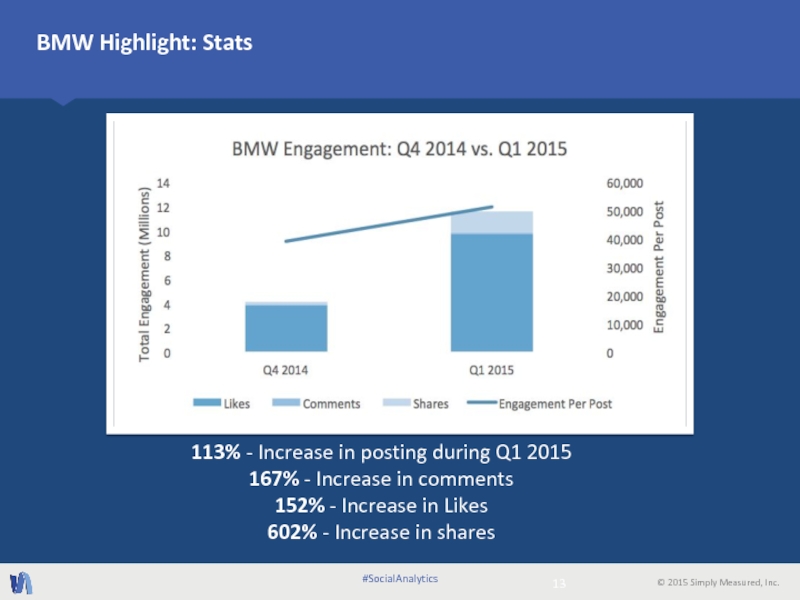
113% - Increase in posting during Q1 2015
167% - Increase
152% - Increase in Likes
602% - Increase in shares
BMW Highlight: Stats
#SocialAnalytics
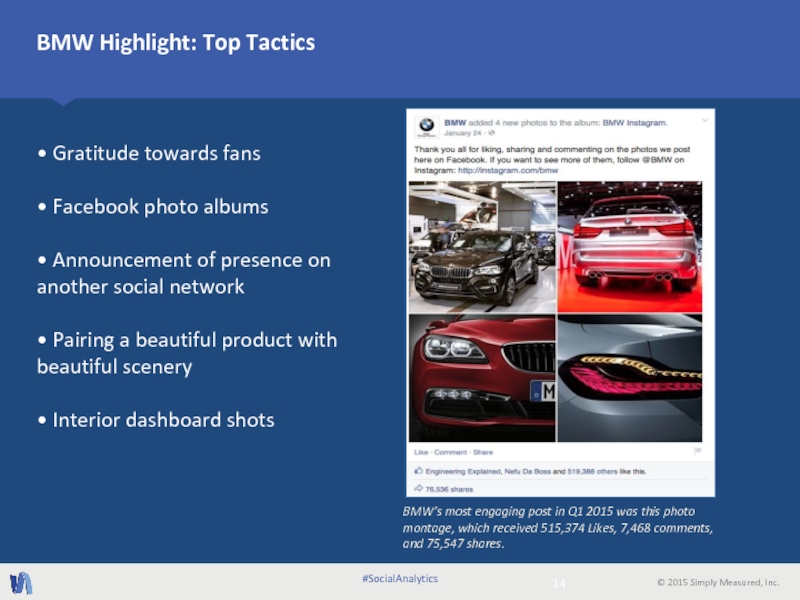
Слайд 14• Gratitude towards fans
• Facebook photo albums
• Announcement of presence on
• Pairing a beautiful product with beautiful scenery
• Interior dashboard shots
BMW Highlight: Top Tactics
#SocialAnalytics
BMW’s most engaging post in Q1 2015 was this photo montage, which received 515,374 Likes, 7,468 comments,
and 75,547 shares.
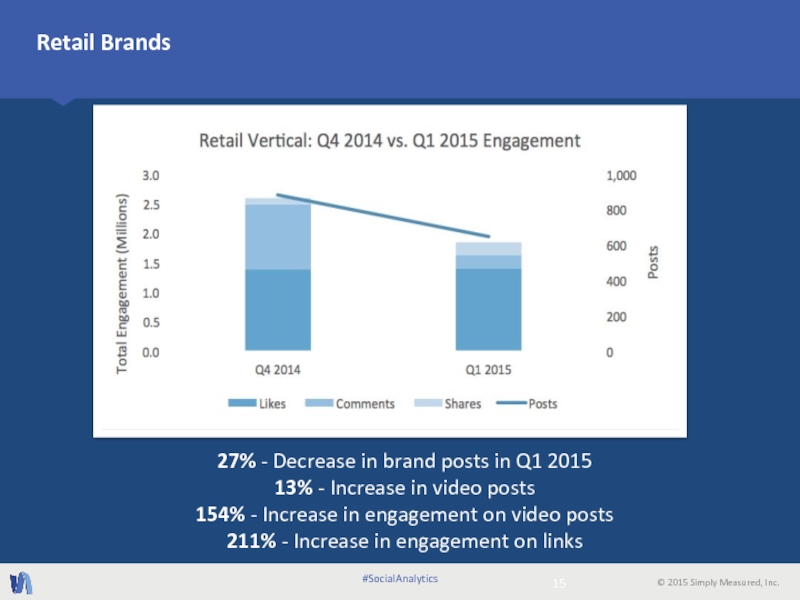
Слайд 1527% - Decrease in brand posts in Q1 2015
13% - Increase
154% - Increase in engagement on video posts
211% - Increase in engagement on links
Retail Brands
#SocialAnalytics
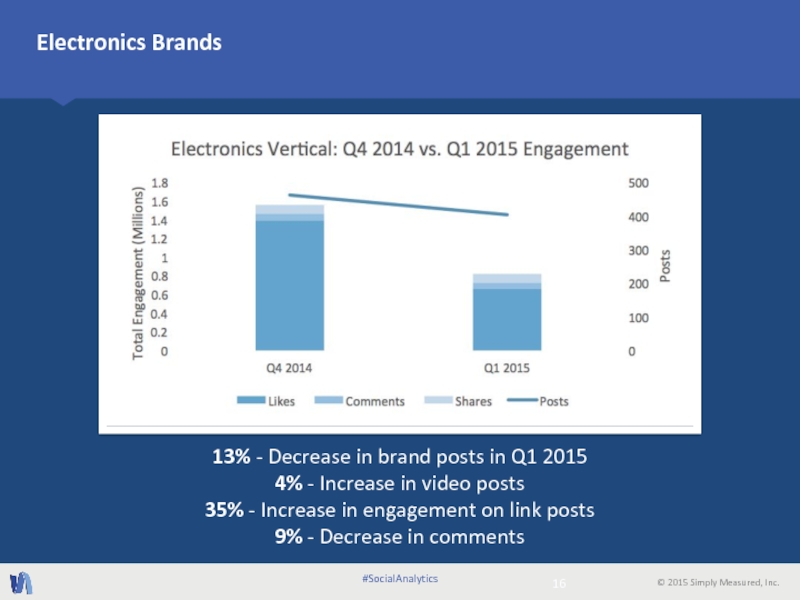
Слайд 1613% - Decrease in brand posts in Q1 2015
4% -
35% - Increase in engagement on link posts
9% - Decrease in comments
Electronics Brands
#SocialAnalytics
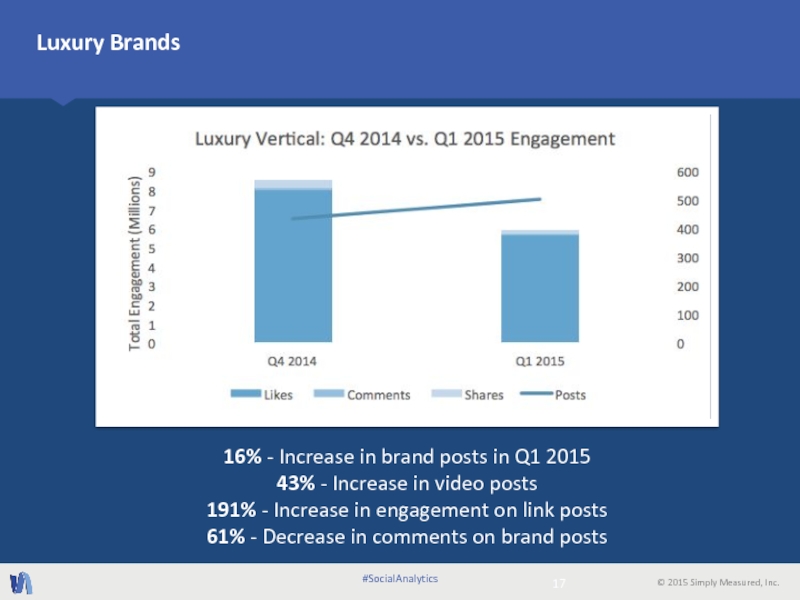
Слайд 1716% - Increase in brand posts in Q1 2015
43% - Increase
191% - Increase in engagement on link posts
61% - Decrease in comments on brand posts
Luxury Brands
#SocialAnalytics
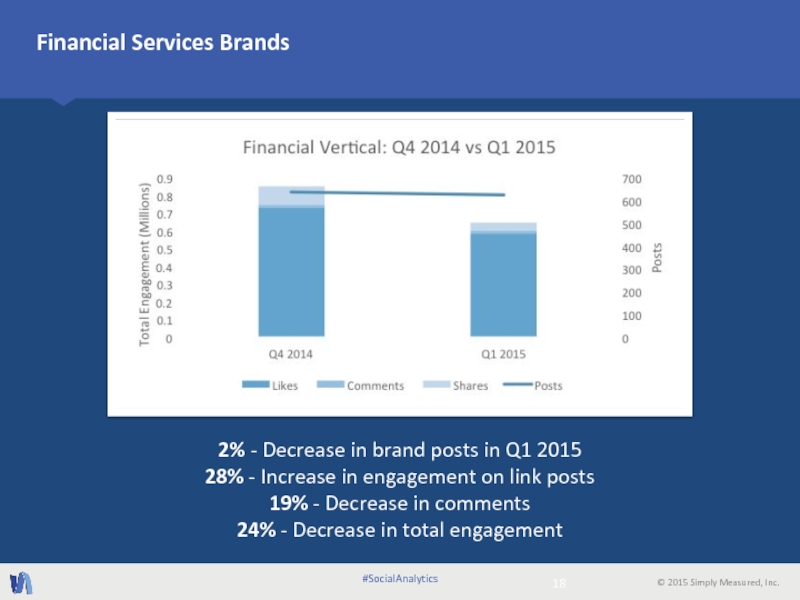
Слайд 182% - Decrease in brand posts in Q1 2015
28% -
19% - Decrease in comments
24% - Decrease in total engagement
Financial Services Brands
#SocialAnalytics
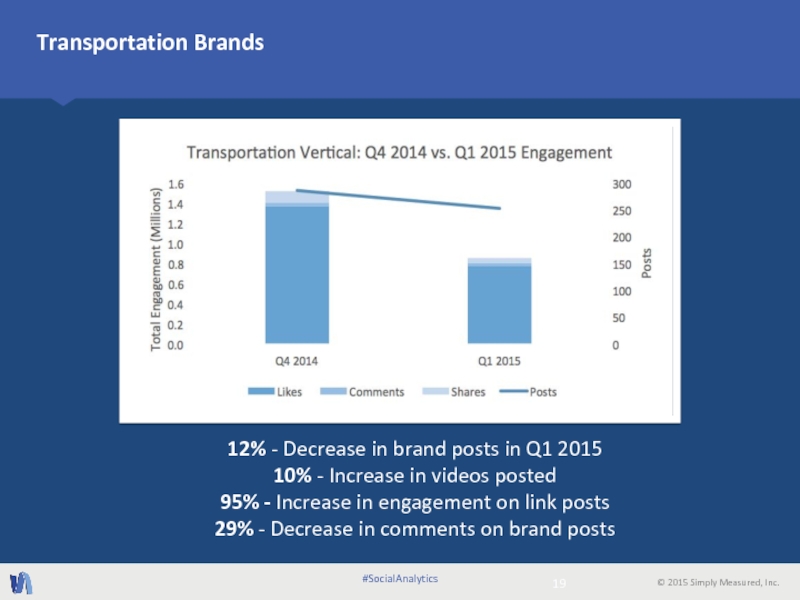
Слайд 1912% - Decrease in brand posts in Q1 2015
10% -
95% - Increase in engagement on link posts
29% - Decrease in comments on brand posts
Transportation Brands
#SocialAnalytics
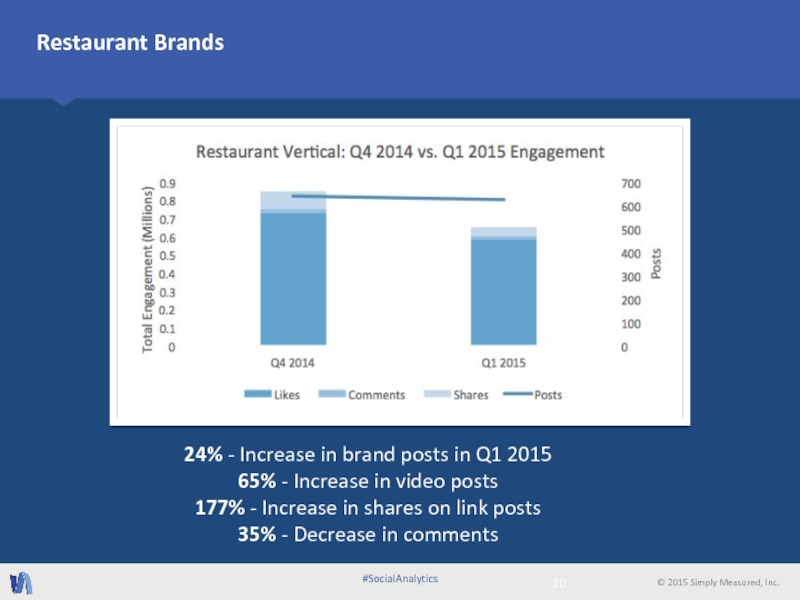
Слайд 2024% - Increase in brand posts in Q1 2015
65% -
177% - Increase in shares on link posts
35% - Decrease in comments
Restaurant Brands
#SocialAnalytics
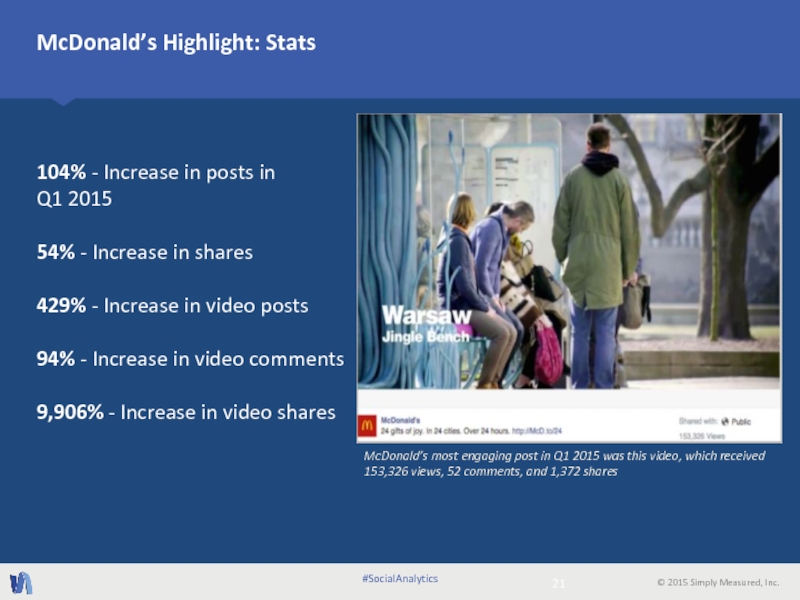
Слайд 21104% - Increase in posts in
Q1 2015
54% - Increase
429% - Increase in video posts
94% - Increase in video comments
9,906% - Increase in video shares
McDonald’s Highlight: Stats
#SocialAnalytics
McDonald’s most engaging post in Q1 2015 was this video, which received 153,326 views, 52 comments, and 1,372 shares
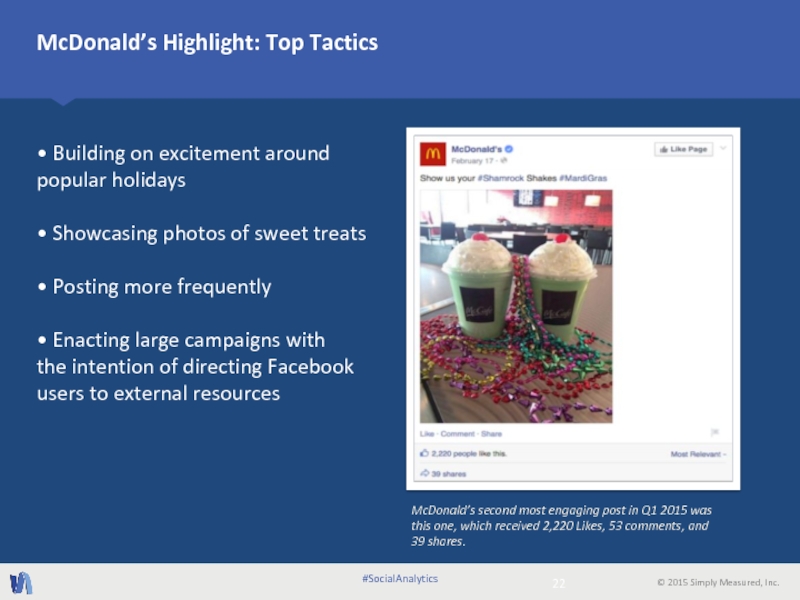
Слайд 22• Building on excitement around popular holidays
• Showcasing photos of sweet
• Posting more frequently
• Enacting large campaigns with
the intention of directing Facebook users to external resources
McDonald’s Highlight: Top Tactics
#SocialAnalytics
McDonald’s second most engaging post in Q1 2015 was this one, which received 2,220 Likes, 53 comments, and 39 shares.
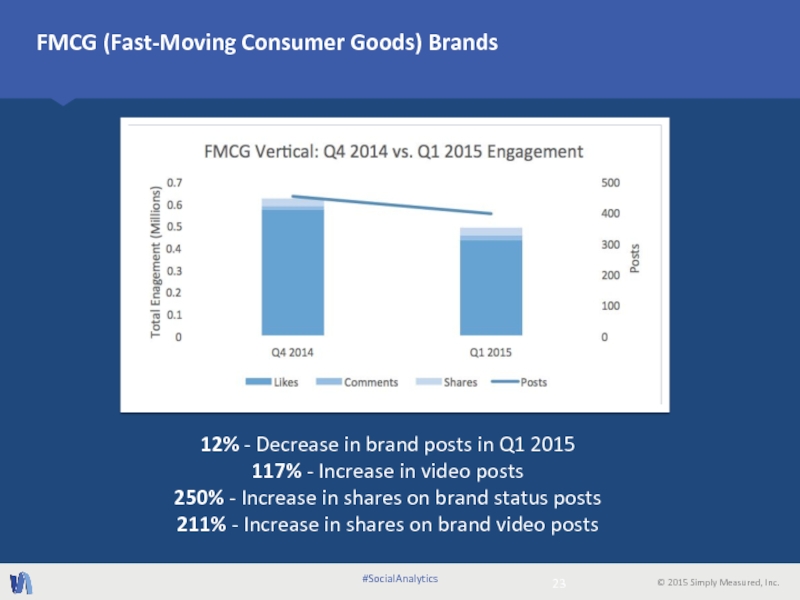
Слайд 2312% - Decrease in brand posts in Q1 2015
117% -
250% - Increase in shares on brand status posts
211% - Increase in shares on brand video posts
FMCG (Fast-Moving Consumer Goods) Brands
#SocialAnalytics
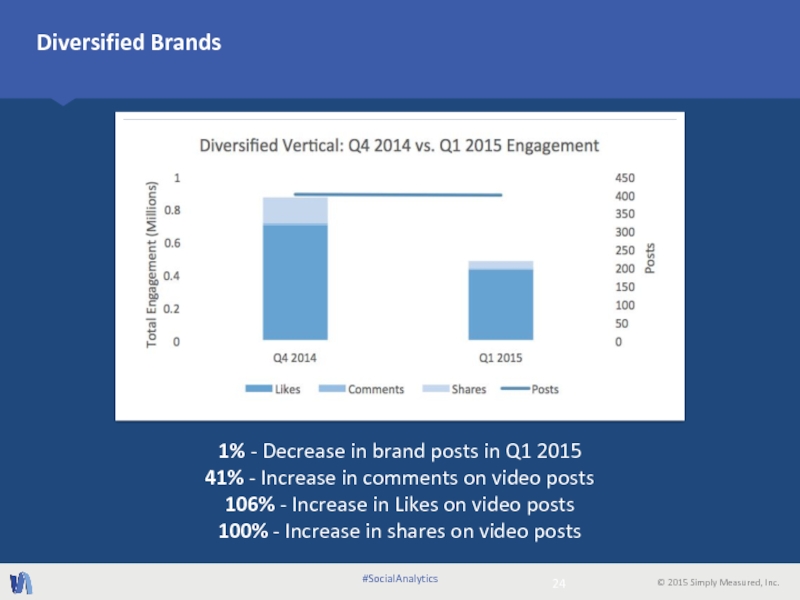
Слайд 241% - Decrease in brand posts in Q1 2015
41% -
106% - Increase in Likes on video posts
100% - Increase in shares on video posts
Diversified Brands
#SocialAnalytics
Слайд 25124% - Increase in brand posts in
Q1 2015
232% -
Q1 2015
516% - Increase in Likes in Q1 2015
618% - Increase in shares in Q1 2015
520% - Total increase in engagement
in Q1 2015
3M Highlight: Stats
#SocialAnalytics
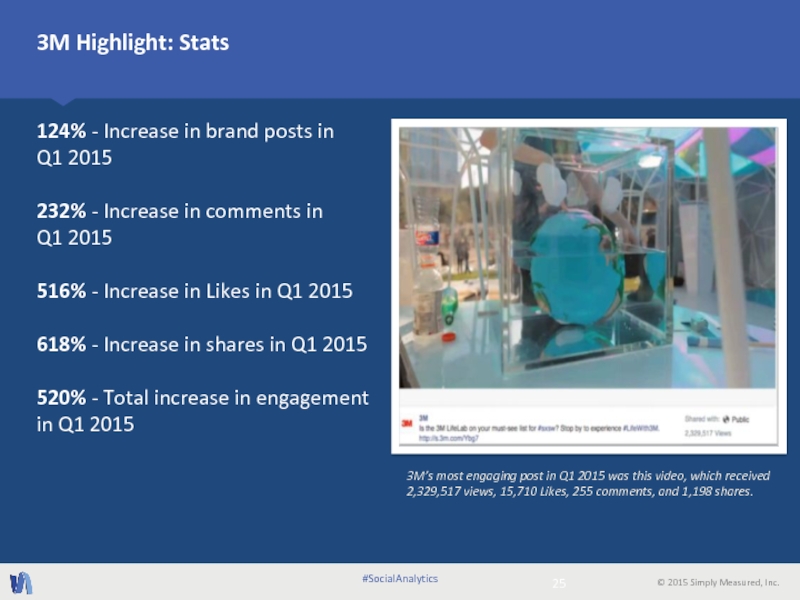
3M’s most engaging post in Q1 2015 was this video, which received 2,329,517 views, 15,710 Likes, 255 comments, and 1,198 shares.
Слайд 26• Visually stunning, science-based videos which suavely avoid the
sales pitch
• Building
• Partnering with socially super-successful brands like MTV
3M Highlight: Top Tactics
#SocialAnalytics
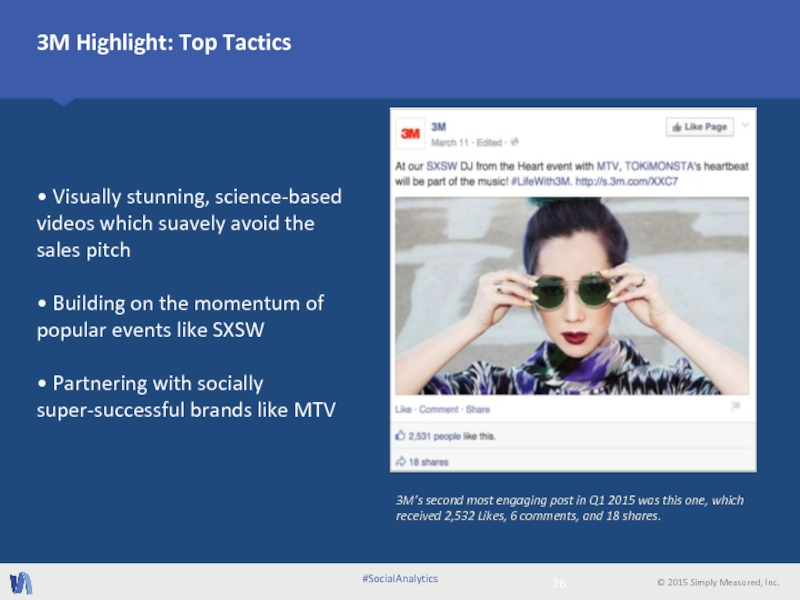
3M’s second most engaging post in Q1 2015 was this one, which received 2,532 Likes, 6 comments, and 18 shares.
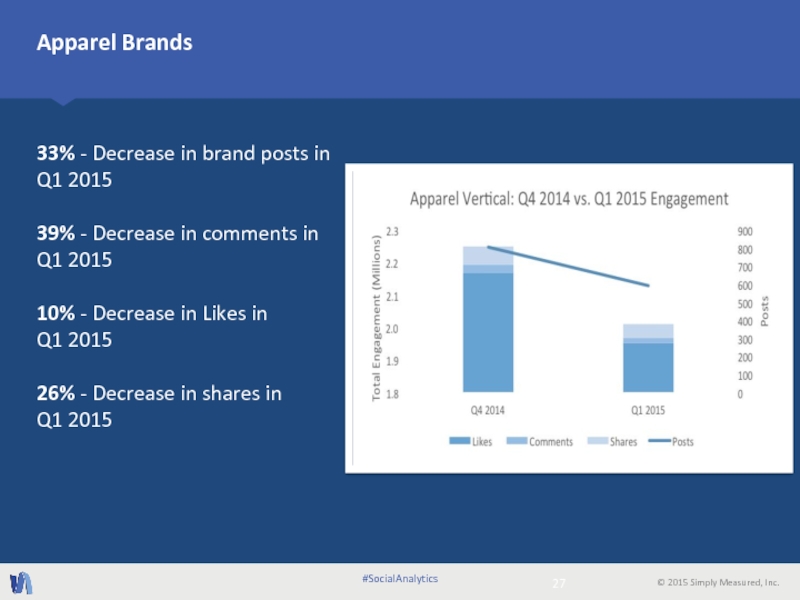
Слайд 2733% - Decrease in brand posts in
Q1 2015
39% -
Q1 2015
10% - Decrease in Likes in
Q1 2015
26% - Decrease in shares in
Q1 2015
Apparel Brands
#SocialAnalytics
Слайд 28Simply Measured is the most complete social analytics solution, empowering marketers
About Simply Measured
Click here to download the full
2015 Facebook Industry Report
Find out more about what top brands in the media, alcohol, technology, automotive, retail, electronics, luxury, financial services, transportation, restaurants, FMCG, diversified, and apparel industries are doing on Facebook.
#SocialAnalytics

