- Главная
- Разное
- Дизайн
- Бизнес и предпринимательство
- Аналитика
- Образование
- Развлечения
- Красота и здоровье
- Финансы
- Государство
- Путешествия
- Спорт
- Недвижимость
- Армия
- Графика
- Культурология
- Еда и кулинария
- Лингвистика
- Английский язык
- Астрономия
- Алгебра
- Биология
- География
- Детские презентации
- Информатика
- История
- Литература
- Маркетинг
- Математика
- Медицина
- Менеджмент
- Музыка
- МХК
- Немецкий язык
- ОБЖ
- Обществознание
- Окружающий мир
- Педагогика
- Русский язык
- Технология
- Физика
- Философия
- Химия
- Шаблоны, картинки для презентаций
- Экология
- Экономика
- Юриспруденция
Revenue Reporting: Your Genie in a Bottle презентация
Содержание
- 1. Revenue Reporting: Your Genie in a Bottle
- 2. Today’s Speakers Jessica Kao Senior Manager, Demand
- 3. Companies lack quantitative metrics to demonstrate impact
- 4. High growth companies rely on analytics for
- 5. Challenge: How to choose the RIGHT data and metrics
- 6. CMOs commit to mastering analytics Source: The 2014 CMO Insights Survey, Accenture
- 7. Spending on marketing analytics expected to increase
- 8. Increasing pressure to prove the value of
- 11. Limited resources Prioritize what to do
- 12. Overwhelmed by which metrics to choose Lack
- 13. Does it: Answer WIIFM Use common language
- 14. What are the metrics that really matter?
- 15. Provide data to prove marketing is an
- 16. Cost of NOT doing Revenue Reporting
- 17. Cost of NOT doing Revenue Reporting Let’s Do More Tradeshows!
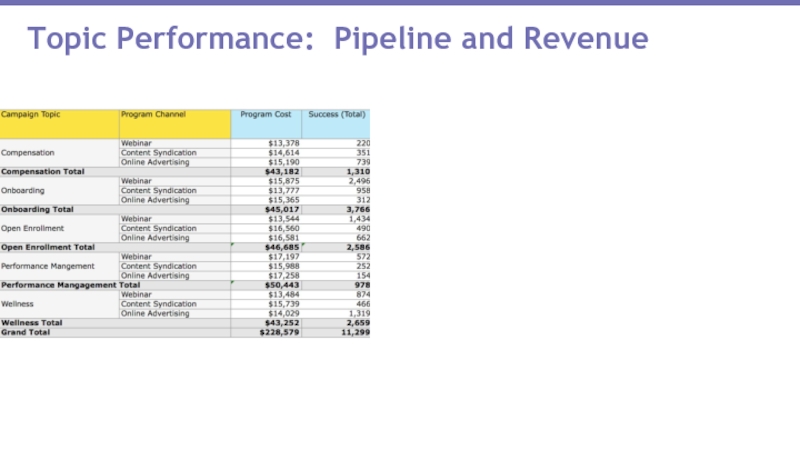
- 18. Topic Performance: Pipeline and Revenue
- 19. Topic Performance: Pipeline and Revenue
- 20. Topic Performance: Pipeline and Revenue
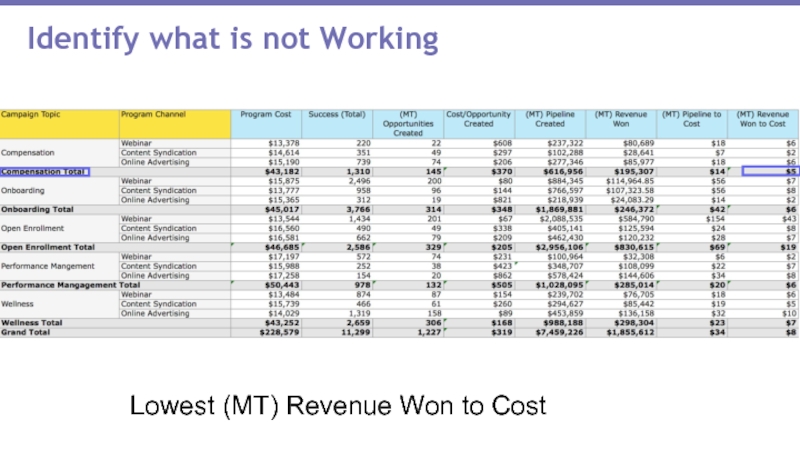
- 21. Identify what is not Working Lowest (MT) Revenue Won to Cost
- 22. Compensation (MT) Pipeline and (MT) Revenue derived
- 23. Channel: Pipeline and Revenue What is the
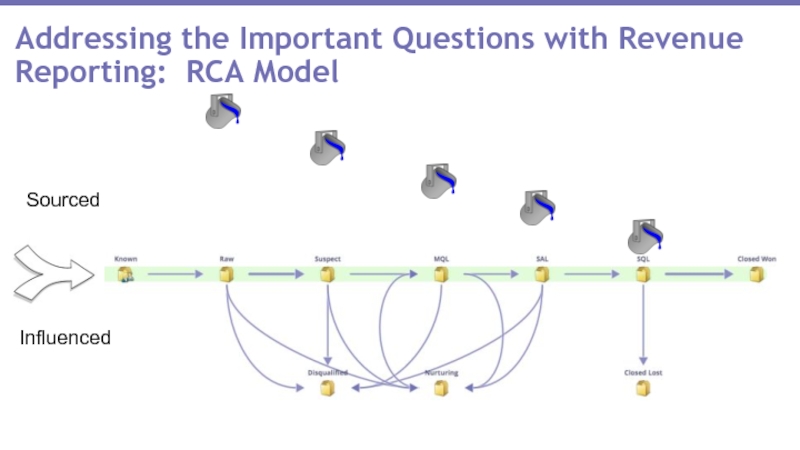
- 24. Addressing the Important Questions with Revenue Reporting: RCA Model Sourced Influenced
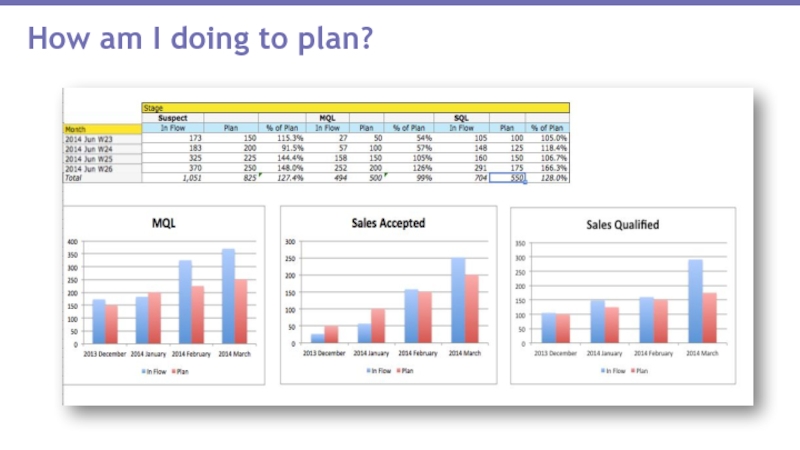
- 25. How am I doing to plan?
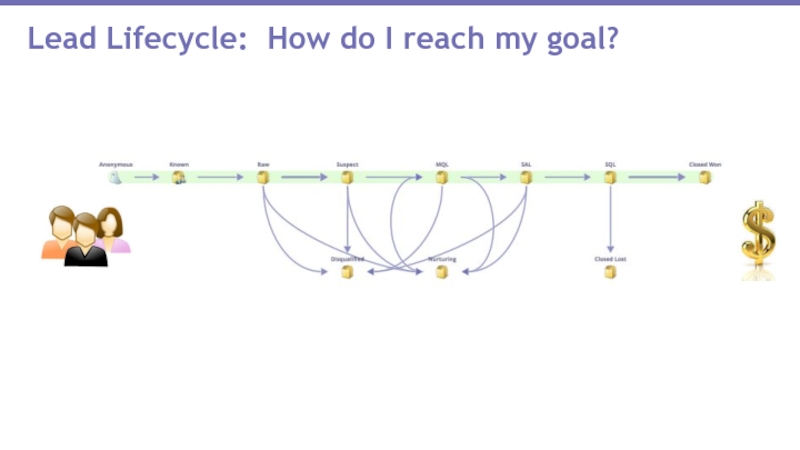
- 26. Lead Lifecycle: How do I reach my goal?
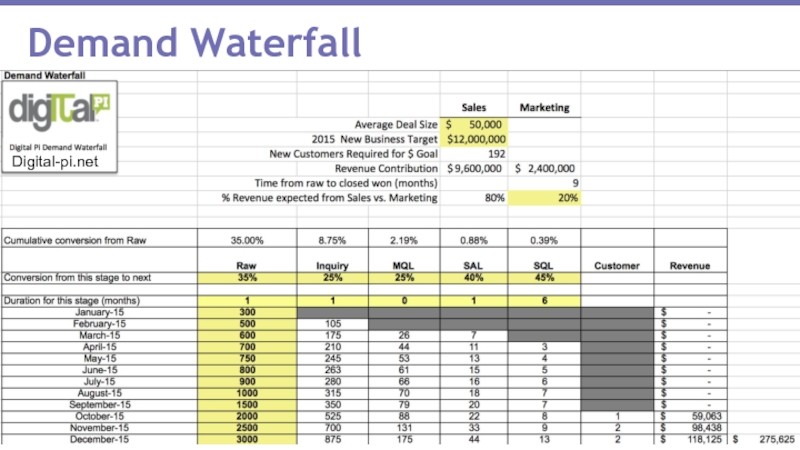
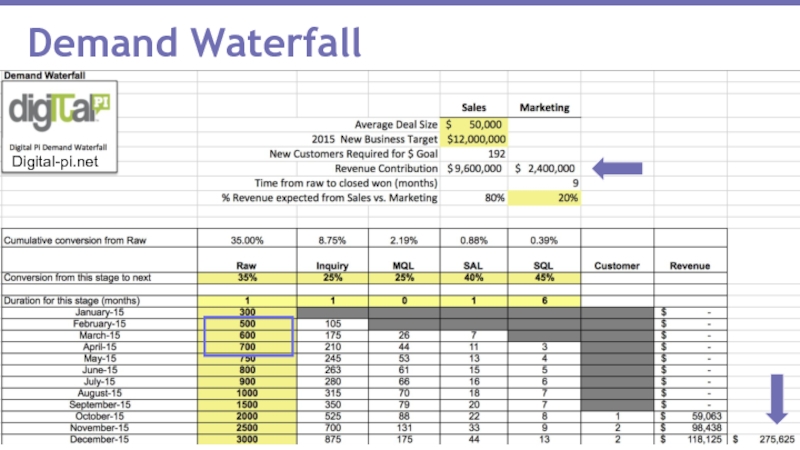
- 27. Demand Waterfall Digital-pi.net
- 28. Demand Waterfall Digital-pi.net
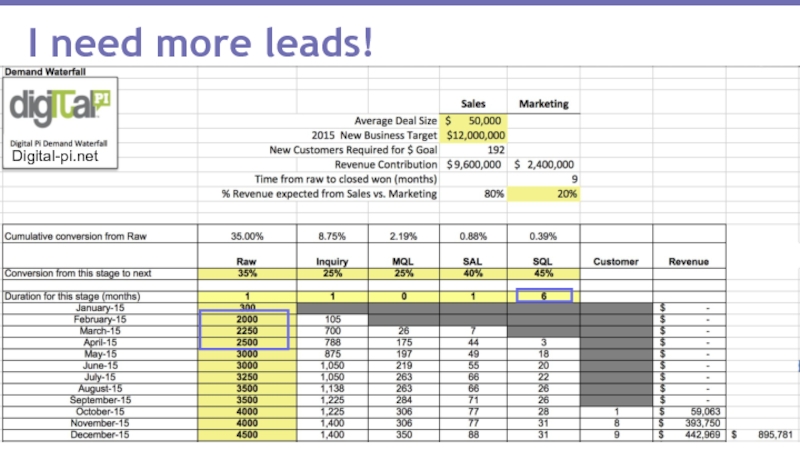
- 29. I need more leads! Digital-pi.net
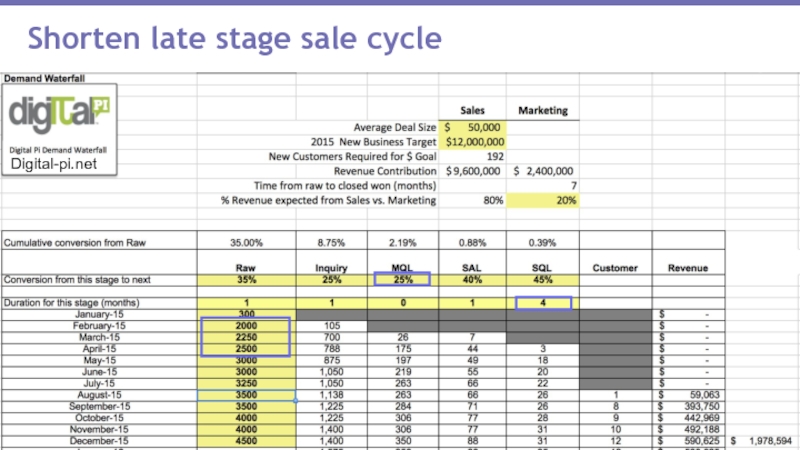
- 30. Shorten late stage sale cycle Digital-pi.net
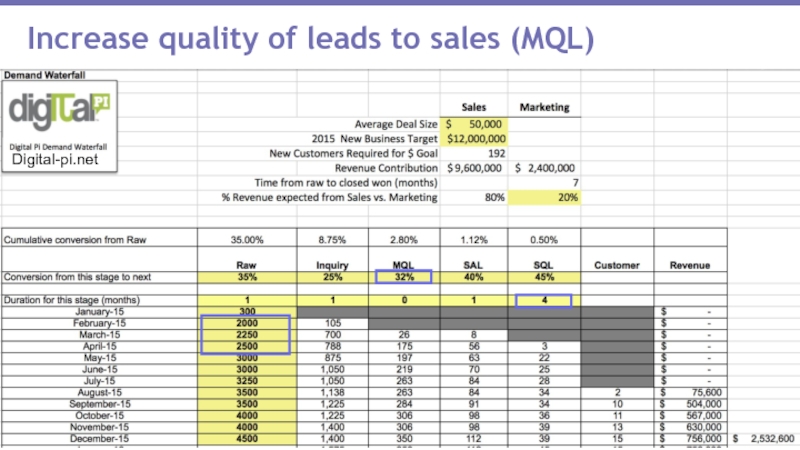
- 31. Increase quality of leads to sales (MQL) Digital-pi.net
- 32. Create reports that lead to actionable insight
- 33. How do I justify the need
- 34. Establishing Reporting Vision Presentation: RCA Model
- 35. Data: Company Revenue Goals ($)* FY QTR
- 36. Quick Calculations – Acme Co. $100M Revenue
- 37. What is Marketing’s Contribution Marketing Sourced Goal
- 38. Marketo set up and utilization not optimal
- 39. Marketing Reporting Needs Multiple programs influencing a
- 40. More engagement and conversations between sales and
- 41. I’m ready to get started today: Strategic
- 42. I want to plan ahead for
- 43. Huh? I’m overwhelmed: Then start with this
- 44. Revenue reporting empowers your company and your
- 45. Special Thanks: http://summit.marketo.com/2014/replay/ Resources: Webinar: Find
- 46. Thank You! Jessica Kao, PhD @spunkyscientist jkao@guidespark.com
Слайд 2Today’s Speakers
Jessica Kao
Senior Manager, Demand Gen
Guidespark
Brian Glover
Senior Manager, Product Marketing
Marketo
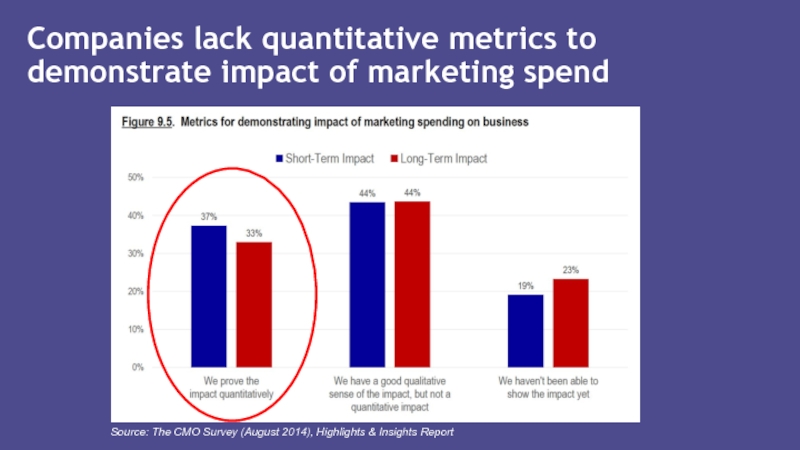
Слайд 3Companies lack quantitative metrics to demonstrate impact of marketing spend
Source: The
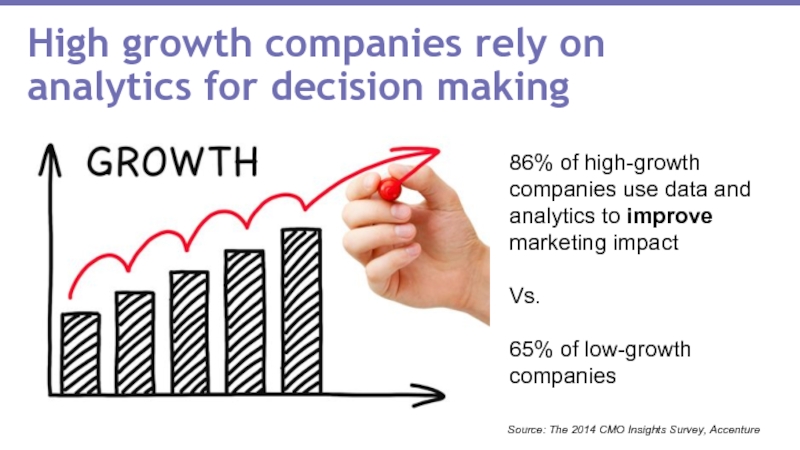
Слайд 4High growth companies rely on analytics for decision making
Source: The 2014
86% of high-growth companies use data and analytics to improve marketing impact
Vs.
65% of low-growth companies
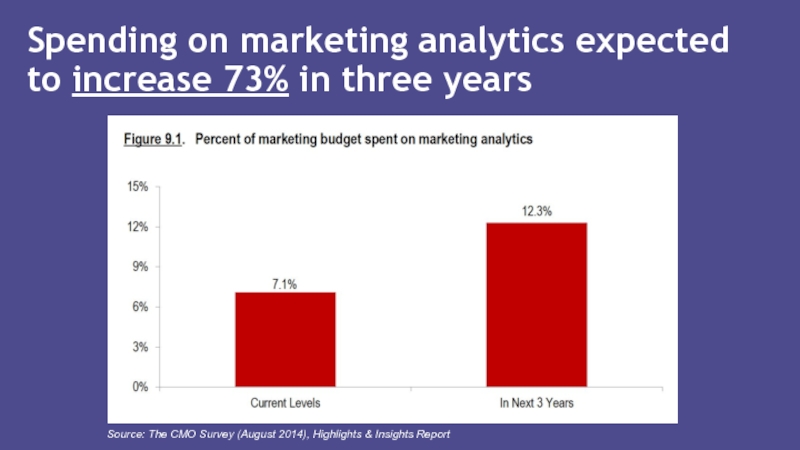
Слайд 7Spending on marketing analytics expected to increase 73% in three years
Source:
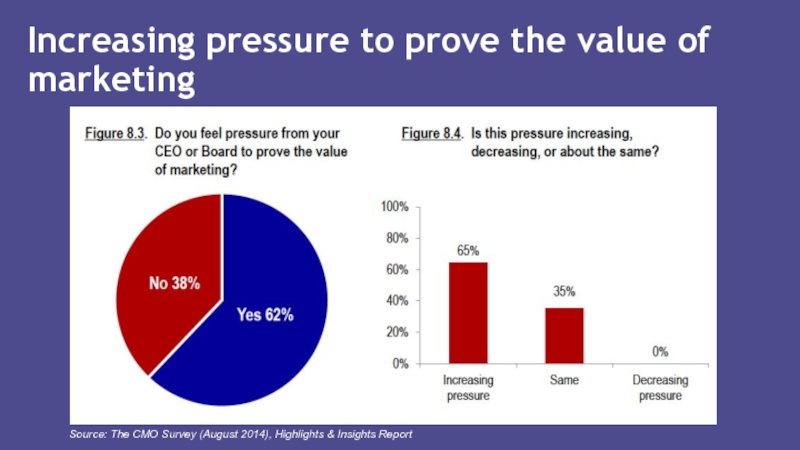
Слайд 8Increasing pressure to prove the value of marketing
Source: The CMO Survey
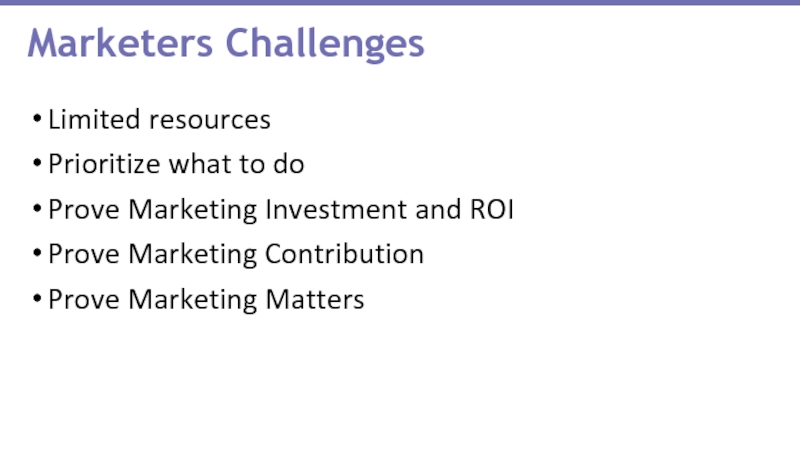
Слайд 11Limited resources
Prioritize what to do
Prove Marketing Investment and ROI
Prove Marketing
Prove Marketing Matters
Marketers Challenges
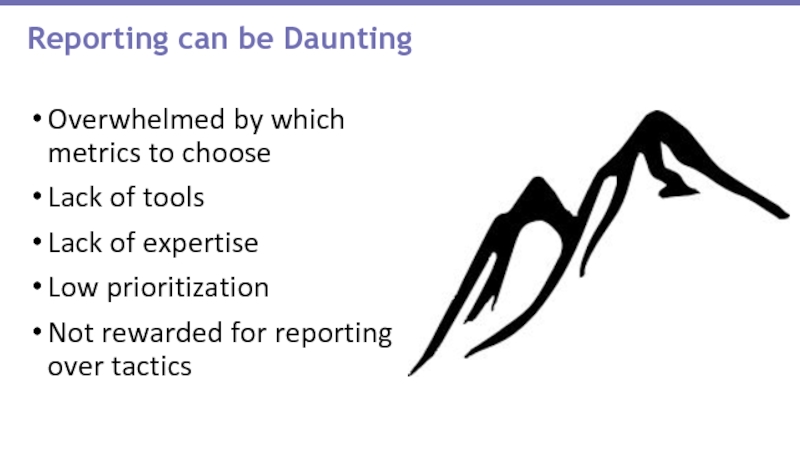
Слайд 12Overwhelmed by which metrics to choose
Lack of tools
Lack of expertise
Low prioritization
Not
Reporting can be Daunting
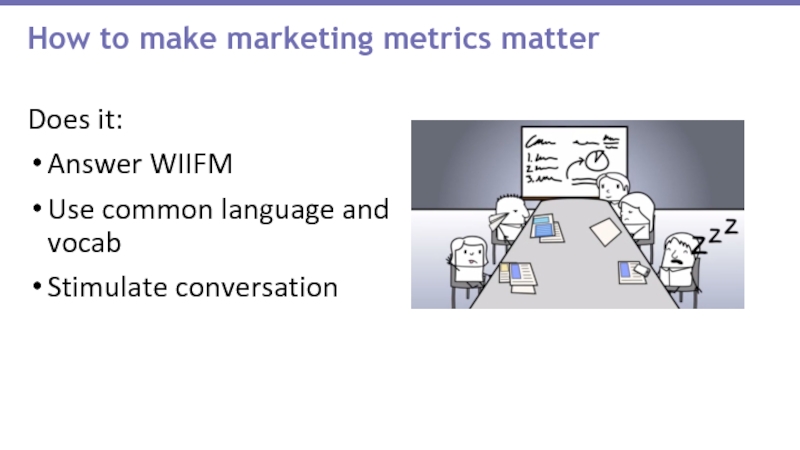
Слайд 13Does it:
Answer WIIFM
Use common language and vocab
Stimulate conversation
How to make marketing
Слайд 14What are the metrics that really matter?
Marketing’s contribution:
Revenue
Pipeline
# of Opportunities
What is
Measuring the impact of all marketing strategies and tactics on the companies bottom line = Revenue
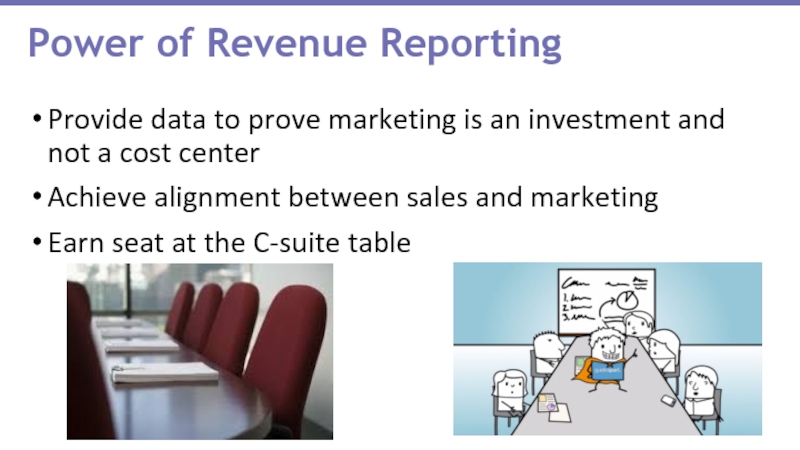
Слайд 15Provide data to prove marketing is an investment and not a
Achieve alignment between sales and marketing
Earn seat at the C-suite table
Power of Revenue Reporting
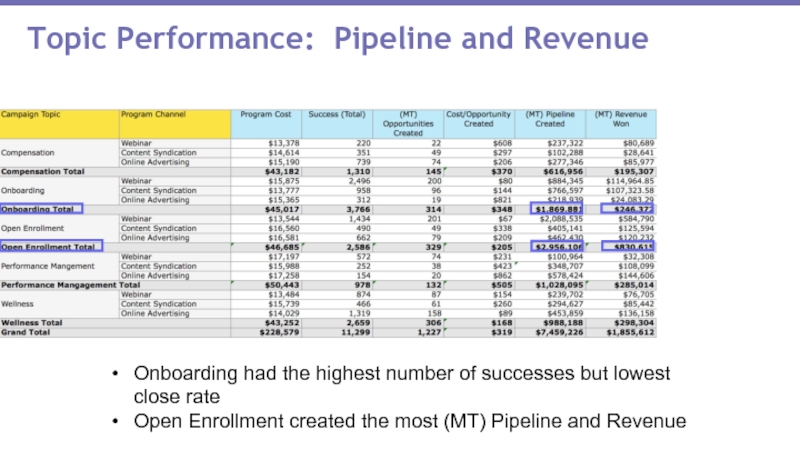
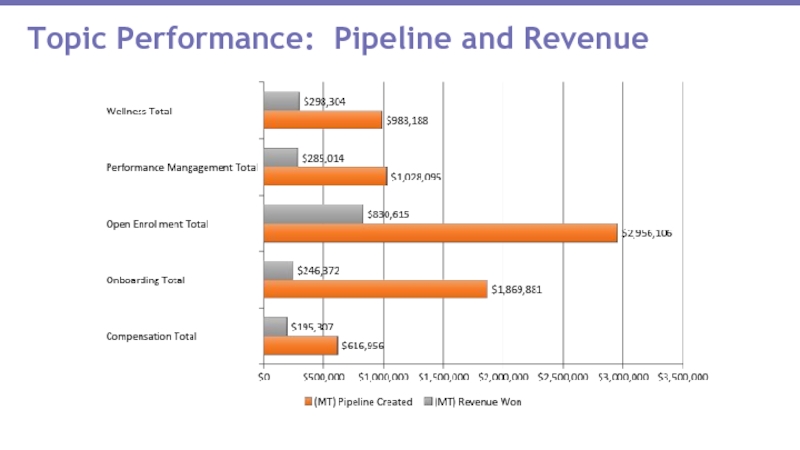
Слайд 19Topic Performance: Pipeline and Revenue
Onboarding had the highest number of successes
Open Enrollment created the most (MT) Pipeline and Revenue
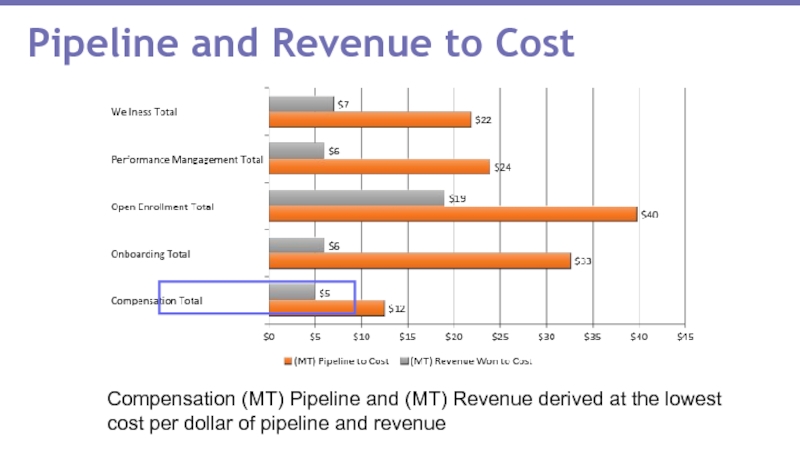
Слайд 22Compensation (MT) Pipeline and (MT) Revenue derived at the lowest cost
Pipeline and Revenue to Cost
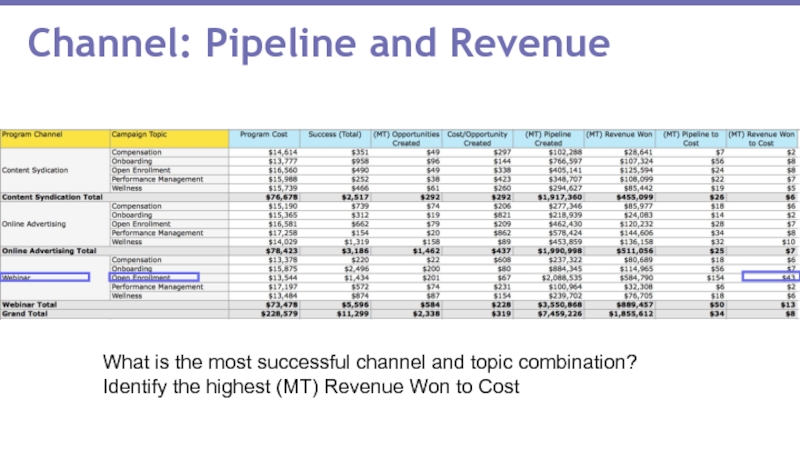
Слайд 23Channel: Pipeline and Revenue
What is the most successful channel and topic
Identify the highest (MT) Revenue Won to Cost
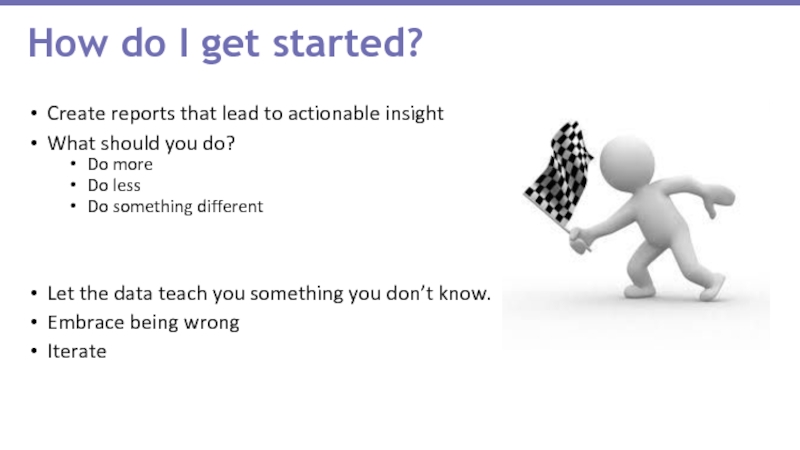
Слайд 32Create reports that lead to actionable insight
What should you do?
Do more
Do
Do something different
Let the data teach you something you don’t know.
Embrace being wrong
Iterate
How do I get started?
Слайд 34
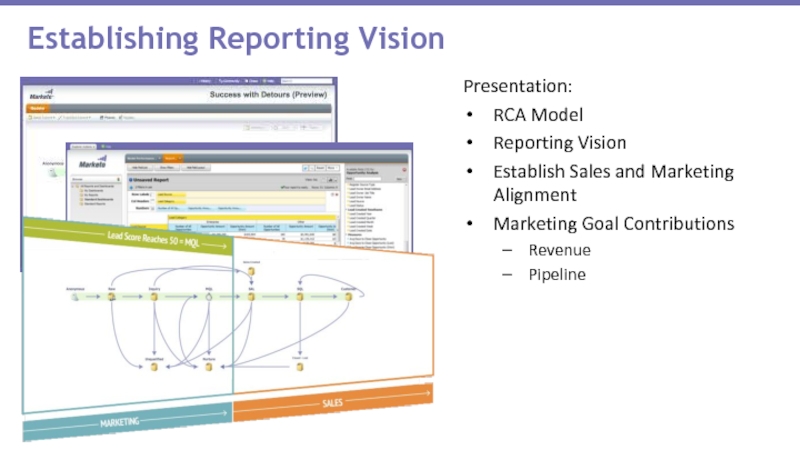
Establishing Reporting Vision
Presentation:
RCA Model
Reporting Vision
Establish Sales and Marketing Alignment
Marketing Goal Contributions
Revenue
Pipeline
Слайд 35Data:
Company Revenue Goals ($)*
FY
QTR
Avg Deal Size ($)*
Length of Sales Cycle (Days)*
Avg
How to easily set your goals by the end of this week
Who to Talk To:
Sales
Sales Ops/CRM
Finance
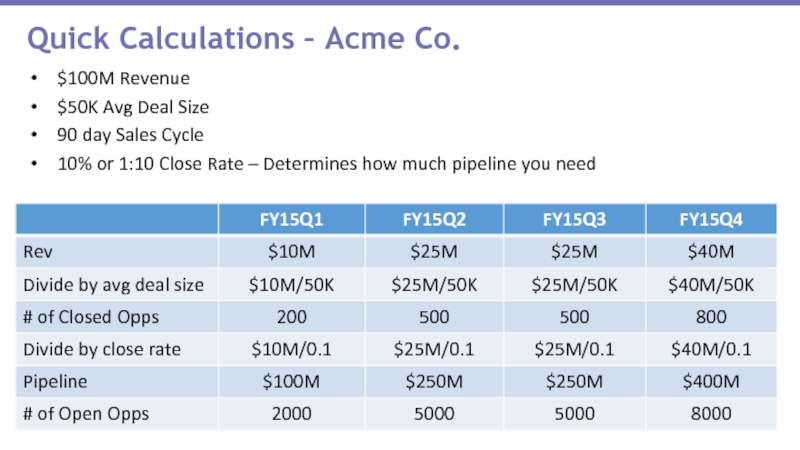
Слайд 36Quick Calculations – Acme Co.
$100M Revenue
$50K Avg Deal Size
90 day Sales
10% or 1:10 Close Rate – Determines how much pipeline you need
Слайд 37What is Marketing’s Contribution
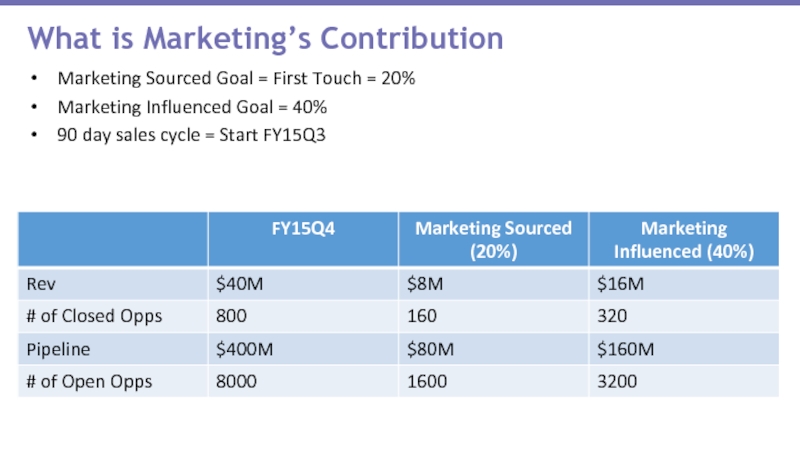
Marketing Sourced Goal = First Touch = 20%
Marketing
90 day sales cycle = Start FY15Q3
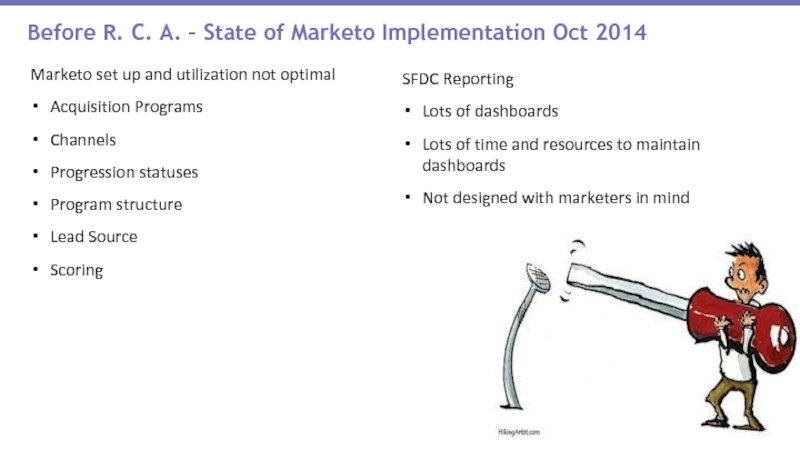
Слайд 38Marketo set up and utilization not optimal
Acquisition Programs
Channels
Progression statuses
Program structure
Lead Source
Scoring
Before
SFDC Reporting
Lots of dashboards
Lots of time and resources to maintain dashboards
Not designed with marketers in mind
Слайд 39Marketing Reporting Needs
Multiple programs influencing a person’s decision to buy (MT)
Acquisition
Dates of entering program/campaign
Leads characteristic associated with program not the lead as a static field
Multi-dimensional reporting
Слайд 40More engagement and conversations between sales and marketing
Weekly marketing updates at
Monthly marketing and sales leadership meeting
Weekly marketing and inside sales meeting
Monthly marketing report out C-suite
Intradepartmental changes
What do we call a success
How do we measure the impact on pipeline and revenue
Changing the Conversation and Increasing Alignment
Слайд 41I’m ready to get started today:
Strategic
Understand resource needs
Set aside dedicated time
Set goals
Tactical
Audit lead sources
Audit channels, successes, and program Statuses
Acquisition programs
So Now What. . . If
Слайд 42
I want to plan ahead for revenue reporting in the future:
Audit
Audit Channels, Successes, and Program Statuses
Acquisition Programs
So Now What. . . if
Слайд 43Huh? I’m overwhelmed:
Then start with this at a minimum
Create static lists
Consistent Nomenclature for Lead Source Detail
Tradeshow-AABB-021415
Webinar-Revenue Reporting-021815
List Purchase-ABC-031414
Hire/Train designated person
Ask for Help
Marketo Professional Services
Hire an Agency: Digital Pi
Marketo User Group
Local Linkedin User Group
Summit 2015
So Now What. . .
Слайд 44Revenue reporting empowers your company and your career
Set goals and measure
Do something different today to address revenue reporting – try Demand Waterfall
Wrap up - summary
Слайд 45Special Thanks:
http://summit.marketo.com/2014/replay/
Resources:
Webinar: Find the Right Marketing Automation Solution for your Company
http://www.marketo.com/webinars/
(Good
Demand waterfall spreadsheet available at digital-pi.net
