- Главная
- Разное
- Дизайн
- Бизнес и предпринимательство
- Аналитика
- Образование
- Развлечения
- Красота и здоровье
- Финансы
- Государство
- Путешествия
- Спорт
- Недвижимость
- Армия
- Графика
- Культурология
- Еда и кулинария
- Лингвистика
- Английский язык
- Астрономия
- Алгебра
- Биология
- География
- Детские презентации
- Информатика
- История
- Литература
- Маркетинг
- Математика
- Медицина
- Менеджмент
- Музыка
- МХК
- Немецкий язык
- ОБЖ
- Обществознание
- Окружающий мир
- Педагогика
- Русский язык
- Технология
- Физика
- Философия
- Химия
- Шаблоны, картинки для презентаций
- Экология
- Экономика
- Юриспруденция
44 FACTS DEFINING THE FUTURE OF CUSTOMER ENGAGEMENT презентация
Содержание
- 1. 44 FACTS DEFINING THE FUTURE OF CUSTOMER ENGAGEMENT
- 2. Customers who are fully engaged represent an
- 3. In the consumer electronics industry, fully engaged shoppers make
- 4. In the retail banking industry, customers who are fully
- 5. Fully engaged policy owners purchase 22% more
- 6. Fully engaged hotel guests spend 46% more
- 8. 52% of those surveyed whose organizations are
- 9. 27% of companies say it takes them
- 10. 15% of companies surveyed say more than
- 11. 60% of organizations see that customer service
- 12. 71% of organizations indicate increasing importance being
- 13. 66% of customers are willing to spend more with companies
- 14. 52% of companies say Facebook is the
- 15. 32% say they have seen very positive
- 16. 81% of companies say social customer service
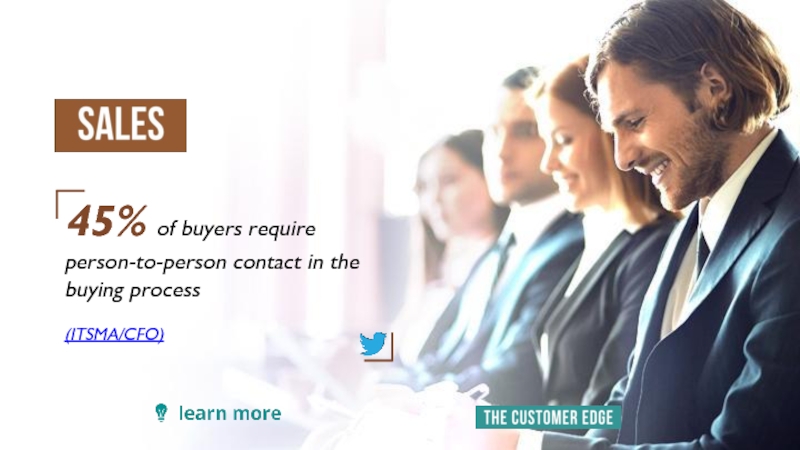
- 18. 45% of buyers require person-to-person contact in the buying process (ITSMA/CFO)
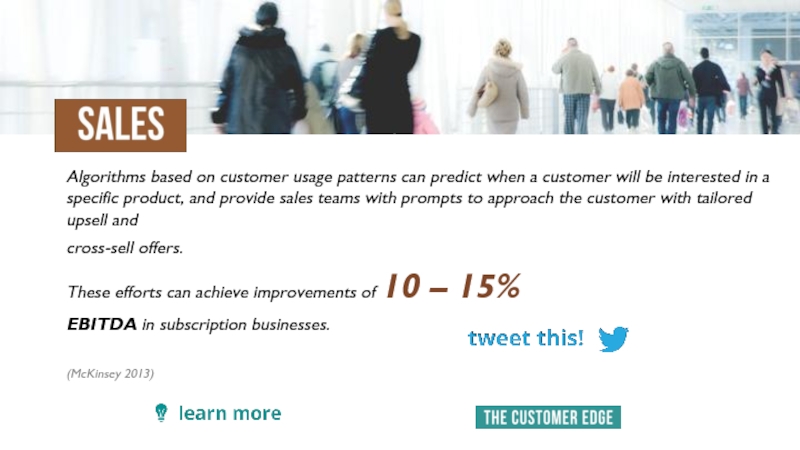
- 19. Algorithms based on customer usage patterns can
- 20. Customer retention is 14% higher among companies
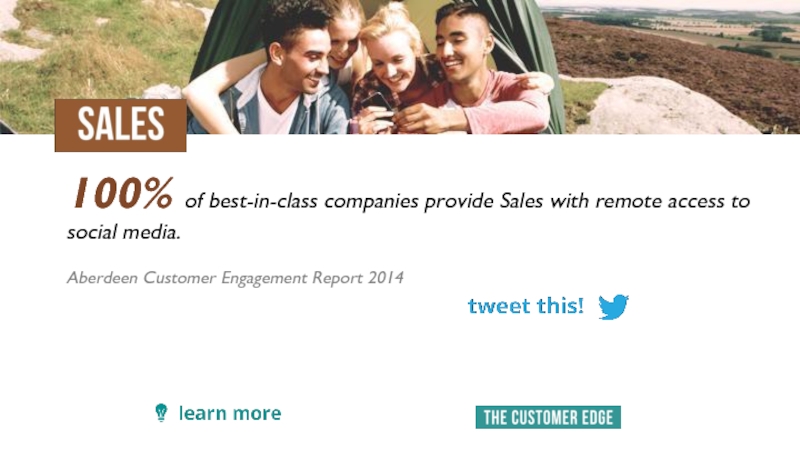
- 21. 100% of best-in-class companies provide Sales with
- 22. By 2016, the web will influence more
- 23. Companies that put data at the center
- 25. Only 14% of marketers say customer centricity
- 26. 66% of marketers believe that quick response
- 27. Facebook's "like" button is pressed 2.7 billion
- 28. An integrated analytic approach can free up
- 29. 52% of Marketing Execs surveyed say that
- 30. 52% of Twitter users in the U.S.
- 32. According to a CEI Survey, 86% of
- 33. 73% of marketers view customer centricity as
- 34. 70% of buying experiences are based on
- 35. A 2% increase in customer retention has
- 36. 55% of consumers would pay more for a better customer experience. (Defaqto Research)
- 37. The customer experience will reign as the
- 38. The majority of businesses are unable to
- 39. According to a CEI Survey, 86% of
- 41. An Accenture study found that 72% of
- 42. Millennials, those consumers aged 18 to 34,
- 43. More shoppers are looking to take advantage
- 44. 57% of women indicated that they made
- 45. In the first quarter of 2014, 198
- 46. 22.2% of men made purchases on their
- 47. Millennials spend around $2,000 annually on e-commerce
- 48. Boomers and seniors have adopted mobile commerce.
- 49. Women indicated they weren’t ready to buy
- 50. THANK YOU
Слайд 2Customers who are fully engaged represent an average 23% premium in
terms of share of wallet, profitability, revenue and relationship growth compared with the average customer.
(Gallup State of the American Consumer 2014)
(Gallup State of the American Consumer 2014)
Слайд 3In the consumer electronics industry, fully engaged shoppers make 44% more visits per
year to their preferred retailer than do actively disengaged shoppers. And when they do visit their preferred electronics retailer, these fully engaged shoppers purchase more items than they originally intended to.
(Gallup State of the American Consumer 2014)
(Gallup State of the American Consumer 2014)
Слайд 4In the retail banking industry, customers who are fully engaged bring 37% more
annual revenue to their primary bank than do customers who are actively disengaged.
(Gallup State of the American Consumer 2014)
(Gallup State of the American Consumer 2014)
Слайд 5Fully engaged policy owners purchase 22% more types of insurance products
than actively disengaged policy owners do.
(Gallup State of the American Consumer 2014)
(Gallup State of the American Consumer 2014)
Слайд 6Fully engaged hotel guests spend 46% more per year than actively
disengaged hospitality industry guests spend.
(Gallup State of the American Consumer 2014)
(Gallup State of the American Consumer 2014)
Слайд 852% of those surveyed whose organizations are building
customer service apps
for mobile devices are also creating mobile-friendly websites vs. 36% who are creating native iOS/Android mobile apps.
(Social Media Today: The Social Customer Engagement Index 2014)
(Social Media Today: The Social Customer Engagement Index 2014)
Слайд 927% of companies say it takes them less than an hour
to respond to questions/issues on social channels.
(Social Media Today: The Social Customer Engagement Index 2014)
(Social Media Today: The Social Customer Engagement Index 2014)
Слайд 1015% of companies surveyed say more than 25% of customer service
inquiries are initiated over social channels.
(Social Media Today: The Social Customer Engagement Index 2014)
(Social Media Today: The Social Customer Engagement Index 2014)
Слайд 1160% of organizations see that customer service will be the top
source of competitive differentiation in the next three years.
(The Service Council’s (TSC) Service Transformation: The Business Case)
(The Service Council’s (TSC) Service Transformation: The Business Case)
Слайд 1271% of organizations indicate increasing importance being placed on service.
The Service
Council’s (TSC) Service Transformation: The Business Case
Слайд 1366% of customers are willing to spend more with companies who provide superior customer service.
(SAP,
Customer Service is the Heart of Marketing)
Слайд 1452% of companies say Facebook is the most effective social channel
for customer service.
(Social Media Today: The Social Customer Engagement Index 2014)
(Social Media Today: The Social Customer Engagement Index 2014)
Слайд 1532% say they have seen very positive impact from social on
customer service goals and objectives.
(Social Media Today: The Social Customer Engagement Index 2014)
(Social Media Today: The Social Customer Engagement Index 2014)
Слайд 1681% of companies say social customer service strategy is integrated into
overall social strategy of the organization.
(Social Media Today: The Social Customer Engagement Index 2014)
(Social Media Today: The Social Customer Engagement Index 2014)
Слайд 19Algorithms based on customer usage patterns can predict when a customer
will be interested in a specific product, and provide sales teams with prompts to approach the customer with tailored upsell and
cross-sell offers.
These efforts can achieve improvements of 10 – 15%
EBITDA in subscription businesses.
(McKinsey 2013)
cross-sell offers.
These efforts can achieve improvements of 10 – 15%
EBITDA in subscription businesses.
(McKinsey 2013)
Слайд 20Customer retention is 14% higher among companies applying big data and
analytics to deal velocity.
Aberdeen Customer Engagement
Report 2014
Aberdeen Customer Engagement
Report 2014
Слайд 21100% of best-in-class companies provide Sales with remote access to social
media.
Aberdeen Customer Engagement Report 2014
Aberdeen Customer Engagement Report 2014
Слайд 22By 2016, the web will influence more than 50% of all
retail transactions, representing a potential sales opportunity of almost $2 trillion.
(US Cross- Channel Retail Forecast, 2011 to 2016, Forrester Research, July 2012)
(US Cross- Channel Retail Forecast, 2011 to 2016, Forrester Research, July 2012)
Слайд 23Companies that put data at the center of their marketing and
sales decisions improve their marketing return on investment by 15-20%
(McKinsey 2013)
(McKinsey 2013)
Слайд 25Only 14% of marketers say customer centricity is ranked high within
their organization; only 11% percent say that their customers would say customer centricity is ranked high within their organization.
The CMO Council, Mastering Adaptive Customer Engagement (2014)
The CMO Council, Mastering Adaptive Customer Engagement (2014)
Слайд 2666% of marketers believe that quick response times to customer requests
or complaints is the most important attribute demonstrating customer centricity through the eyes of their customers.
The CMO Council, Mastering Adaptive Customer Engagement (2014)
The CMO Council, Mastering Adaptive Customer Engagement (2014)
Слайд 27Facebook's "like" button is pressed 2.7 billion times every day across
the web, revealing users’ interests.
(BI Intelligence 2014 Report)
(BI Intelligence 2014 Report)
Слайд 28An integrated analytic approach can free up some 15 - 20
% of marketing spending. Worldwide, that equates to as much as $200 billion that can be reinvested by companies or drop straight to the bottom line.
(McKinsey 2014)
(McKinsey 2014)
Слайд 2952% of Marketing Execs surveyed say that it is a combination
the people, the processes and the platforms needed to properly develop, manage, measure and continue delivery of the customer experience.
The CMO Council, Mastering Adaptive Customer Engagement (2014)
The CMO Council, Mastering Adaptive Customer Engagement (2014)
Слайд 3052% of Twitter users in the U.S. consume news on the
site (more than the percent of those who do so on Facebook), according to Pew Research.
(BI Intelligence 2014 Report)
(BI Intelligence 2014 Report)
Слайд 32According to a CEI Survey, 86% of buyers will pay more
for a better customer experience, but only 1% of customers feel that vendors
consistently meet their expectations.
(Forbes)
consistently meet their expectations.
(Forbes)
Слайд 3373% of marketers view customer centricity as critical to the success
of their business and role at the company.
The CMO Council, Mastering Adaptive Customer Engagement (2014)
The CMO Council, Mastering Adaptive Customer Engagement (2014)
Слайд 3470% of buying experiences are based on how the customer feels
they are being treated.
(McKinsey)
(McKinsey)
Слайд 35A 2% increase in customer retention has the same effect as
decreasing costs by 10%
(Leading on the Edge of Chaos, Emmet Murphy and Mark Murphy)
(Leading on the Edge of Chaos, Emmet Murphy and Mark Murphy)
Слайд 37The customer experience will reign as the primary investment target in
2014 as 68% of businesses plan to increase their customer management spend.
(2014 Call Center Executive Priorities Report)
(2014 Call Center Executive Priorities Report)
Слайд 38The majority of businesses are unable to support an omni-channel customer
journey. Only 12% can provide a seamless hand-off between channels.
(Forrester Wave Customer Service Solutions 2014)
(Forrester Wave Customer Service Solutions 2014)
Слайд 39According to a CEI Survey, 86% of buyers will pay more
for a better customer experience.
(Forbes)
(Forbes)
Слайд 41An Accenture study found that 72% of respondents “showroomed,” or bought
digitally after seeing a product in a store.
(Accenture)
(Accenture)
Слайд 42Millennials, those consumers aged 18 to 34, remain the key age
demographic for online commerce, spending more money online in a given year than any other age group.
(Business Insider Intelligence 2014)
(Business Insider Intelligence 2014)
Слайд 43More shoppers are looking to take advantage of seamless retail services
involving the store: In a recent survey, 19% of shoppers said they are using “click and collect” services.
(Accenture)
(Accenture)
Слайд 4457% of women indicated that they made an online purchase in
the last year, compared to 52% of men.
(SeeWhy 2014)
(SeeWhy 2014)
Слайд 45In the first quarter of 2014, 198 million U.S. consumers bought
something online.
(comScore's quarterly State Of Retail report)
(comScore's quarterly State Of Retail report)
Слайд 4622.2% of men made purchases on their smartphones versus 18.2% of
female respondents.
(SeeWhy 2014)
(SeeWhy 2014)
Слайд 47Millennials spend around $2,000 annually on e-commerce despite having lower incomes
than older adults.
(Business Insider Intelligence 2014)
(Business Insider Intelligence 2014)
Слайд 48Boomers and seniors have adopted mobile commerce. 1 in 4 mobile
shoppers in the U.S. is over the age of 55.
(BI Intelligence 2014 Report)
(BI Intelligence 2014 Report)
Слайд 49Women indicated they weren’t ready to buy 2x more than male
respondents, with 62.5% of females, versus 24.7% of males, revealing a desire to browse more before buying via their tablets.
(SeeWhy 2014)
(SeeWhy 2014)


