- Главная
- Разное
- Дизайн
- Бизнес и предпринимательство
- Аналитика
- Образование
- Развлечения
- Красота и здоровье
- Финансы
- Государство
- Путешествия
- Спорт
- Недвижимость
- Армия
- Графика
- Культурология
- Еда и кулинария
- Лингвистика
- Английский язык
- Астрономия
- Алгебра
- Биология
- География
- Детские презентации
- Информатика
- История
- Литература
- Маркетинг
- Математика
- Медицина
- Менеджмент
- Музыка
- МХК
- Немецкий язык
- ОБЖ
- Обществознание
- Окружающий мир
- Педагогика
- Русский язык
- Технология
- Физика
- Философия
- Химия
- Шаблоны, картинки для презентаций
- Экология
- Экономика
- Юриспруденция
There’s A 90% Chance Your Son Is Pregnant презентация
Содержание
- 1. There’s A 90% Chance Your Son Is Pregnant
- 2. Presenter and Contact Information Dale Sanders Senior
- 3. Acknowledgements David Crockett, PhD, Health Catalyst Eric
- 4. The Goal Today I hope you leave
- 5. Agenda Basic Concepts, Fundamental Assertions Predictive
- 6. Sampling of My Background In Predictive Analytics
- 7. Gartner 2014 Hype Cycle for Emerging
- 8. “Beyond math, there are no facts; only interpretations.” - Friedrich Nietzsche
- 9. Challenge of Predicting Anything Human
- 10. What Should We Expect In Healthcare? Machines
- 11. Healthcare Analytics Adoption Model Level 8 Level
- 12. Concepts & Principles of Predictive Analytics
- 13. Semantics, Ssschmantics Predictive Analytics and Predictive Models:
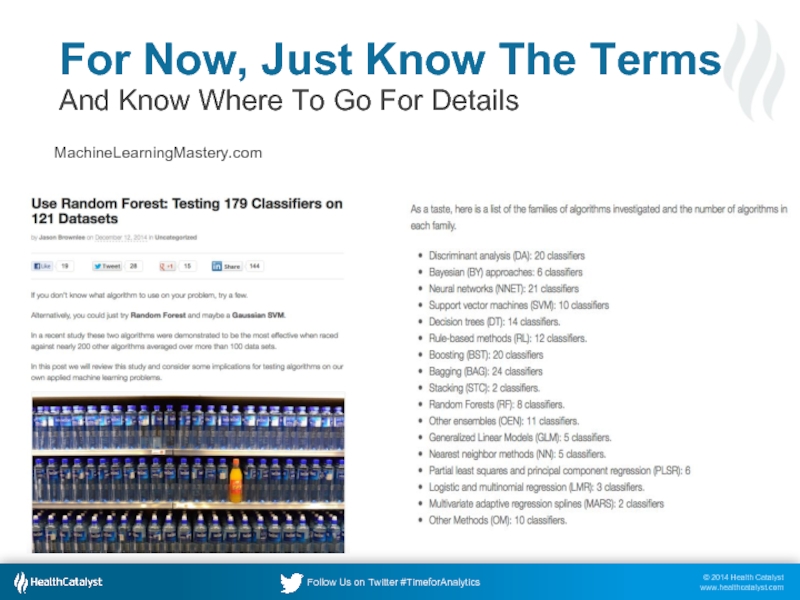
- 14. For Now, Just Know The Terms And Know Where To Go For Details
- 15. For Now, Just Know The Terms And Know Where To Go For Details MachineLearningMastery.com
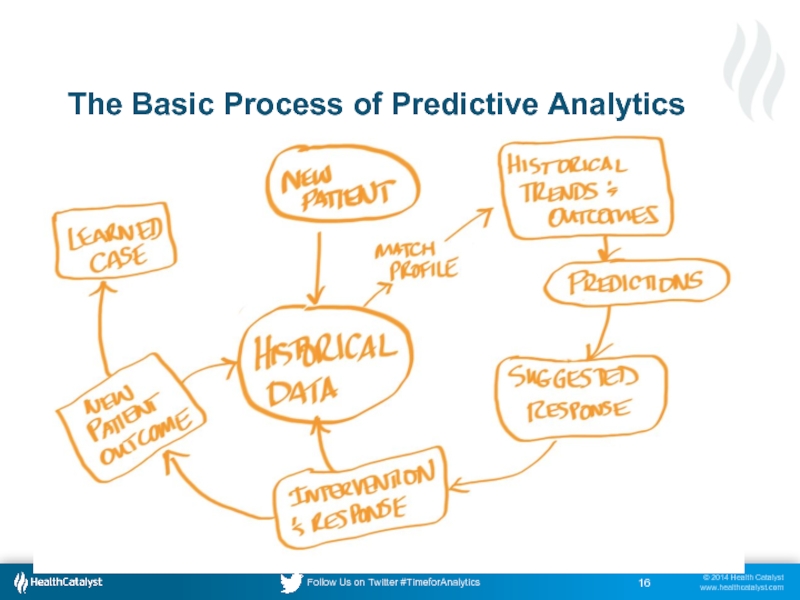
- 16. The Basic Process of Predictive Analytics
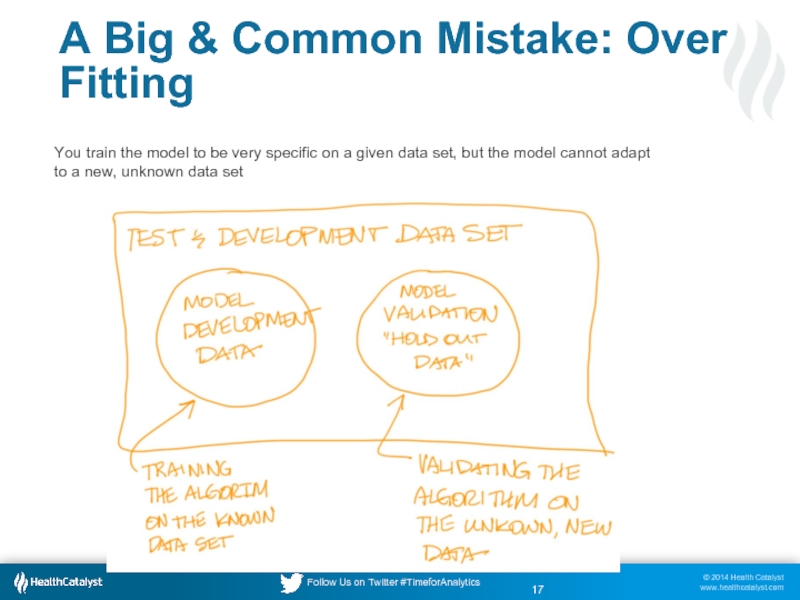
- 17. A Big & Common Mistake: Over Fitting
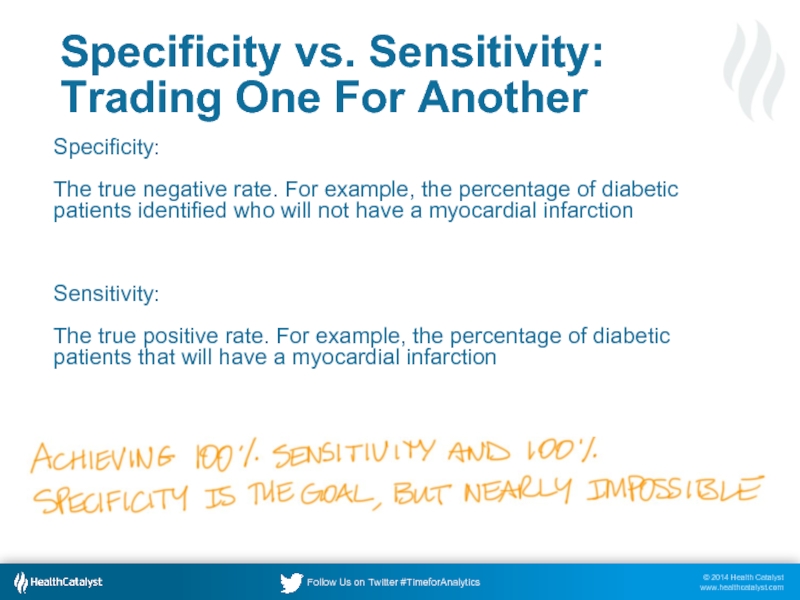
- 18. Specificity vs. Sensitivity: Trading One For
- 19. Receiver Operating Characteristic (ROC) Plot Tuning radar
- 20. Data Volume vs. Predictive Model “But invariably,
- 21. The Human Data Ecosystem
- 22. We Are Not “Big Data” in Healthcare Yet
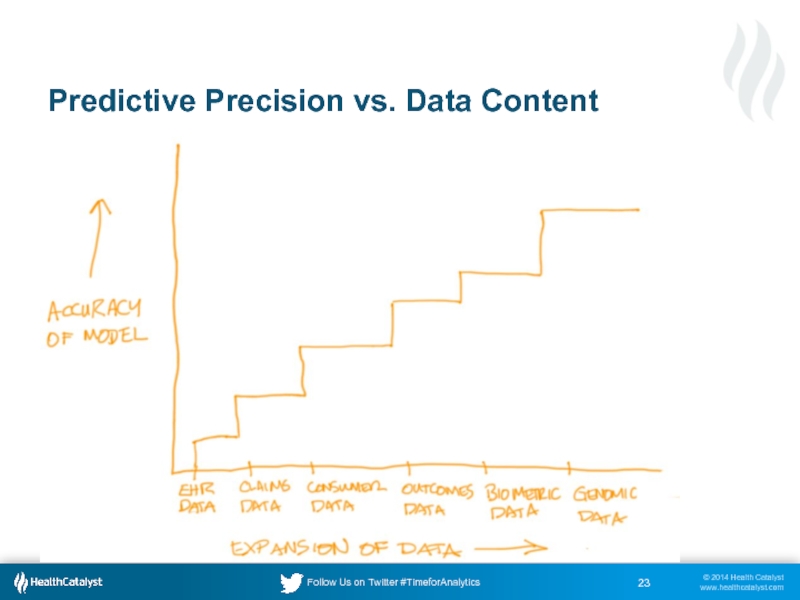
- 23. Predictive Precision vs. Data Content
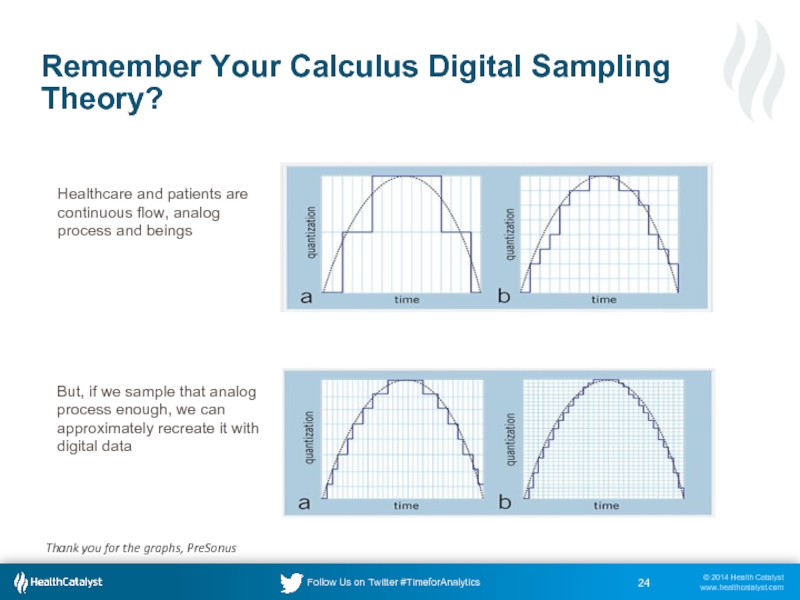
- 24. Thank you for the graphs, PreSonus Healthcare
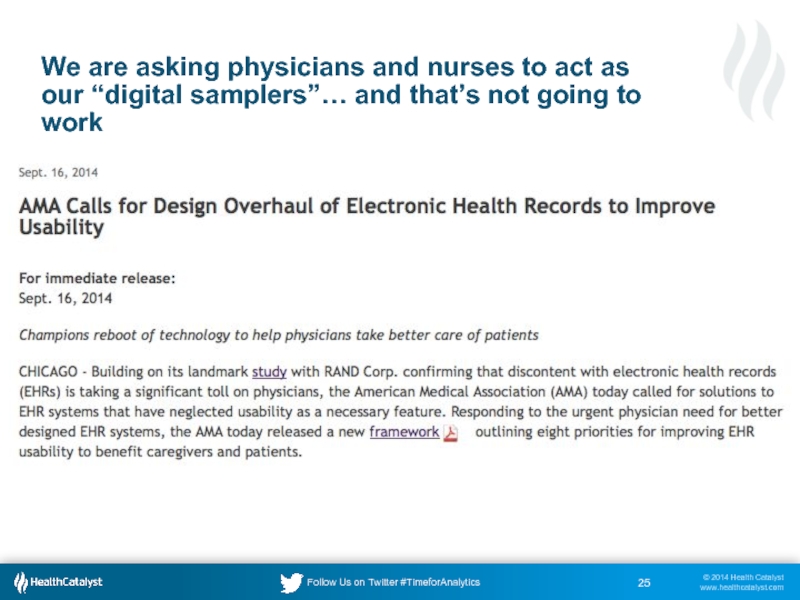
- 25. We are asking physicians and nurses to
- 26. Predictive Analytics Outside Healthcare Predictive Analytics Outside Healthcare
- 27. “Mr. Sanders, while your 9-year tenure as
- 28. Thank you Sonja Star, New York
- 29. Recidivism Risk Assessment: Level of Service/Case
- 30. “Since the publishing of Lewis' book,
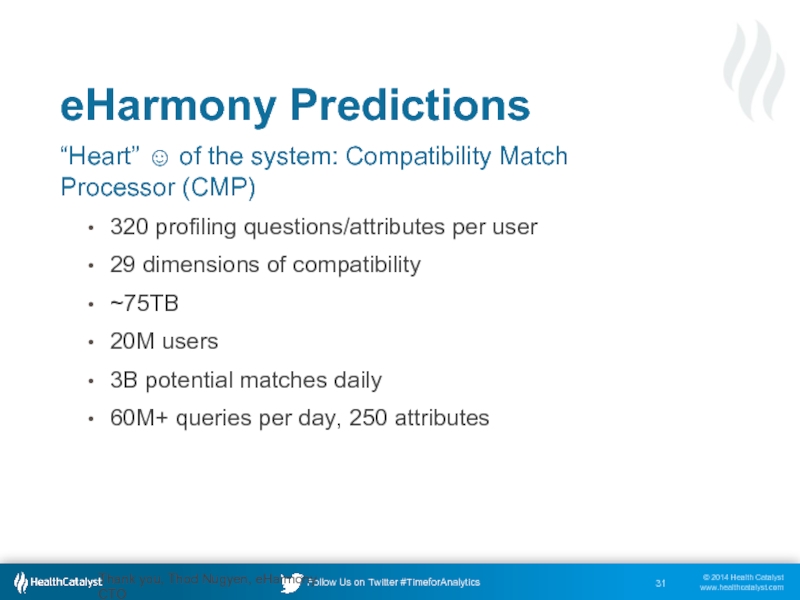
- 31. eHarmony Predictions “Heart” ☺ of the
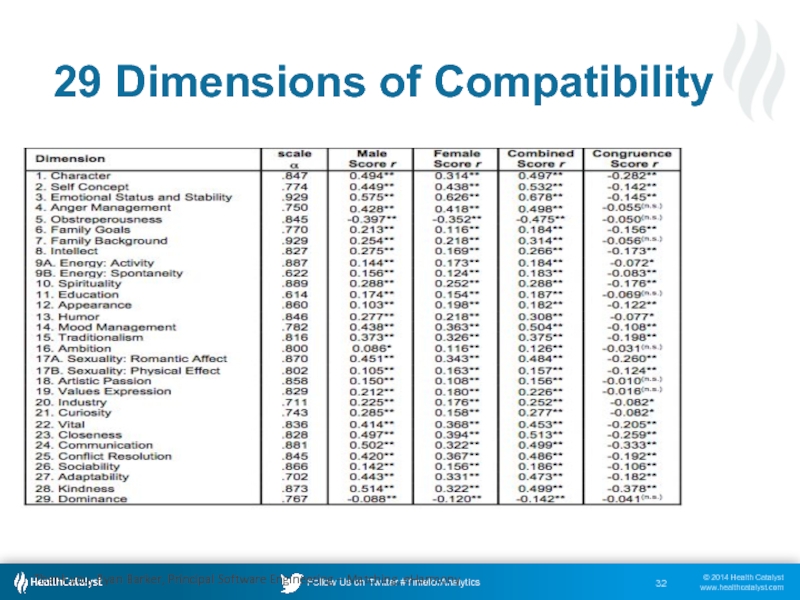
- 32. Thank you, Ryan Barker, Principal Software Engineering – Matching, eHarmony 29 Dimensions of Compatibility
- 33. Predictive Analytics Inside Healthcare
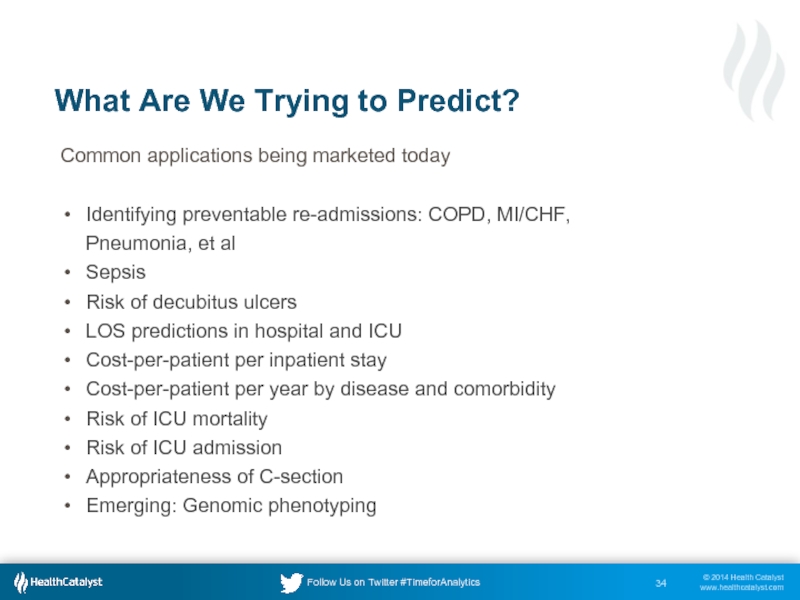
- 34. What Are We Trying to Predict? Common
- 35. True Population Predictive Risk Management Thank you,
- 36. Not all patients can functionally participate in
- 37. The key to predictive analytics in the
- 38. Return on Engagement (ROE)
- 39. Socioeconomic Data Matters
- 40. Development Partner
- 41. Flight Path “Outcomes” Examples Diabetes Cohort
- 42. True Outcomes Good Flight Path Poor Flight
- 43. Two Layers of Predictive Function Risk scores Simulation
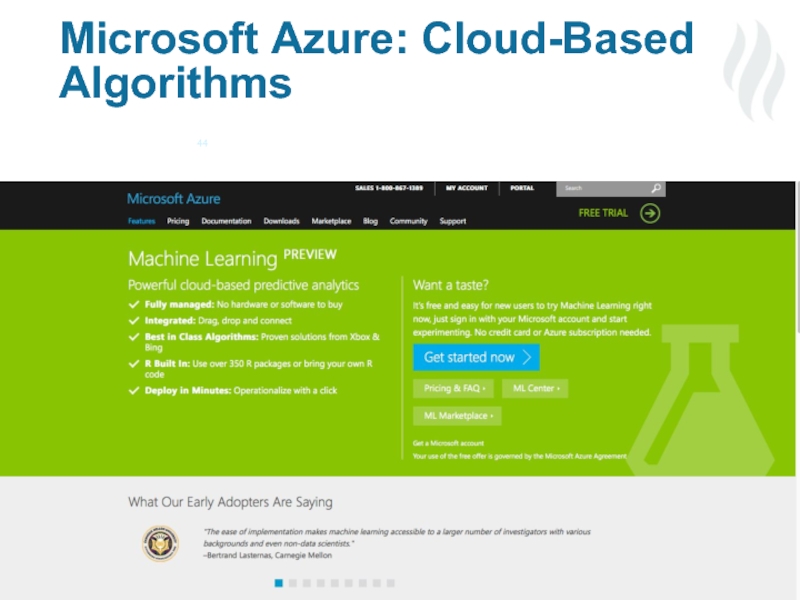
- 44. Microsoft Azure: Cloud-Based Algorithms
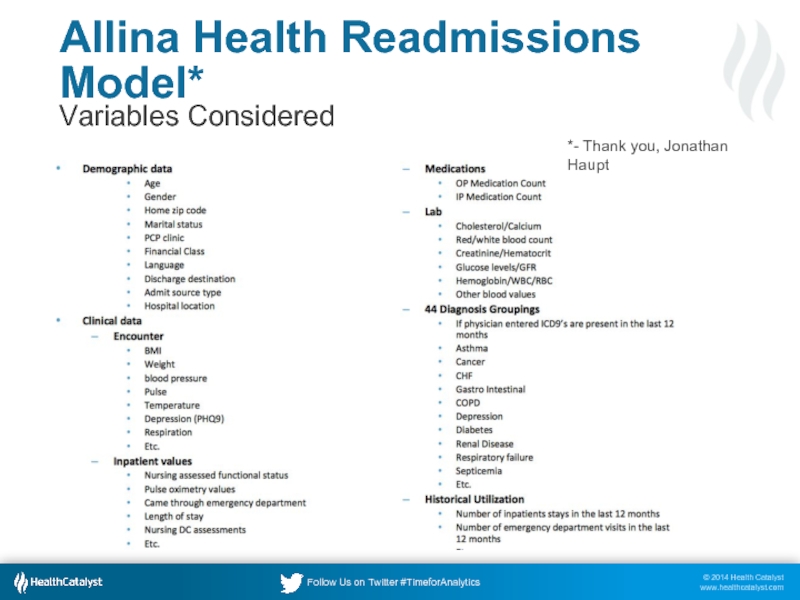
- 45. Allina Health Readmissions Model* Variables Considered *- Thank you, Jonathan Haupt
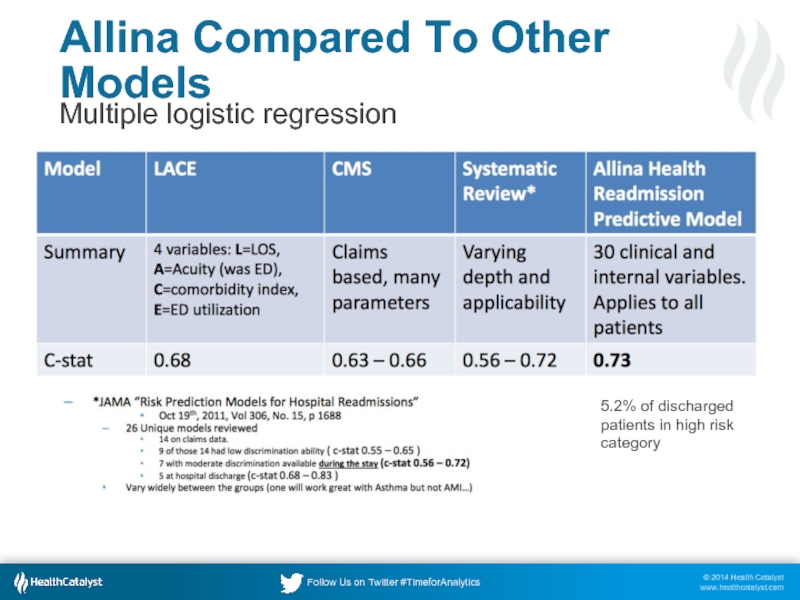
- 46. Allina Compared To Other Models Multiple logistic
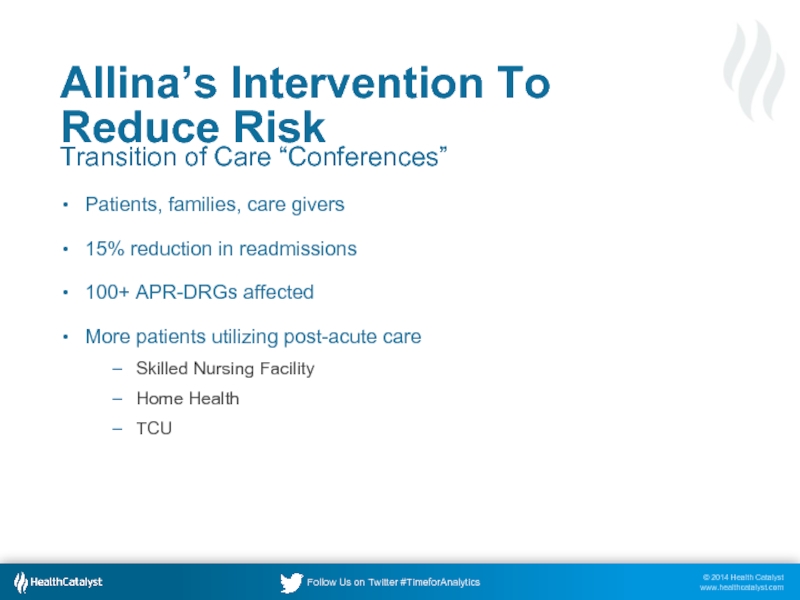
- 47. Allina’s Intervention To Reduce Risk Transition of
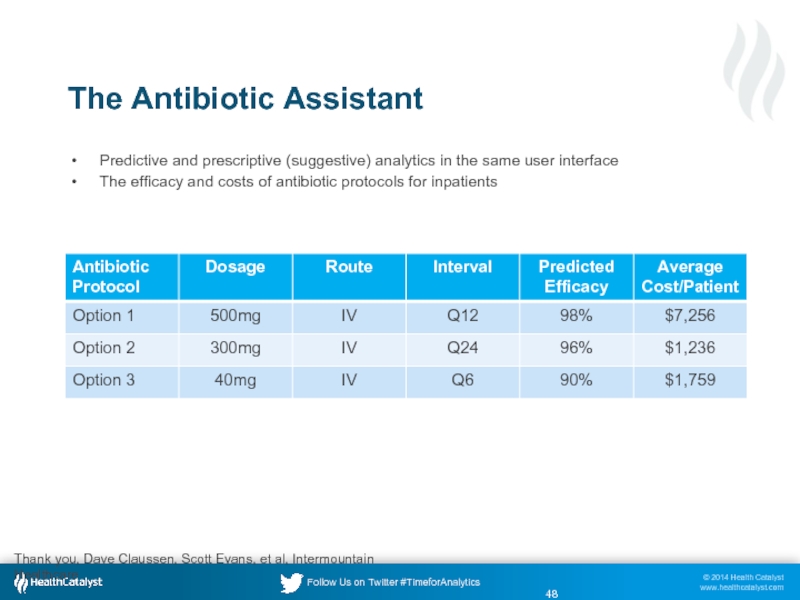
- 48. Predictive and prescriptive (suggestive) analytics in the
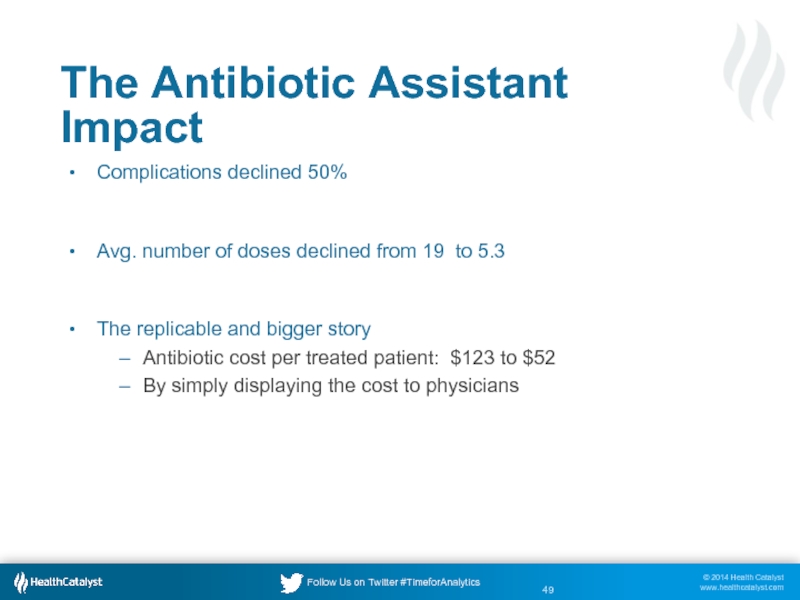
- 49. The Antibiotic Assistant Impact Complications declined 50%
- 50. Wrapping Up
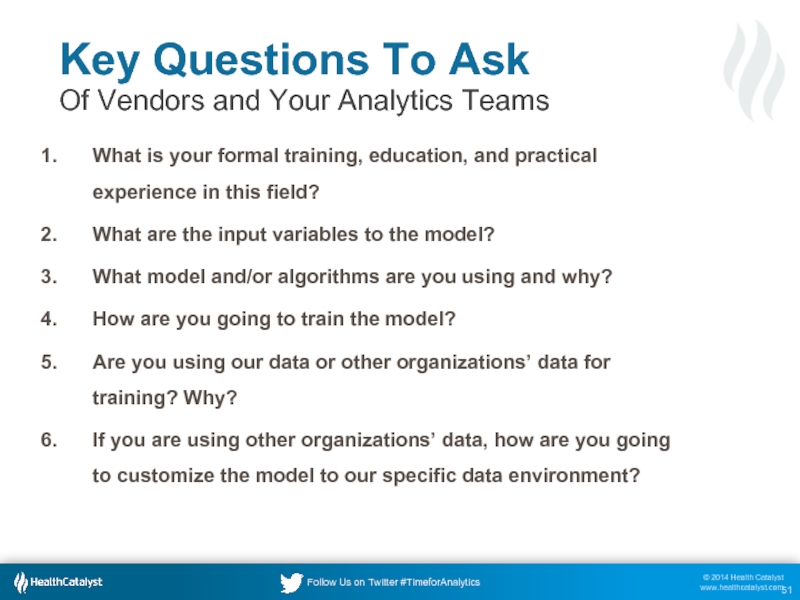
- 51. Key Questions To Ask Of Vendors and
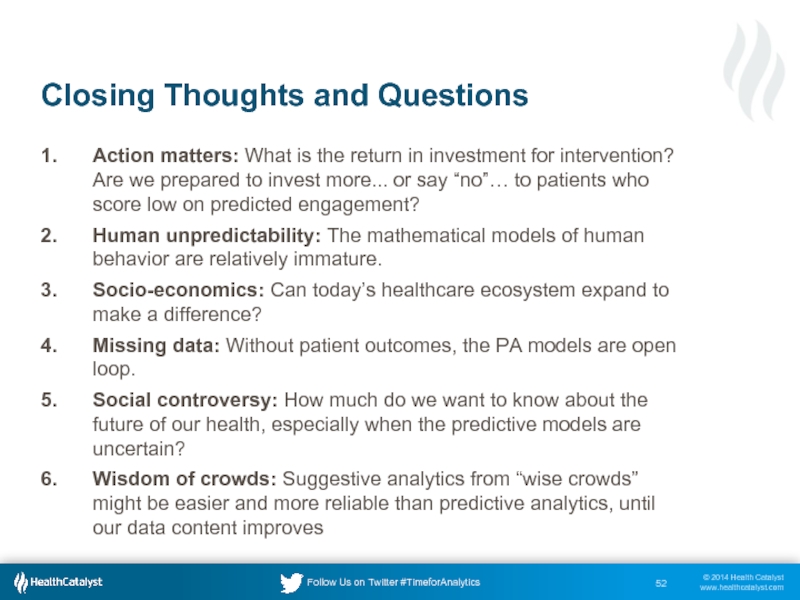
- 52. Action matters: What is the return in
- 53. Q & A Submitted prior to the webinar Submitted through the webinar chat box
- 54. Thank You For questions and follow-up, please
Слайд 1Predicting The Future Of Predictive Analytics In Healthcare
There’s A 90% Chance
Слайд 2Presenter and Contact Information
Dale Sanders
Senior Vice President, Strategy, Health Catalyst
801-708-6800
dale.sanders@healthcatalyst.com
@drsanders
www.linkedin.com/in/dalersanders/
Слайд 3Acknowledgements
David Crockett, PhD, Health Catalyst
Eric Siegel, PhD, Columbia University
Ron Gault, Aerospace
Wikipedia
Слайд 4The Goal Today
I hope you leave this webinar with…
Informed Expectations
The Right Questions: To be conversant in the concepts of predictive analytics and be able to ask reasonably well-informed questions of your analytics teams, especially vendors, during the strategic process of developing your organization’s predictive analytics strategy
Слайд 5
Agenda
Basic Concepts, Fundamental Assertions
Predictive Analytics Outside Healthcare
Predictive Analytics Inside Healthcare
Key Questions
Слайд 7
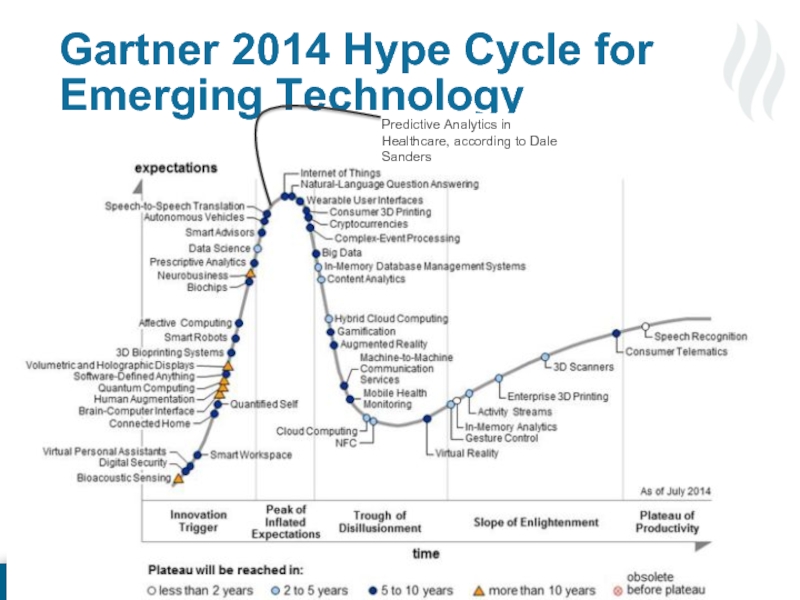
Gartner 2014 Hype Cycle for Emerging Technology
Predictive Analytics in Healthcare, according
Слайд 10What Should We Expect In Healthcare?
Machines are predictable; humans aren’t
“People are
Gary King, Harvard University and the Director of the Institute for Quantitative Social Science
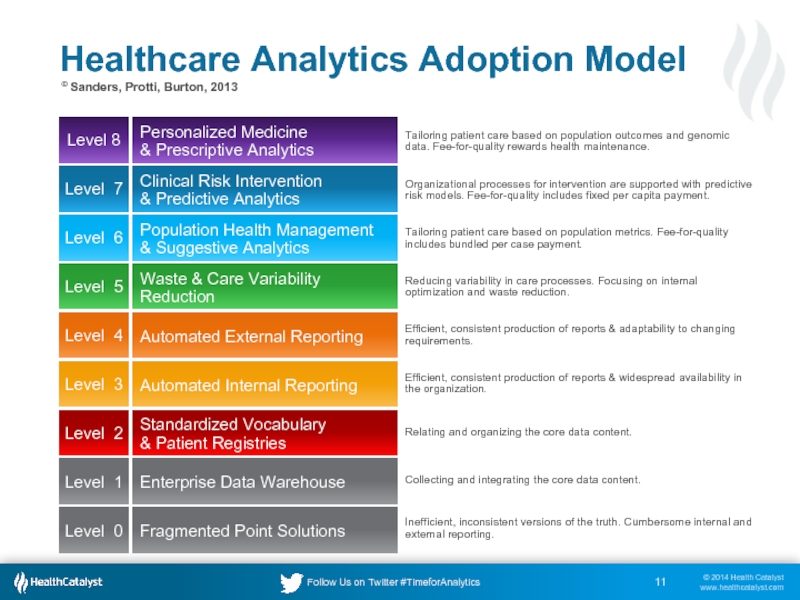
Слайд 11Healthcare Analytics Adoption Model
Level 8
Level 7
Level 6
Level 5
Level 4
Level 3
Level 2
Level
Level 0
Personalized Medicine
& Prescriptive Analytics
Clinical Risk Intervention
& Predictive Analytics
Population Health Management
& Suggestive Analytics
Waste & Care Variability Reduction
Automated External Reporting
Automated Internal Reporting
Standardized Vocabulary
& Patient Registries
Enterprise Data Warehouse
Fragmented Point Solutions
Tailoring patient care based on population outcomes and genomic data. Fee-for-quality rewards health maintenance.
Organizational processes for intervention are supported with predictive risk models. Fee-for-quality includes fixed per capita payment.
Tailoring patient care based on population metrics. Fee-for-quality includes bundled per case payment.
Reducing variability in care processes. Focusing on internal optimization and waste reduction.
Efficient, consistent production of reports & adaptability to changing requirements.
Efficient, consistent production of reports & widespread availability in the organization.
Relating and organizing the core data content.
Collecting and integrating the core data content.
Inefficient, inconsistent versions of the truth. Cumbersome internal and external reporting.
© Sanders, Protti, Burton, 2013
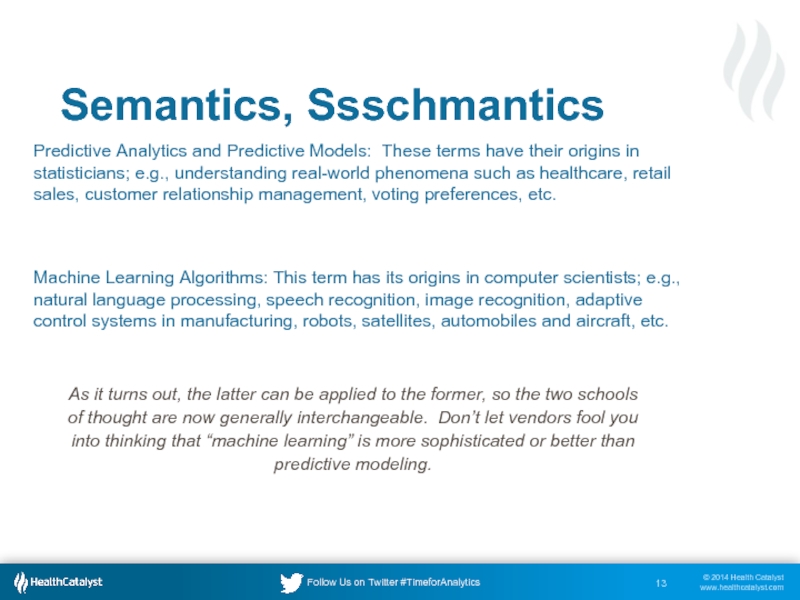
Слайд 13Semantics, Ssschmantics
Predictive Analytics and Predictive Models: These terms have their origins
Machine Learning Algorithms: This term has its origins in computer scientists; e.g., natural language processing, speech recognition, image recognition, adaptive control systems in manufacturing, robots, satellites, automobiles and aircraft, etc.
As it turns out, the latter can be applied to the former, so the two schools of thought are now generally interchangeable. Don’t let vendors fool you into thinking that “machine learning” is more sophisticated or better than predictive modeling.
Слайд 17A Big & Common Mistake: Over Fitting
You train the model to
Слайд 18Specificity vs. Sensitivity:
Trading One For Another
Specificity:
The true negative rate.
Sensitivity:
The true positive rate. For example, the percentage of diabetic patients that will have a myocardial infarction
Слайд 19Receiver Operating Characteristic (ROC) Plot
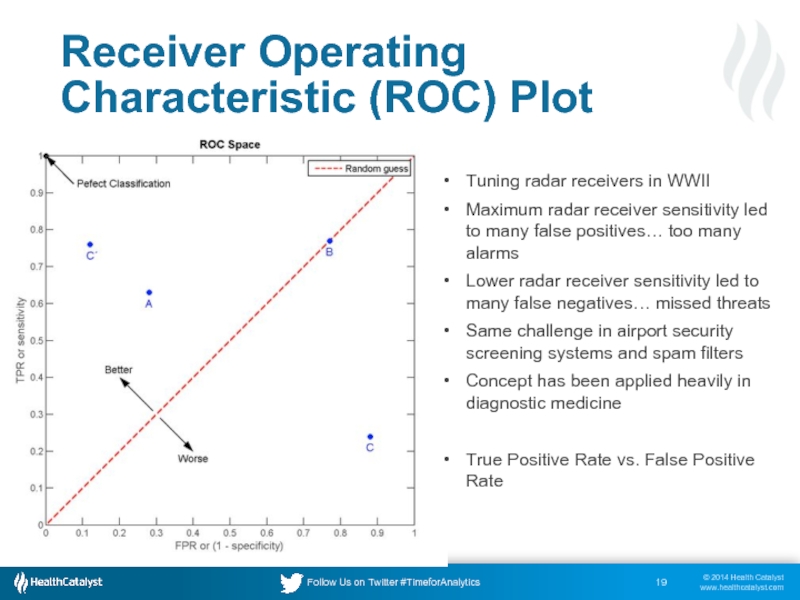
Tuning radar receivers in WWII
Maximum radar receiver
Lower radar receiver sensitivity led to many false negatives… missed threats
Same challenge in airport security screening systems and spam filters
Concept has been applied heavily in diagnostic medicine
True Positive Rate vs. False Positive Rate
Слайд 20Data Volume vs. Predictive Model
“But invariably, simple models and a lot
“The Unreasonable Effectiveness of Data”, March 2009, IEEE Computer Society; Alon Halevy, Peter Norvig, and Fernando Pereira, Google
Слайд 24Thank you for the graphs, PreSonus
Healthcare and patients are continuous flow,
But, if we sample that analog process enough, we can approximately recreate it with digital data
Remember Your Calculus Digital Sampling Theory?
Слайд 25We are asking physicians and nurses to act as our “digital
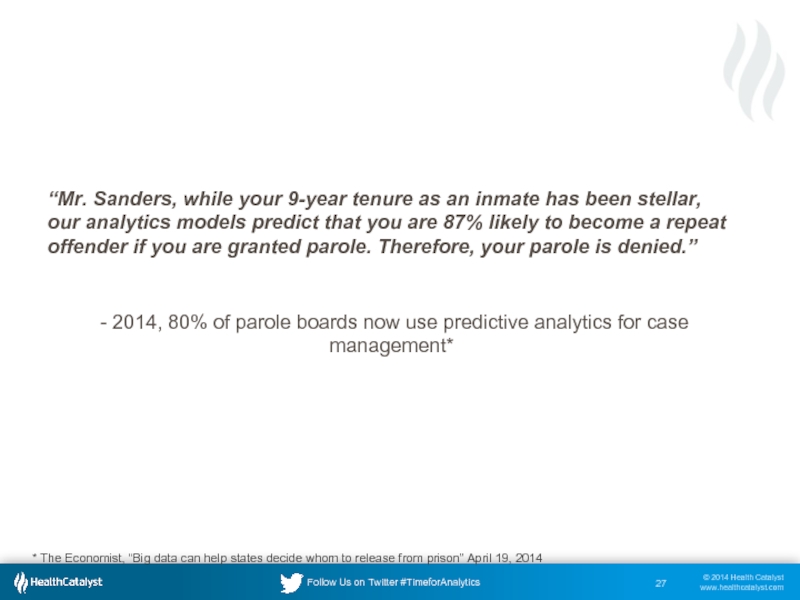
Слайд 27“Mr. Sanders, while your 9-year tenure as an inmate has been
- 2014, 80% of parole boards now use predictive analytics for case management*
* The Economist, “Big data can help states decide whom to release from prison” April 19, 2014
Слайд 28
Thank you Sonja Star, New York Times
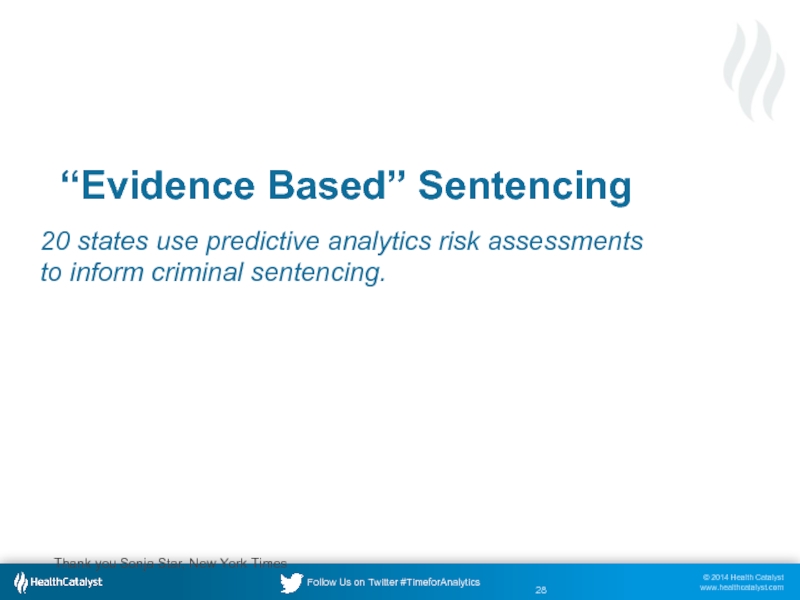
“Evidence Based” Sentencing
20 states use
“Evidence Based” Sentencing
Слайд 29Recidivism Risk Assessment:
Level of Service/Case Management Inventory (LS/CMI)*
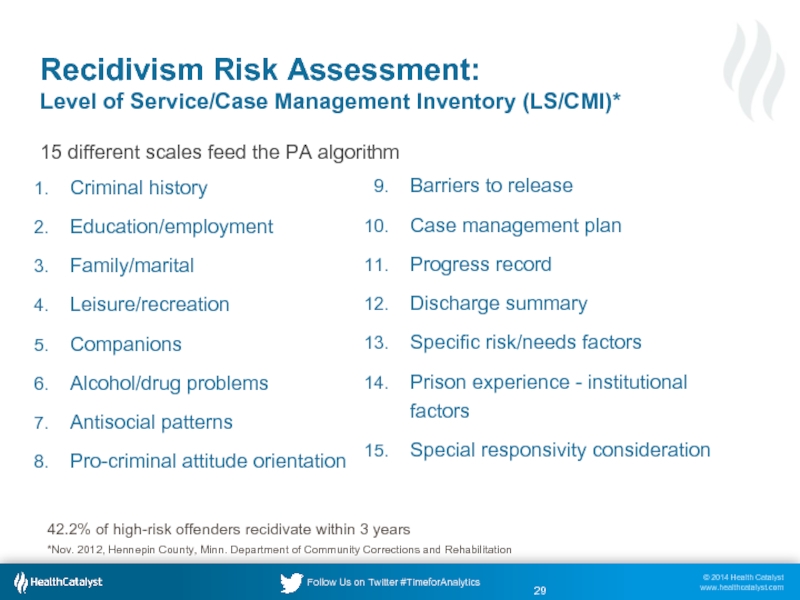
15 different scales
Criminal history
Education/employment
Family/marital
Leisure/recreation
Companions
Alcohol/drug problems
Antisocial patterns
Pro-criminal attitude orientation
Barriers to release
Case management plan
Progress record
Discharge summary
Specific risk/needs factors
Prison experience - institutional factors
Special responsivity consideration
42.2% of high-risk offenders recidivate within 3 years
*Nov. 2012, Hennepin County, Minn. Department of Community Corrections and Rehabilitation
Слайд 30
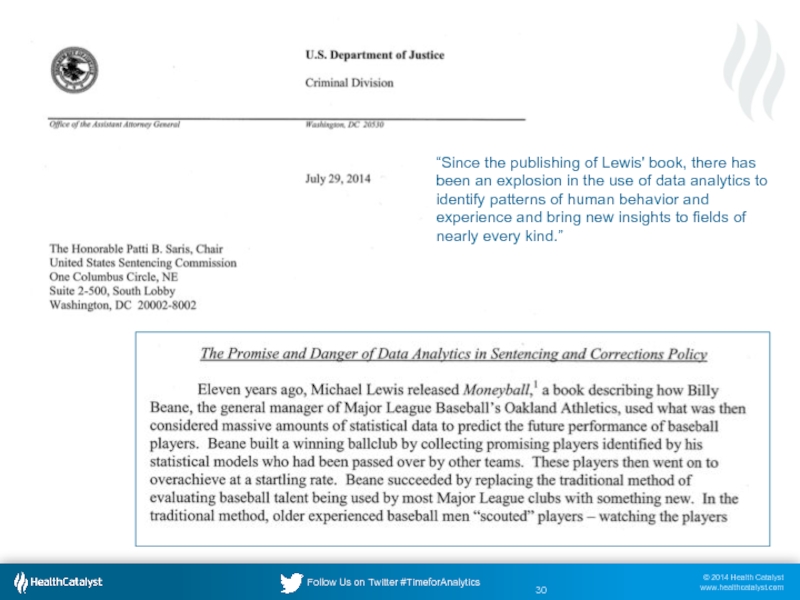
“Since the publishing of Lewis' book, there has been an explosion
Слайд 31
eHarmony Predictions
“Heart” ☺ of the system: Compatibility Match Processor (CMP)
320 profiling
29 dimensions of compatibility
~75TB
20M users
3B potential matches daily
60M+ queries per day, 250 attributes
Thank you, Thod Nugyen, eHarmony CTO
Слайд 32Thank you, Ryan Barker, Principal Software Engineering – Matching, eHarmony
29 Dimensions
Слайд 34What Are We Trying to Predict?
Common applications being marketed today
Identifying preventable
Sepsis
Risk of decubitus ulcers
LOS predictions in hospital and ICU
Cost-per-patient per inpatient stay
Cost-per-patient per year by disease and comorbidity
Risk of ICU mortality
Risk of ICU admission
Appropriateness of C-section
Emerging: Genomic phenotyping
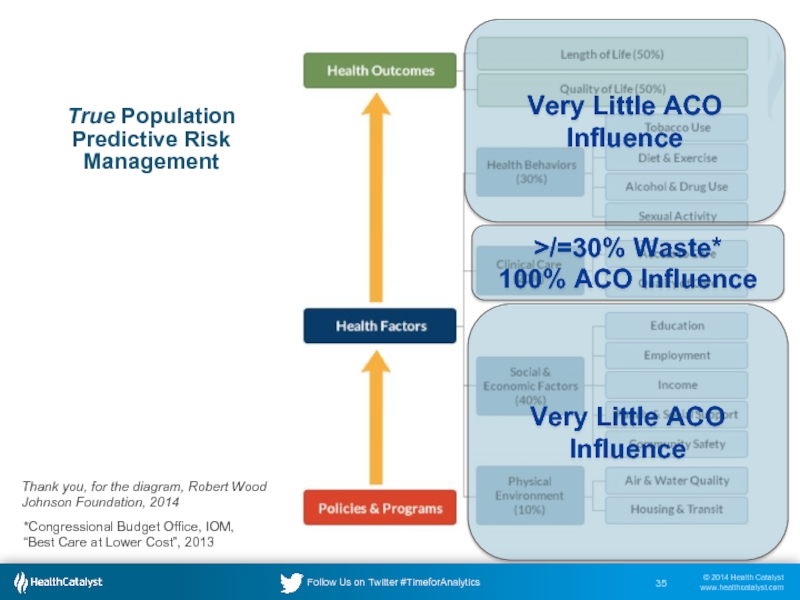
Слайд 35True Population Predictive Risk Management
Thank you, for the diagram, Robert Wood
Very Little ACO Influence
Very Little ACO Influence
>/=30% Waste*
100% ACO Influence
*Congressional Budget Office, IOM, “Best Care at Lower Cost”, 2013
True Population Health Management
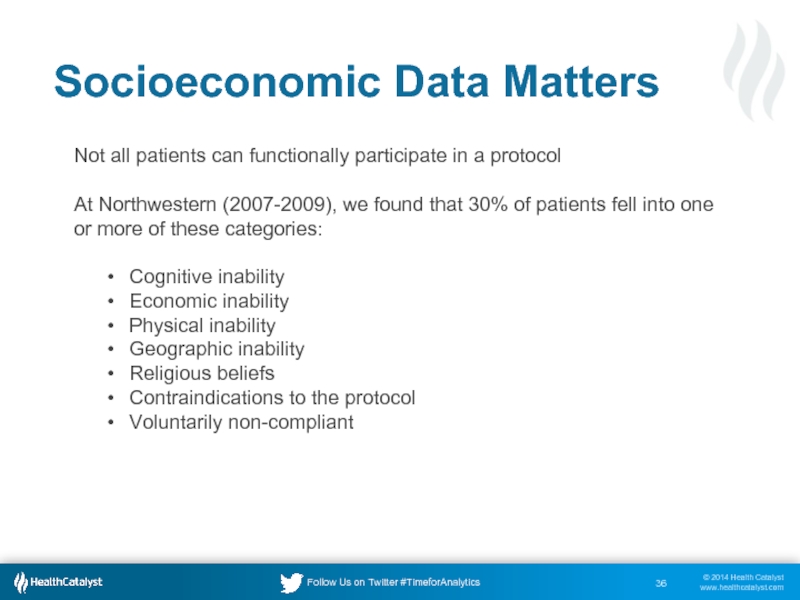
Слайд 36Not all patients can functionally participate in a protocol
At Northwestern (2007-2009),
Cognitive inability
Economic inability
Physical inability
Geographic inability
Religious beliefs
Contraindications to the protocol
Voluntarily non-compliant
Socioeconomic Data Matters
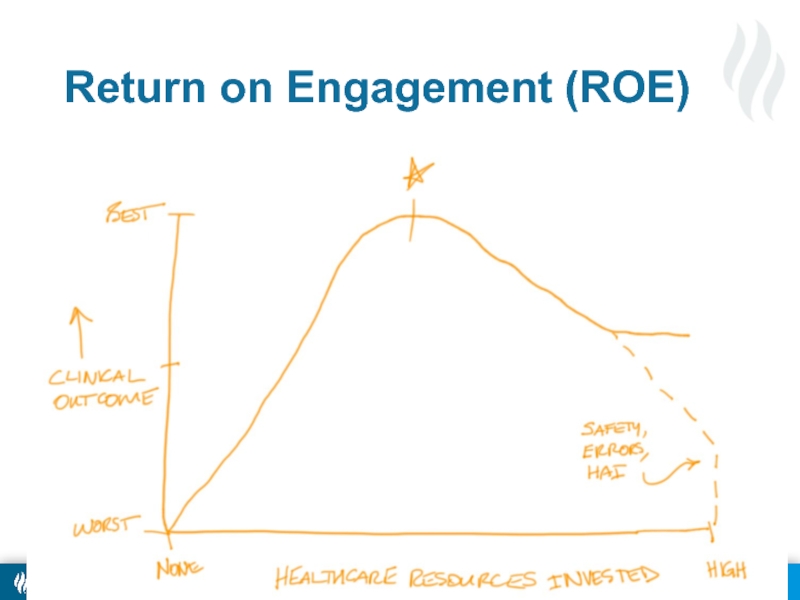
Слайд 37The key to predictive analytics in the future of health care
What’s the probability of influencing this patient’s behavior towards our desired outcome and how much effort (cost) will be required for that influence?
Return on Engagement (ROE)
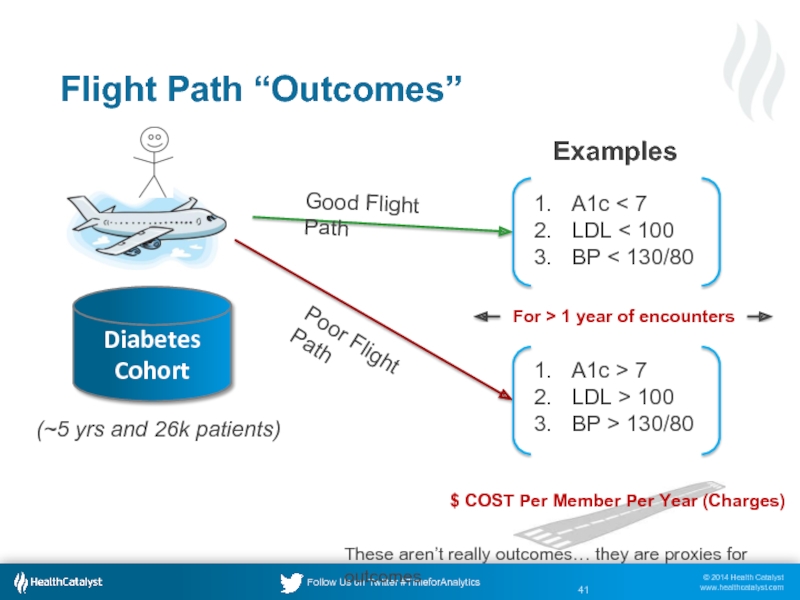
Слайд 41Flight Path “Outcomes”
Examples
Diabetes
Cohort
Good Flight Path
Poor Flight Path
$ COST Per Member
For > 1 year of encounters
(~5 yrs and 26k patients)
These aren’t really outcomes… they are proxies for outcomes
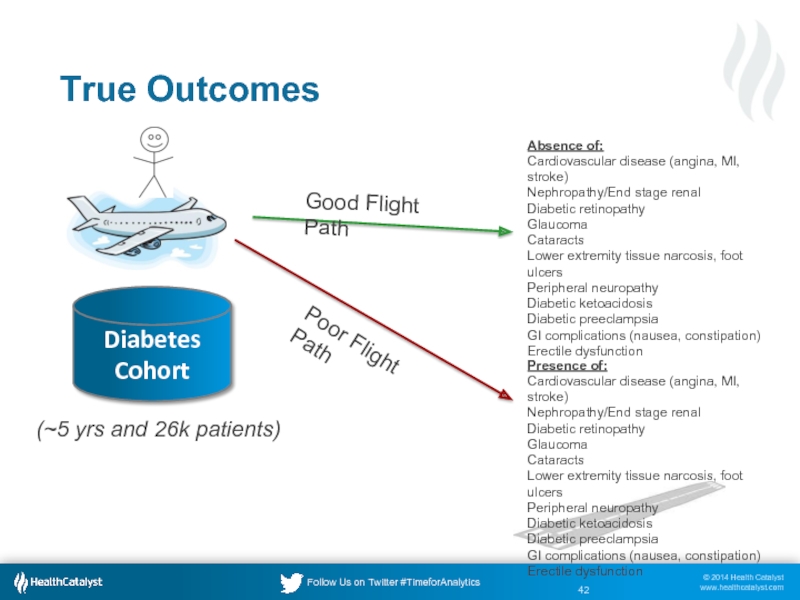
Слайд 42True Outcomes
Good Flight Path
Poor Flight Path
Absence of:
Cardiovascular disease (angina, MI, stroke)
Nephropathy/End
Diabetic retinopathy
Glaucoma
Cataracts
Lower extremity tissue narcosis, foot ulcers
Peripheral neuropathy
Diabetic ketoacidosis
Diabetic preeclampsia
GI complications (nausea, constipation)
Erectile dysfunction
Presence of:
Cardiovascular disease (angina, MI, stroke)
Nephropathy/End stage renal
Diabetic retinopathy
Glaucoma
Cataracts
Lower extremity tissue narcosis, foot ulcers
Peripheral neuropathy
Diabetic ketoacidosis
Diabetic preeclampsia
GI complications (nausea, constipation)
Erectile dysfunction
Diabetes
Cohort
(~5 yrs and 26k patients)
Слайд 46Allina Compared To Other Models
Multiple logistic regression
5.2% of discharged patients in
Слайд 47Allina’s Intervention To Reduce Risk
Transition of Care “Conferences”
Patients, families, care givers
15%
100+ APR-DRGs affected
More patients utilizing post-acute care
Skilled Nursing Facility
Home Health
TCU
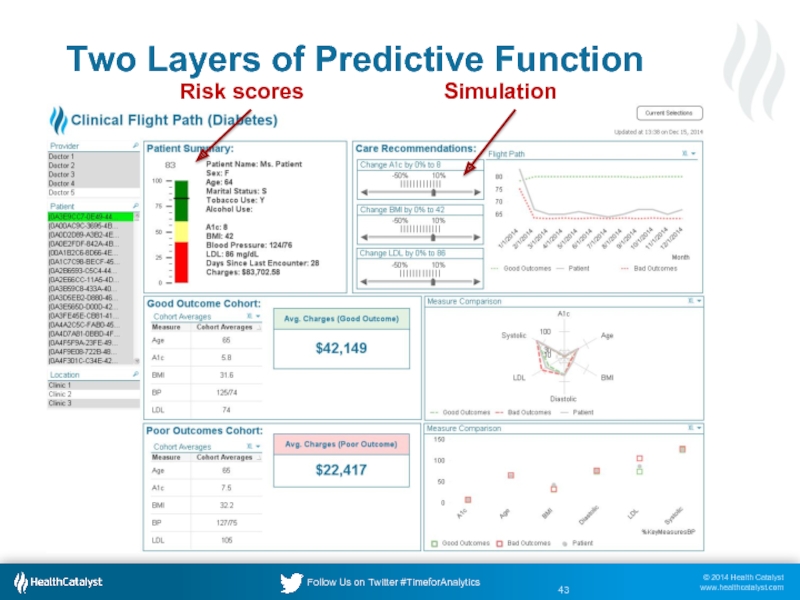
Слайд 48Predictive and prescriptive (suggestive) analytics in the same user interface
The efficacy
Thank you, Dave Claussen, Scott Evans, et al, Intermountain Healthcare
The Antibiotic Assistant
Слайд 49The Antibiotic Assistant Impact
Complications declined 50%
Avg. number of doses declined from
The replicable and bigger story
Antibiotic cost per treated patient: $123 to $52
By simply displaying the cost to physicians
Слайд 51Key Questions To Ask
Of Vendors and Your Analytics Teams
What is your
What are the input variables to the model?
What model and/or algorithms are you using and why?
How are you going to train the model?
Are you using our data or other organizations’ data for training? Why?
If you are using other organizations’ data, how are you going to customize the model to our specific data environment?
Слайд 52Action matters: What is the return in investment for intervention? Are
Human unpredictability: The mathematical models of human behavior are relatively immature.
Socio-economics: Can today’s healthcare ecosystem expand to make a difference?
Missing data: Without patient outcomes, the PA models are open loop.
Social controversy: How much do we want to know about the future of our health, especially when the predictive models are uncertain?
Wisdom of crowds: Suggestive analytics from “wise crowds” might be easier and more reliable than predictive analytics, until our data content improves
Closing Thoughts and Questions
Слайд 54Thank You
For questions and follow-up, please contact me
dale.sanders@healthcatalyst.com
@drsanders
Upcoming Educational Opportunities
An Overview
Date: January 21, 2015, 1-2pm, EST
Host: Jim Adams, Executive Director, The Advisory Board
A Pioneer ACO Case Study: Quality Improvement in Healthcare
Date: January 28, 2015, 1-2pm, EST
Hosts:
Robert Sawicki, MD, Senior Vice President of Supportive Care, OSF HealthCare
Roopa Foulger, Executive Director Data Delivery, OSF HealthCare
Linda Fehr, RN, Division Director of Supportive Care, OSF HealthCare
