- Главная
- Разное
- Дизайн
- Бизнес и предпринимательство
- Аналитика
- Образование
- Развлечения
- Красота и здоровье
- Финансы
- Государство
- Путешествия
- Спорт
- Недвижимость
- Армия
- Графика
- Культурология
- Еда и кулинария
- Лингвистика
- Английский язык
- Астрономия
- Алгебра
- Биология
- География
- Детские презентации
- Информатика
- История
- Литература
- Маркетинг
- Математика
- Медицина
- Менеджмент
- Музыка
- МХК
- Немецкий язык
- ОБЖ
- Обществознание
- Окружающий мир
- Педагогика
- Русский язык
- Технология
- Физика
- Философия
- Химия
- Шаблоны, картинки для презентаций
- Экология
- Экономика
- Юриспруденция
Perils of Perception A FOURTEEN COUNTRY STUDY презентация
Содержание
- 1. Perils of Perception A FOURTEEN COUNTRY STUDY
- 2. These are the findings from
- 3. IN YOUR OPINION WHAT PERCENTAGE
- 4. % POINT DIFFERENCE TOO HIGH
- 5. Average guess % % Girls aged
- 6. WHAT PERCENTAGE OF THE POPULATION DO YOU THINK ARE IMMIGRANTS TO THIS COUNTRY?
- 7. % POINT DIFFERENCE TOO HIGH
- 8. Average guess % % Immigrants to this
- 9. OUT OF EVERY 100 PEOPLE HOW MANY DO YOU THINK ARE MUSLIM?
- 10. TOO HIGH % POINT DIFFERENCE
- 11. Average guess % % Muslims Lorem ipsum
- 12. National Perceptions OUT OF EVERY 100 PEOPLE HOW MANY DO YOU THINK ARE CHRISTIAN?
- 13. % POINT DIFFERENCE TOO LOW TOO
- 14. Average guess % % Christians Lorem ipsum
- 15. National Perceptions OUT OF EVERY 100
- 16. % POINT DIFFERENCE TOO HIGH
- 17. Average guess % % Over 65 Lorem
- 18. National Perceptions OUT OF EVERY 100
- 19. % POINT DIFFERENCE TOO LOW
- 20. Average guess % % Voted in
- 21. National Perceptions OUT OF EVERY 100
- 22. % POINT DIFFERENCE TOO HIGH
- 23. Average guess % % Unemployed and looking
- 24. National Perceptions WHAT DO YOU THINK
- 25. Q. What do you
- 26. Average guess % Average life expectancy
- 27. Looking across all questions, we
- 29. National Perceptions PERILS OF PERCEPTION IN BRITAIN
- 30. PERILS OF PERCEPTION IN BRITAIN
- 31. % who thought immigration is
- 32. CRIME Please tell me whether
- 33. This study is based on a
- 34. © Ipsos MORI Source: Ipsos
Слайд 2
These are the findings from our 14 country study looking at
It shows how wrong we often are:
Perceptions are not reality…
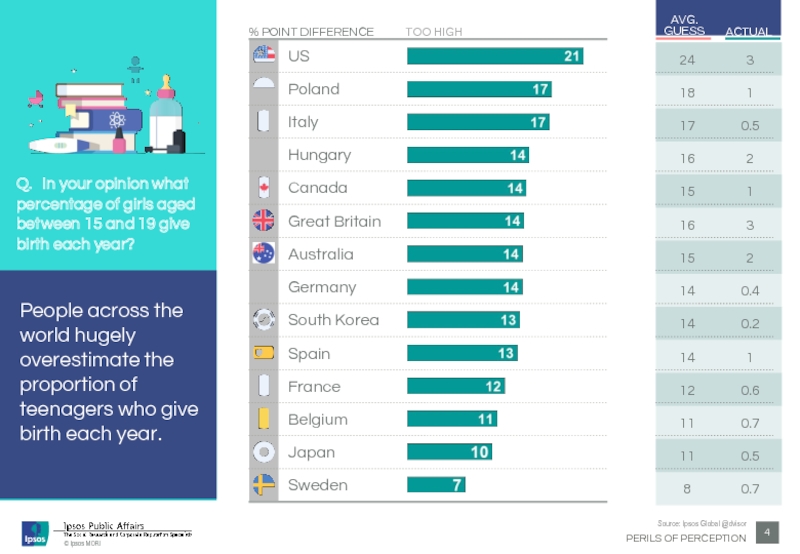
Слайд 4% POINT DIFFERENCE
TOO HIGH
Q. In your opinion what percentage of
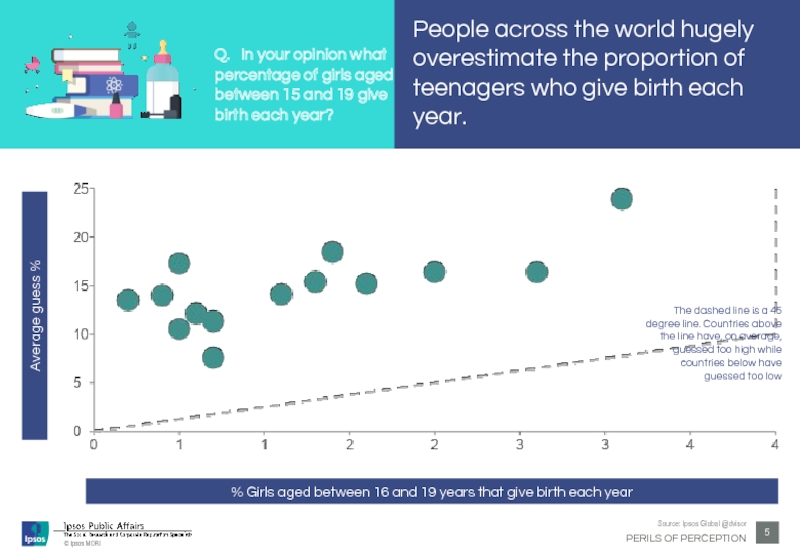
People across the world hugely overestimate the proportion of teenagers who give birth each year.
Слайд 5Average guess %
% Girls aged between 16 and 19 years
People across the world hugely overestimate the proportion of teenagers who give birth each year.
The dashed line is a 45 degree line. Countries above the line have, on average, guessed too high while countries below have guessed too low
Q. In your opinion what percentage of girls aged between 15 and 19 give birth each year?
Слайд 7% POINT DIFFERENCE
TOO HIGH
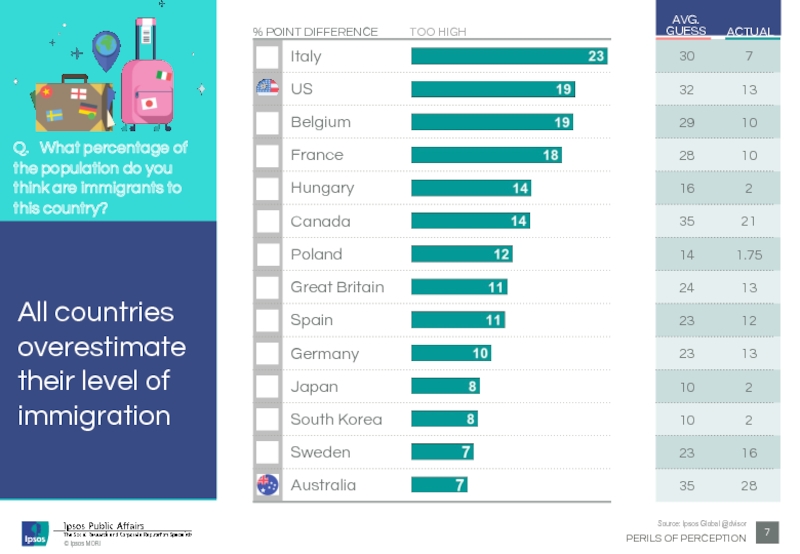
Q. What percentage of the population do
All countries overestimate their level of immigration
Слайд 8Average guess %
% Immigrants to this country
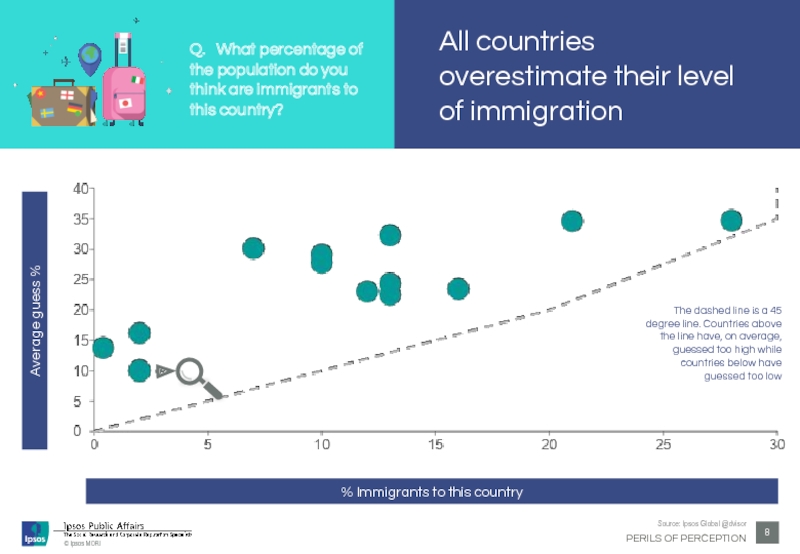
Q. What percentage of
All countries overestimate their level of immigration
The dashed line is a 45 degree line. Countries above the line have, on average, guessed too high while countries below have guessed too low
Слайд 10TOO HIGH
% POINT DIFFERENCE
Q. Out of every 100 people how
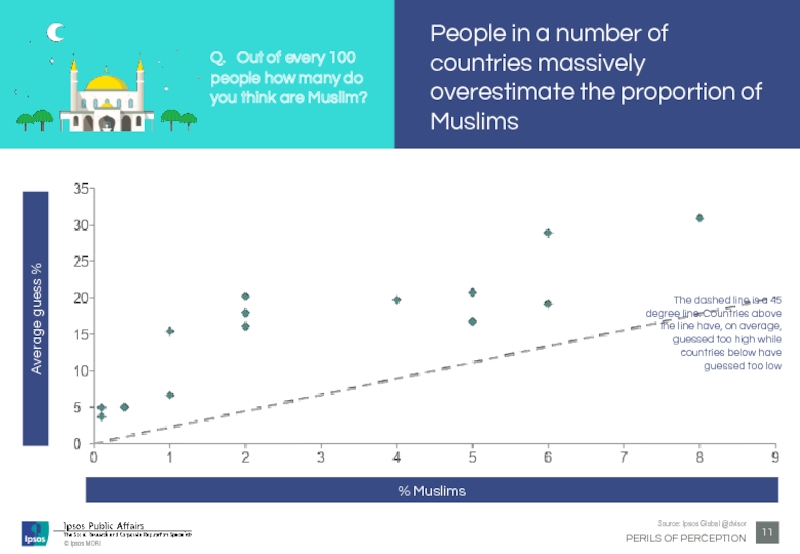
People in a number of countries massively overestimate the proportion of Muslims
Слайд 11Average guess %
% Muslims
Lorem ipsum dolor sit amet, consectetur adipiscing elit,
Q. Out of every 100 people how many do you think are Muslim?
People in a number of countries massively overestimate the proportion of Muslims
The dashed line is a 45 degree line. Countries above the line have, on average, guessed too high while countries below have guessed too low
Слайд 13
% POINT DIFFERENCE
TOO LOW
TOO HIGH
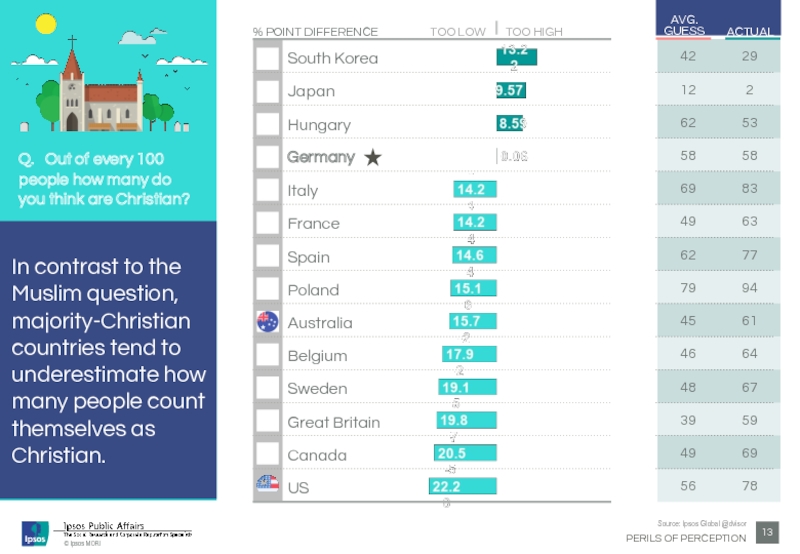
Q. Out of every 100 people
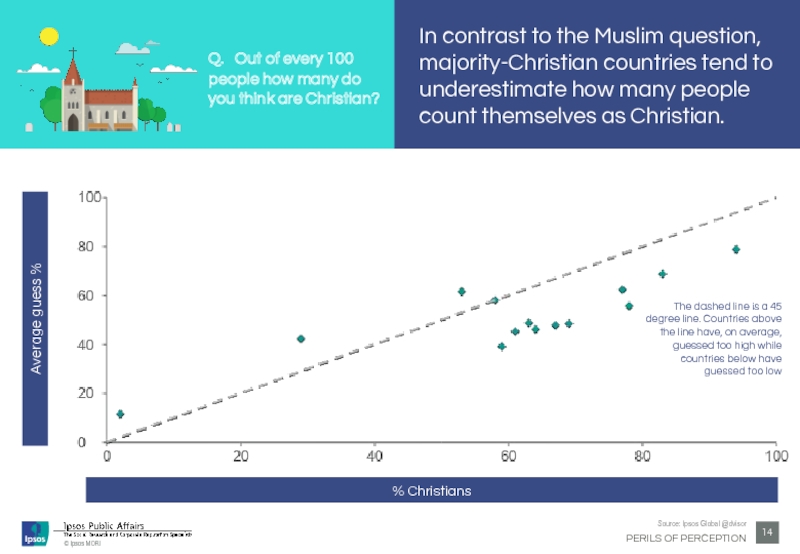
In contrast to the Muslim question, majority-Christian countries tend to underestimate how many people count themselves as Christian.
Слайд 14Average guess %
% Christians
Lorem ipsum dolor sit amet, consectetur adipiscing elit,
Q. Out of every 100 people how many do you think are Christian?
In contrast to the Muslim question, majority-Christian countries tend to underestimate how many people count themselves as Christian.
The dashed line is a 45 degree line. Countries above the line have, on average, guessed too high while countries below have guessed too low
Слайд 16% POINT DIFFERENCE
TOO HIGH
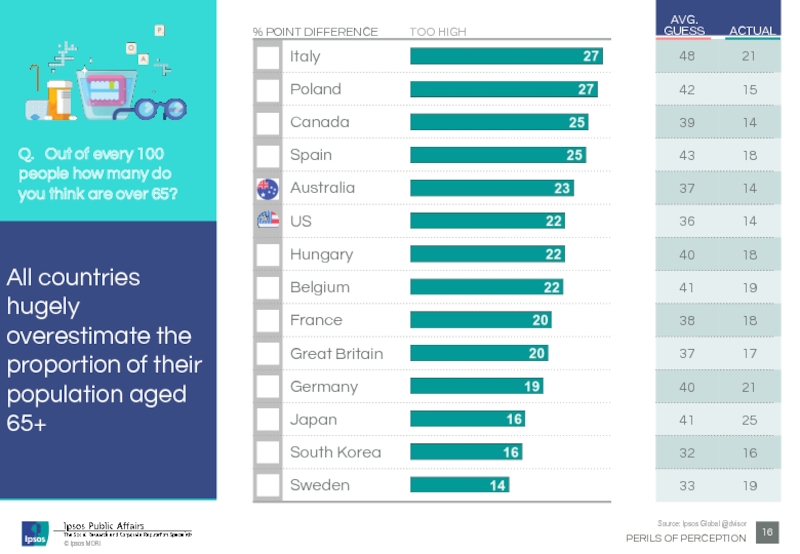
Q. Out of every 100 people how
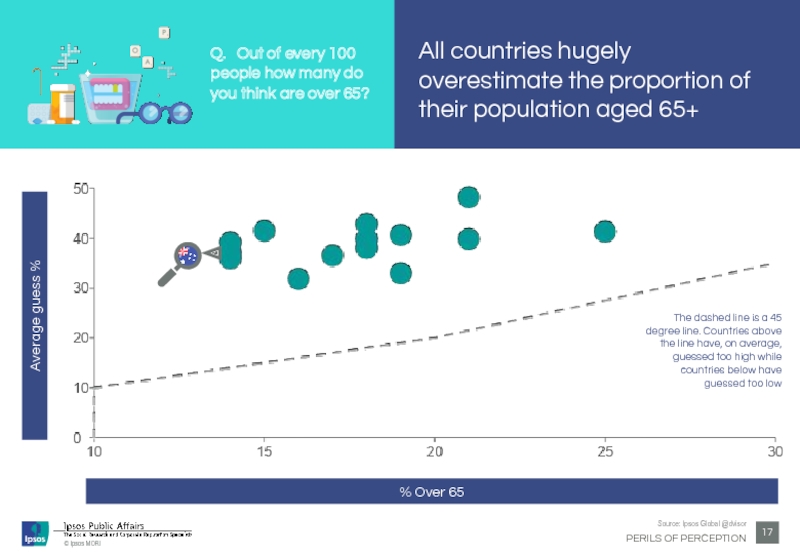
All countries hugely overestimate the proportion of their population aged 65+
Слайд 17Average guess %
% Over 65
Lorem ipsum dolor sit amet, consectetur adipiscing
Q. Out of every 100 people how many do you think are over 65?
All countries hugely overestimate the proportion of their population aged 65+
The dashed line is a 45 degree line. Countries above the line have, on average, guessed too high while countries below have guessed too low
Слайд 18National Perceptions
OUT OF EVERY 100 ELIGIBLE VOTERS ABOUT HOW MANY DO
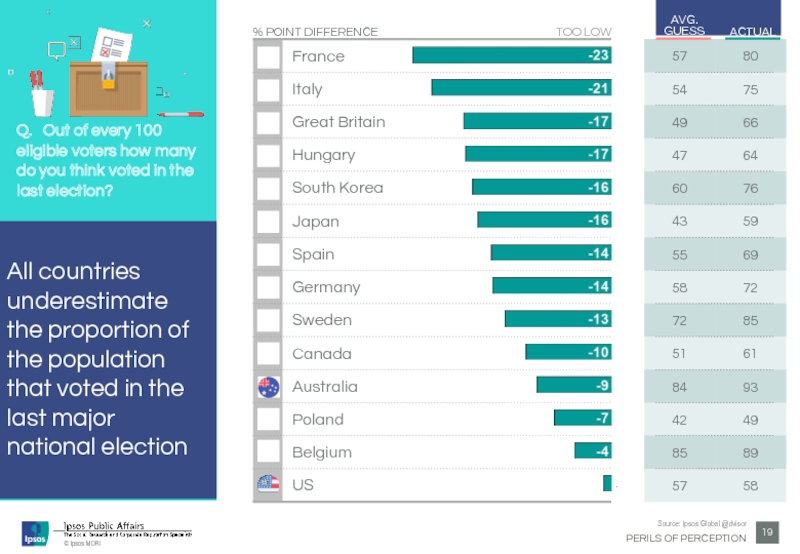
Слайд 19% POINT DIFFERENCE
TOO LOW
Q. Out of every 100 eligible voters
All countries underestimate the proportion of the population that voted in the last major national election
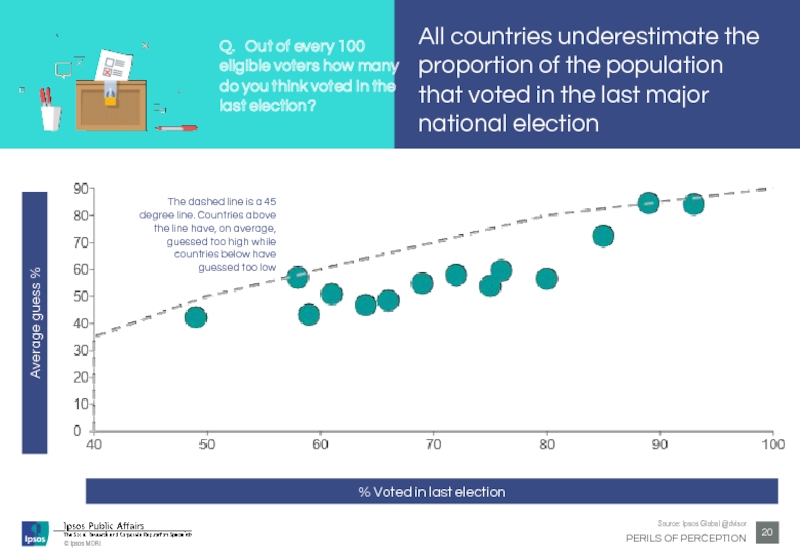
Слайд 20Average guess %
% Voted in last election
Lorem ipsum dolor sit
Q. Out of every 100 eligible voters how many do you think voted in the last election?
All countries underestimate the proportion of the population that voted in the last major national election
The dashed line is a 45 degree line. Countries above the line have, on average, guessed too high while countries below have guessed too low
Слайд 21National Perceptions
OUT OF EVERY 100 PEOPLE OF WORKING AGE ABOUT HOW
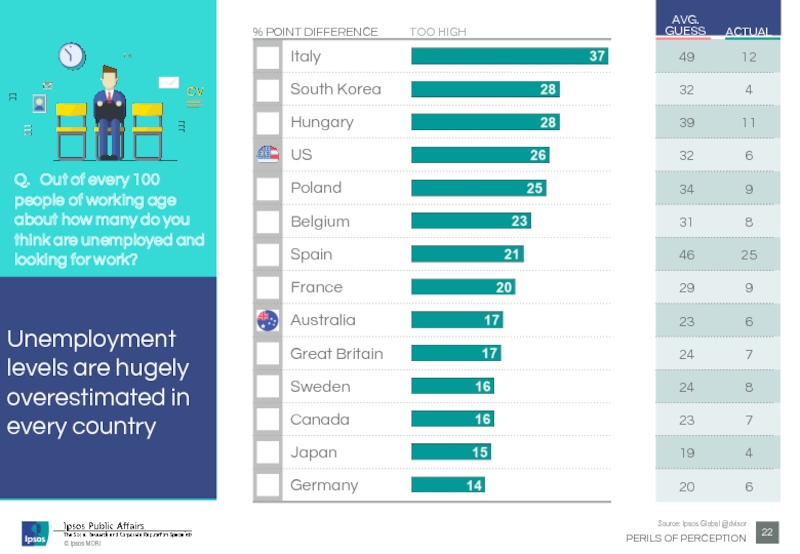
Слайд 22% POINT DIFFERENCE
TOO HIGH
Q. Out of every 100 people of
Unemployment levels are hugely overestimated in every country
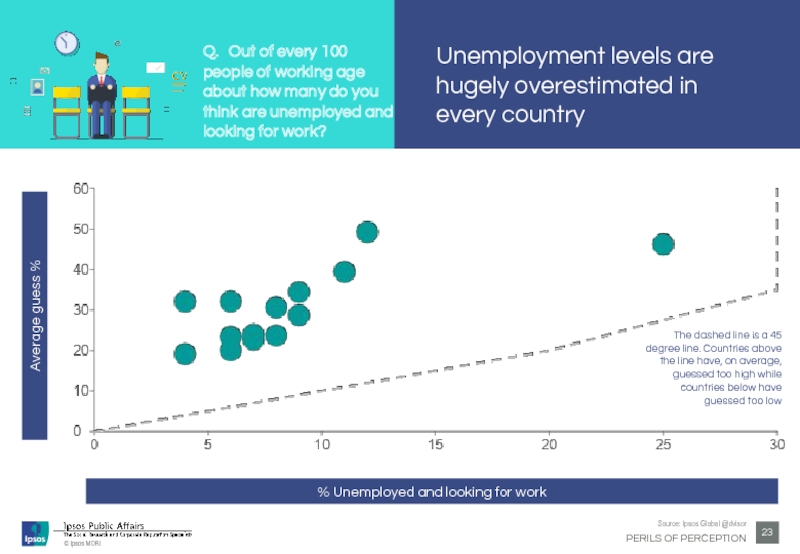
Слайд 23Average guess %
% Unemployed and looking for work
Lorem ipsum dolor sit
Q. Out of every 100 people of working age about how many do you think are unemployed and looking for work?
Unemployment levels are hugely overestimated in every country
The dashed line is a 45 degree line. Countries above the line have, on average, guessed too high while countries below have guessed too low
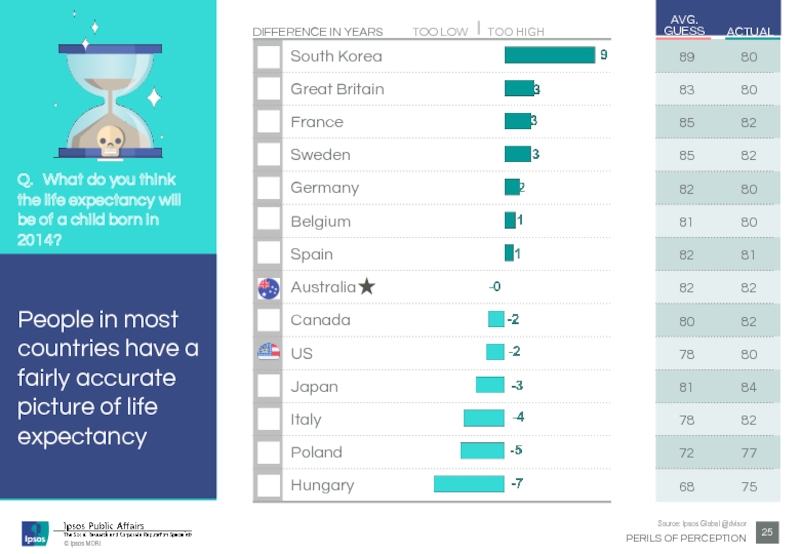
Слайд 25
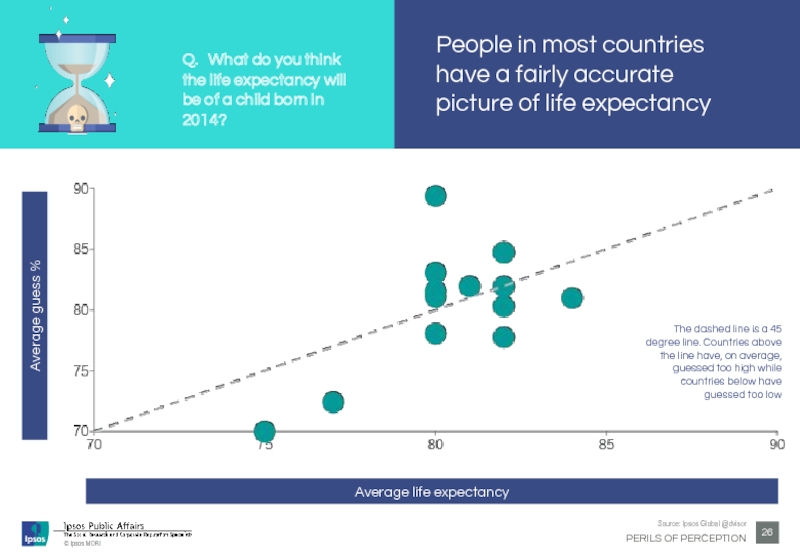
Q. What do you think the life expectancy will be
TOO LOW
TOO HIGH
DIFFERENCE IN YEARS
People in most countries have a fairly accurate picture of life expectancy
Слайд 26Average guess %
Average life expectancy
Lorem ipsum dolor sit amet, consectetur
Q. What do you think the life expectancy will be of a child born in 2014?
People in most countries have a fairly accurate picture of life expectancy
The dashed line is a 45 degree line. Countries above the line have, on average, guessed too high while countries below have guessed too low
Слайд 27
Looking across all questions, we have calculated a measure of how
This gives us our
“Index of Ignorance”
Слайд 28
1st
2nd
3rd
4th
5th
6th
7th
8th
9th
10th
11th
12th
13th
14th
7th
2nd
10th
6th
11th
8th
14th
1st
13th
4th
3rd
12th
9th
5th
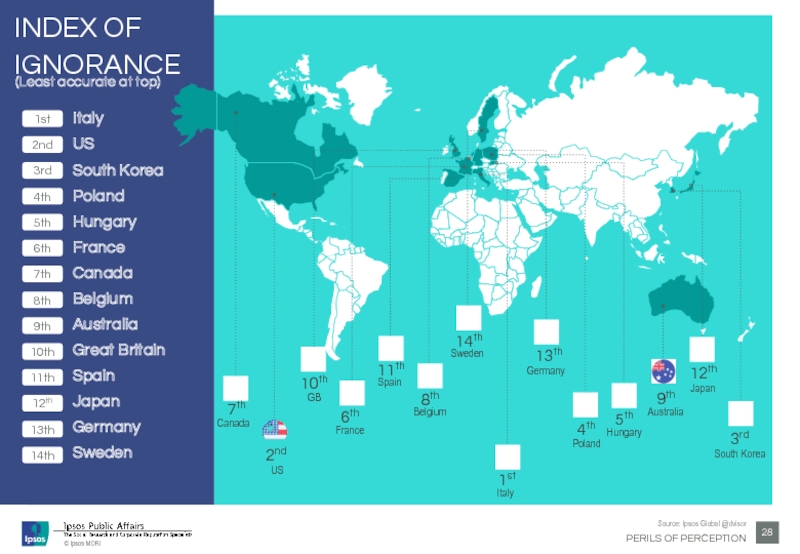
INDEX OF IGNORANCE
Sweden
Germany
Japan
Spain
GB
US
Poland
Hungary
Italy
South Korea
Belgium
France
Canada
Australia
(Least accurate at top)
Слайд 30
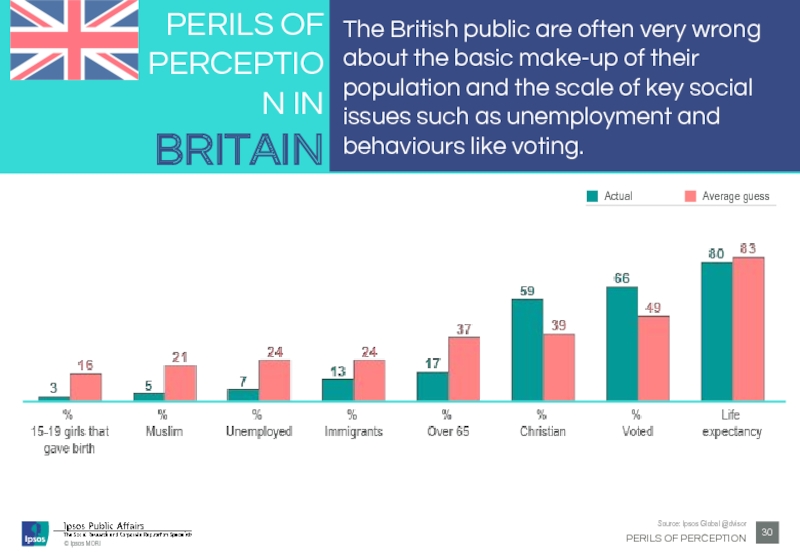
PERILS OF PERCEPTION IN
BRITAIN
The British public are often very wrong
Слайд 31
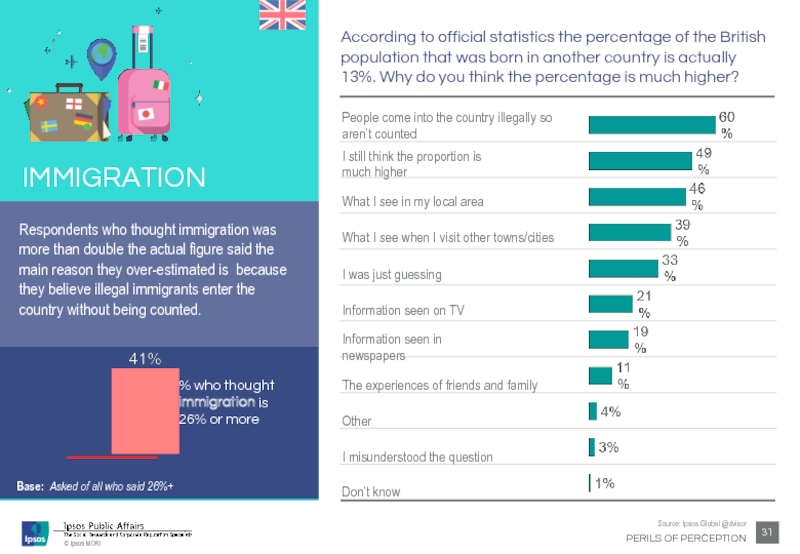
% who thought immigration is 26% or more
IMMIGRATION
According to official statistics
Base: Asked of all who said 26%+
Respondents who thought immigration was more than double the actual figure said the main reason they over-estimated is because they believe illegal immigrants enter the country without being counted.
Слайд 32
CRIME
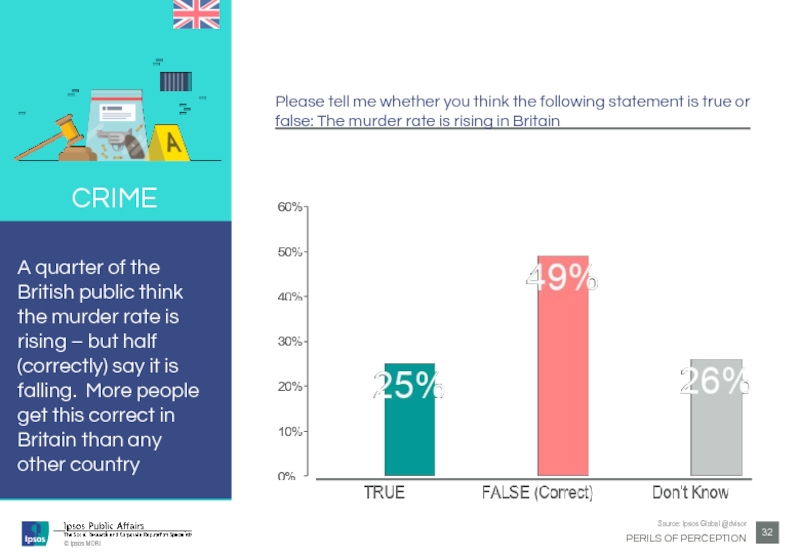
Please tell me whether you think the following statement is true
A quarter of the British public think the murder rate is rising – but half (correctly) say it is falling. More people get this correct in Britain than any other country
Слайд 33
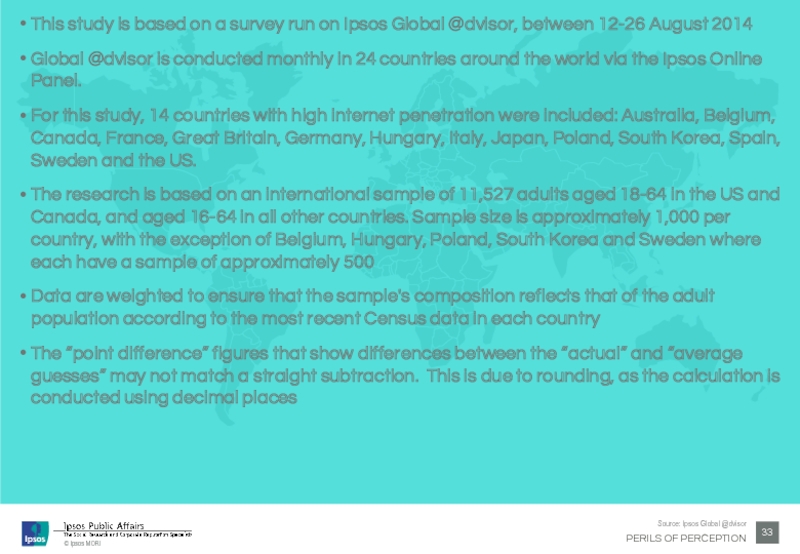
This study is based on a survey run on Ipsos Global
Global @dvisor is conducted monthly in 24 countries around the world via the Ipsos Online Panel.
For this study, 14 countries with high internet penetration were included: Australia, Belgium, Canada, France, Great Britain, Germany, Hungary, Italy, Japan, Poland, South Korea, Spain, Sweden and the US.
The research is based on an international sample of 11,527 adults aged 18-64 in the US and Canada, and aged 16-64 in all other countries. Sample size is approximately 1,000 per country, with the exception of Belgium, Hungary, Poland, South Korea and Sweden where each have a sample of approximately 500
Data are weighted to ensure that the sample's composition reflects that of the adult population according to the most recent Census data in each country
The “point difference” figures that show differences between the “actual” and “average guesses” may not match a straight subtraction. This is due to rounding, as the calculation is conducted using decimal places
Слайд 34
© Ipsos MORI
Source: Ipsos Global @dvisor
PERILS OF PERCEPTION
For more information, please
Bobby Duffy, Global Director Ipsos Social Research Institute
bobby.duffy@ipsos.com
@BobbyIpsosMORI
