- Главная
- Разное
- Дизайн
- Бизнес и предпринимательство
- Аналитика
- Образование
- Развлечения
- Красота и здоровье
- Финансы
- Государство
- Путешествия
- Спорт
- Недвижимость
- Армия
- Графика
- Культурология
- Еда и кулинария
- Лингвистика
- Английский язык
- Астрономия
- Алгебра
- Биология
- География
- Детские презентации
- Информатика
- История
- Литература
- Маркетинг
- Математика
- Медицина
- Менеджмент
- Музыка
- МХК
- Немецкий язык
- ОБЖ
- Обществознание
- Окружающий мир
- Педагогика
- Русский язык
- Технология
- Физика
- Философия
- Химия
- Шаблоны, картинки для презентаций
- Экология
- Экономика
- Юриспруденция
Визуальное моделирование и UML в Rose. (Тема 1) презентация
Содержание
- 1. Визуальное моделирование и UML в Rose. (Тема 1)
- 2. Where Are We? What is visual modeling?
- 3. What Is Visual Modeling?
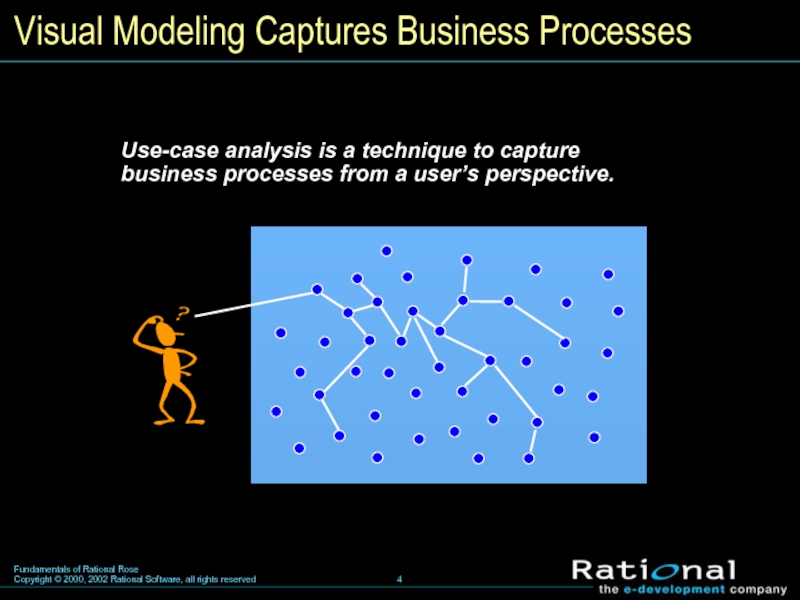
- 4. Visual Modeling Captures Business Processes Use-case analysis
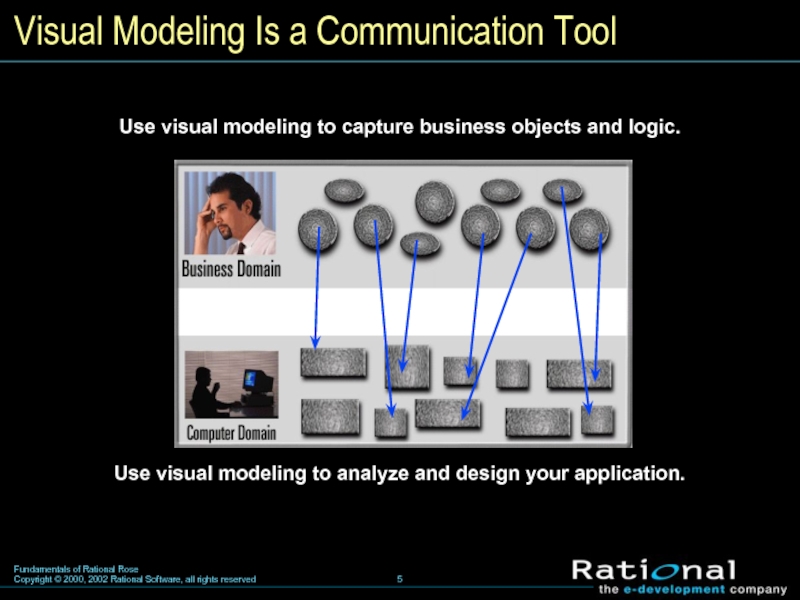
- 5. Visual Modeling Is a Communication Tool
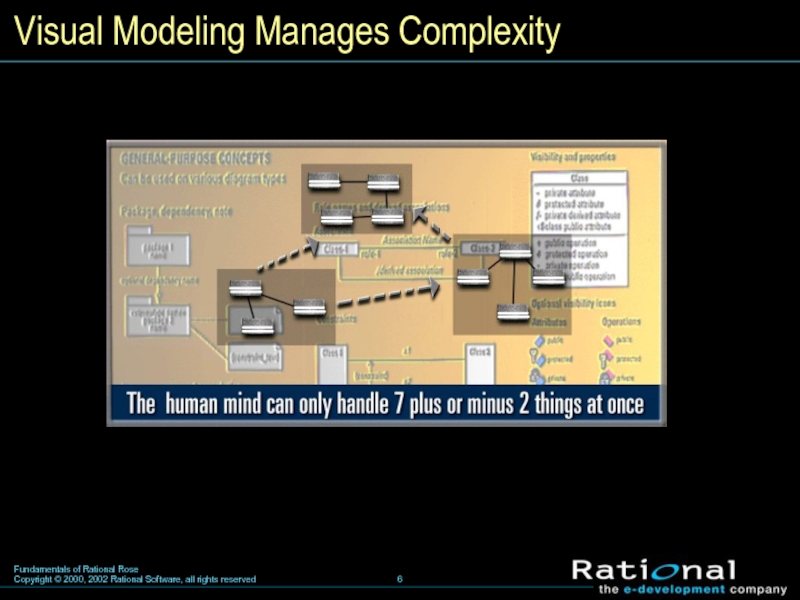
- 6. Visual Modeling Manages Complexity
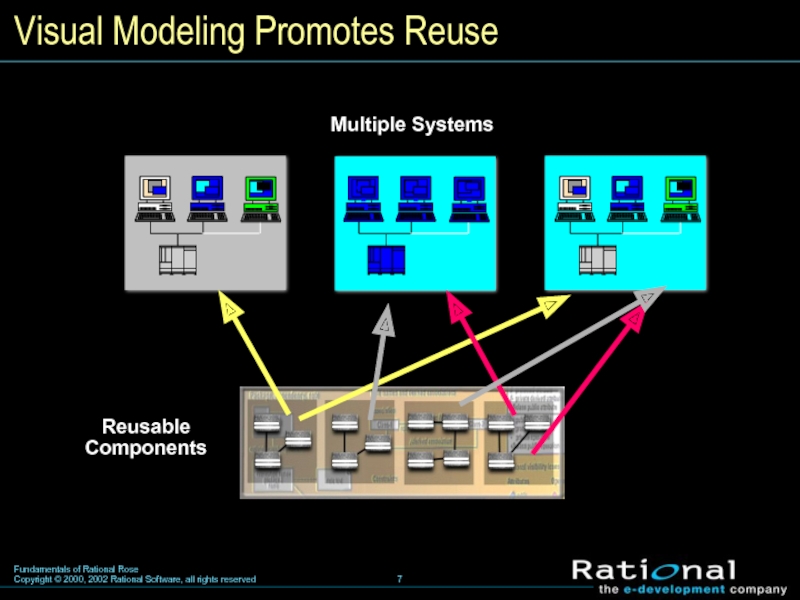
- 7. Visual Modeling Promotes Reuse
- 8. Where Are We? What is visual modeling?
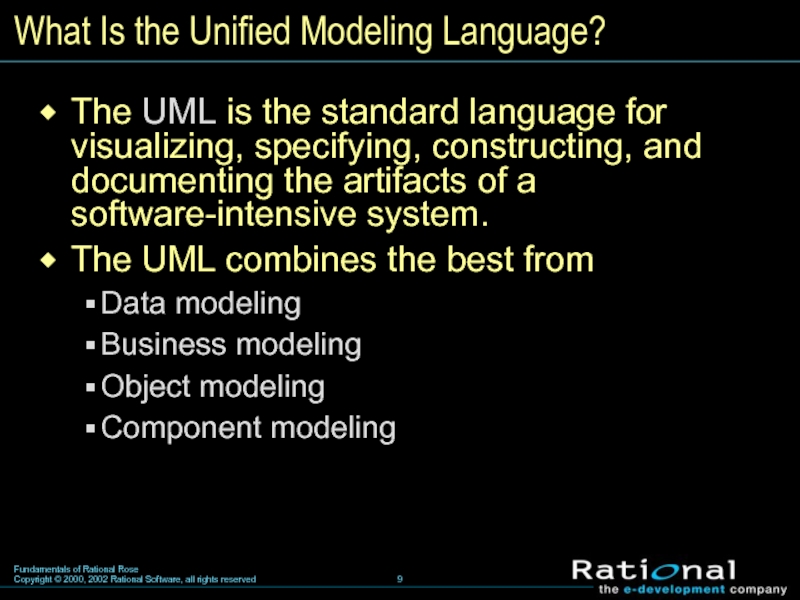
- 9. What Is the Unified Modeling Language? The
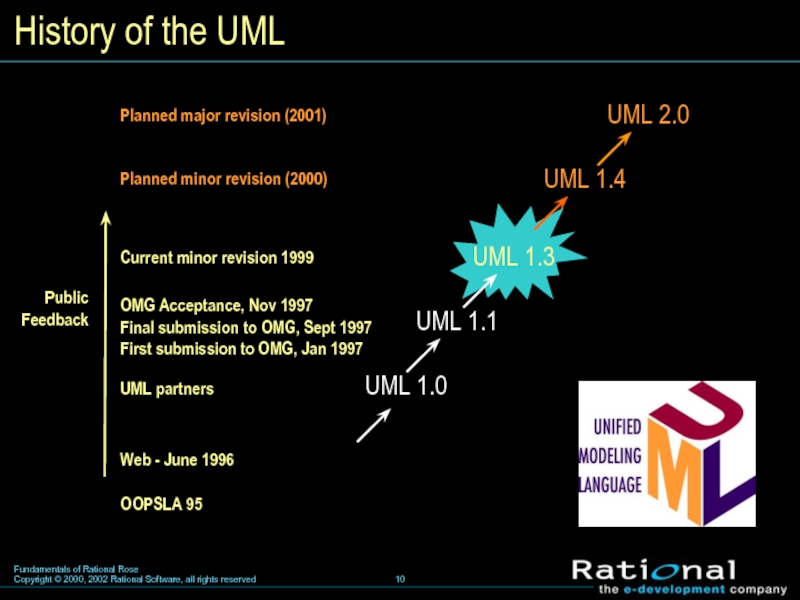
- 10. History of the UML
- 11. UML Concepts The UML may be used
- 12. Where Are We? What is visual modeling?
- 13. Use-Case Diagram A use-case diagram is created
- 14. An activity diagram shows the flow of
- 15. Sequence Diagram : Student A sequence
- 16. Collaboration Diagram A collaboration diagram displays object
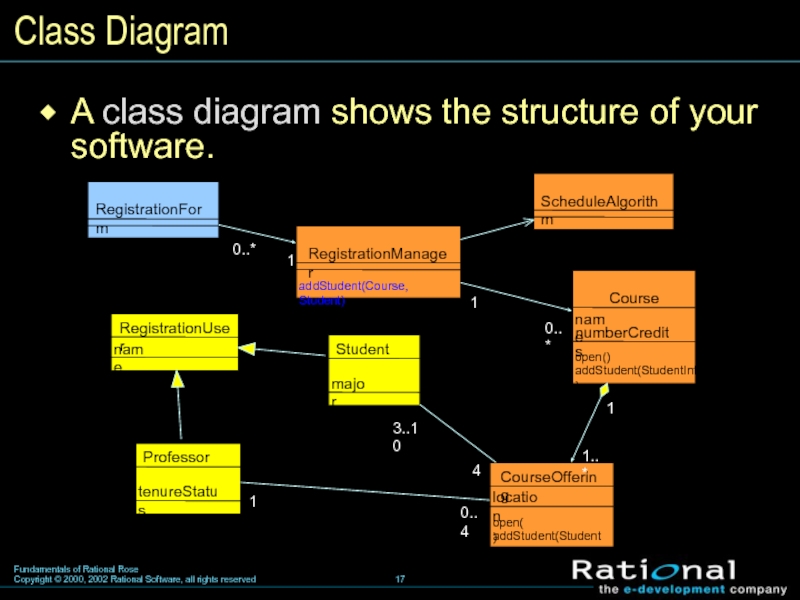
- 17. Class Diagram A class diagram shows the structure of your software.
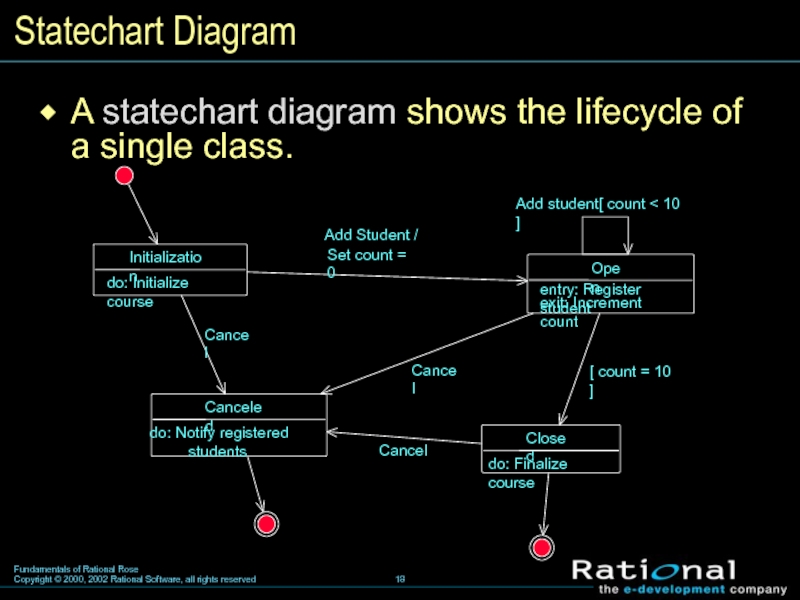
- 18. Statechart Diagram A statechart diagram shows the lifecycle of a single class.
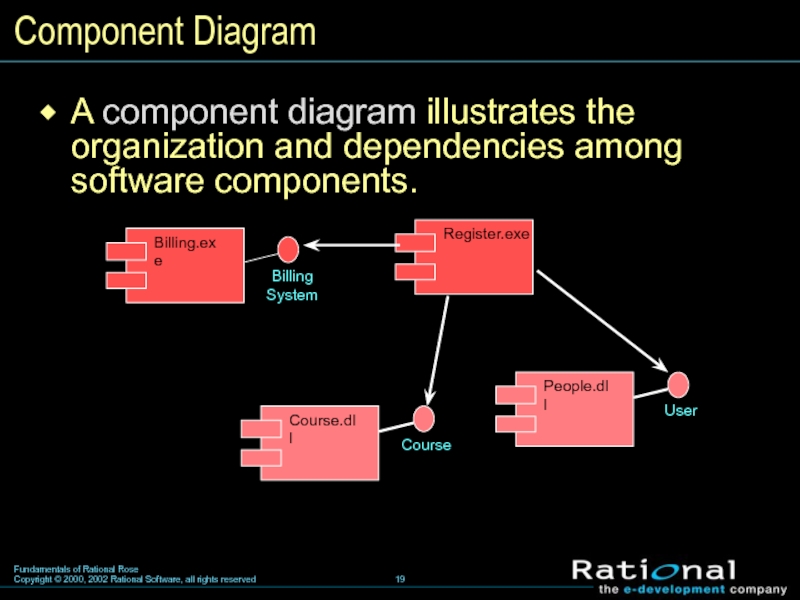
- 19. Component Diagram A component diagram illustrates the organization and dependencies among software components.
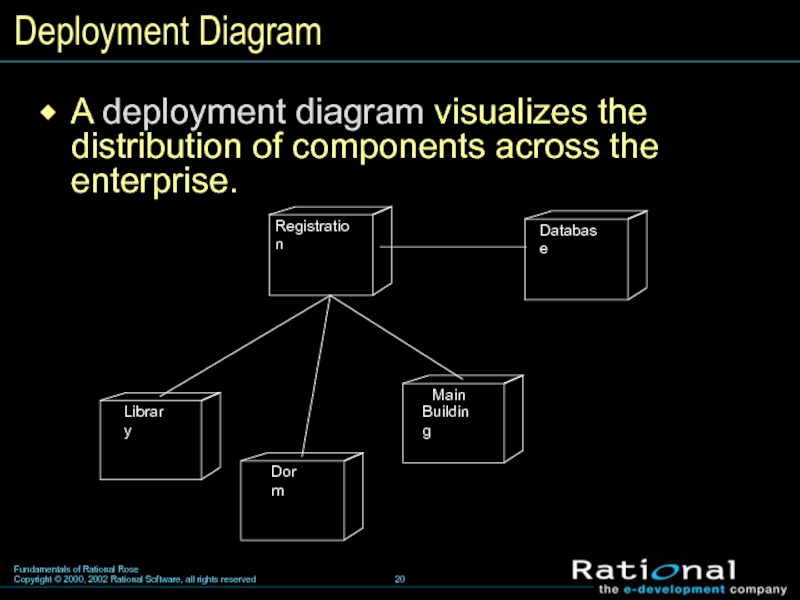
- 20. Deployment Diagram A deployment diagram visualizes the distribution of components across the enterprise.
- 21. Where Are We? What is visual modeling?
- 22. Extending the UML Stereotypes can be used
- 23. Review Name two benefits of visual modeling.
Слайд 4Visual Modeling Captures Business Processes
Use-case analysis is a technique to capture
business processes from a user’s perspective.
Слайд 9What Is the Unified Modeling Language?
The UML is the standard language
for visualizing, specifying, constructing, and documenting the artifacts of a software-intensive system.
The UML combines the best from
Data modeling
Business modeling
Object modeling
Component modeling
The UML combines the best from
Data modeling
Business modeling
Object modeling
Component modeling
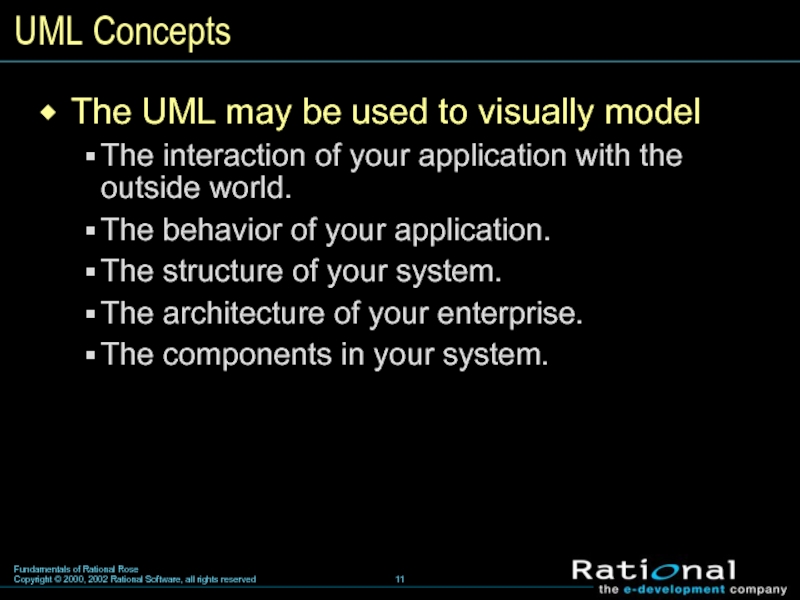
Слайд 11UML Concepts
The UML may be used to visually model
The interaction of
your application with the outside world.
The behavior of your application.
The structure of your system.
The architecture of your enterprise.
The components in your system.
The behavior of your application.
The structure of your system.
The architecture of your enterprise.
The components in your system.
Слайд 13Use-Case Diagram
A use-case diagram is created to visualize the interaction of
your system with the outside world.
Register for Courses
Request Course Roster
Maintain Course Information
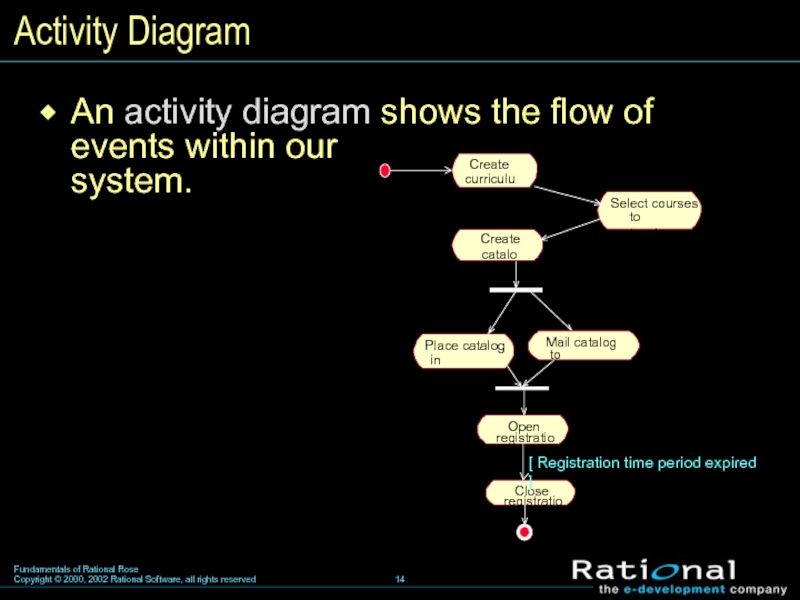
Слайд 14An activity diagram shows the flow of
events within our
system.
Activity
Diagram
Create
curriculum
[ Registration time period expired ]
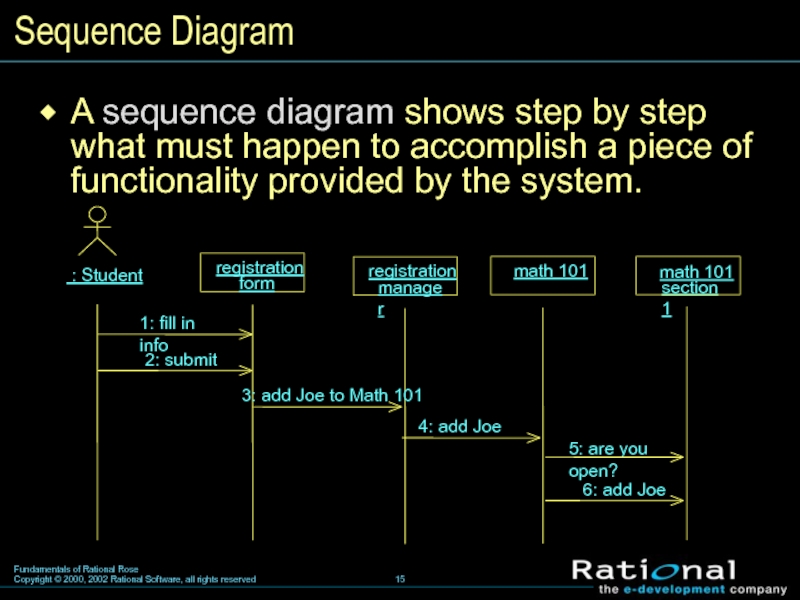
Слайд 15Sequence Diagram
: Student
A sequence diagram shows step by step what
must happen to accomplish a piece of functionality provided by the system.
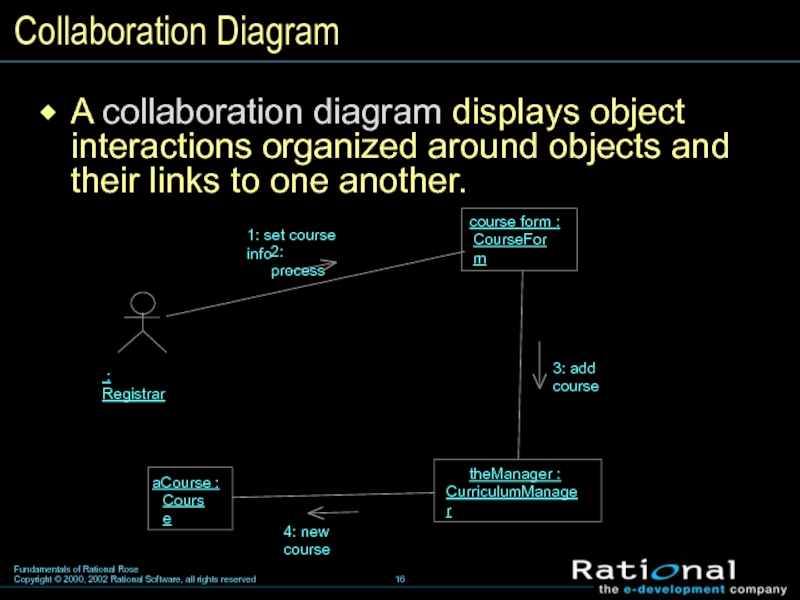
Слайд 16Collaboration Diagram
A collaboration diagram displays object interactions organized around objects and
their links to one another.
Слайд 19Component Diagram
A component diagram illustrates the organization and dependencies among software
components.
Слайд 20Deployment Diagram
A deployment diagram visualizes the distribution of components across the
enterprise.
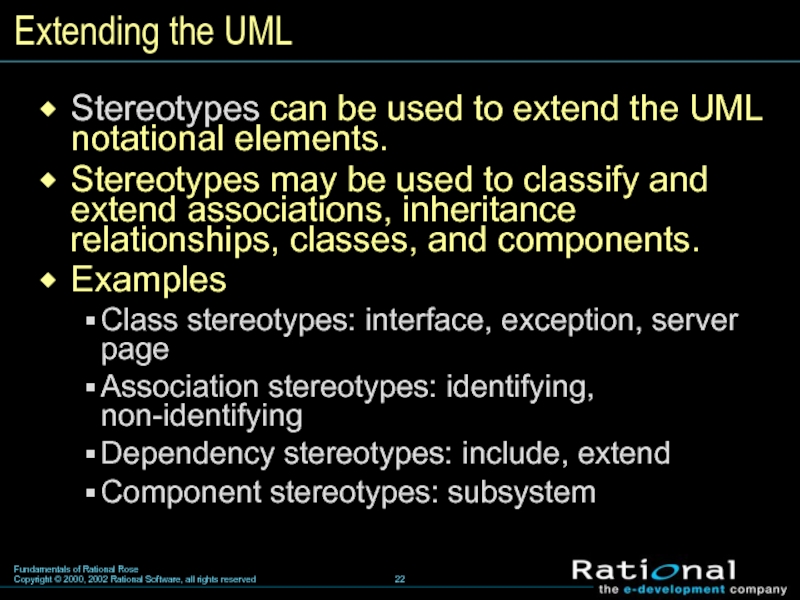
Слайд 22Extending the UML
Stereotypes can be used to extend the UML notational
elements.
Stereotypes may be used to classify and extend associations, inheritance relationships, classes, and components.
Examples
Class stereotypes: interface, exception, server page
Association stereotypes: identifying, non-identifying
Dependency stereotypes: include, extend
Component stereotypes: subsystem
Слайд 23Review
Name two benefits of visual modeling.
What is the UML?
Name three UML
diagrams.
What are stereotypes?
What are stereotypes?

