- Главная
- Разное
- Дизайн
- Бизнес и предпринимательство
- Аналитика
- Образование
- Развлечения
- Красота и здоровье
- Финансы
- Государство
- Путешествия
- Спорт
- Недвижимость
- Армия
- Графика
- Культурология
- Еда и кулинария
- Лингвистика
- Английский язык
- Астрономия
- Алгебра
- Биология
- География
- Детские презентации
- Информатика
- История
- Литература
- Маркетинг
- Математика
- Медицина
- Менеджмент
- Музыка
- МХК
- Немецкий язык
- ОБЖ
- Обществознание
- Окружающий мир
- Педагогика
- Русский язык
- Технология
- Физика
- Философия
- Химия
- Шаблоны, картинки для презентаций
- Экология
- Экономика
- Юриспруденция
Rigsite for LWD. (Lesson 11) презентация
Содержание
- 1. Rigsite for LWD. (Lesson 11)
- 2. Depth Measurement All LWD data depend on
- 3. Depth Measurement Process Computer Depth sensors data are processed and added to the T/D dataset
- 4. Types of Failure or Error Mechanical failure
- 5. Accurate Depth Monitoring Vigilance catches depth errors
- 6. Time/Depth Datasets Entries in the time/depth dataset
- 7. Time/Depth Dataset
- 8. Activating the Depth Monitor If the icon
- 9. Depth Monitor
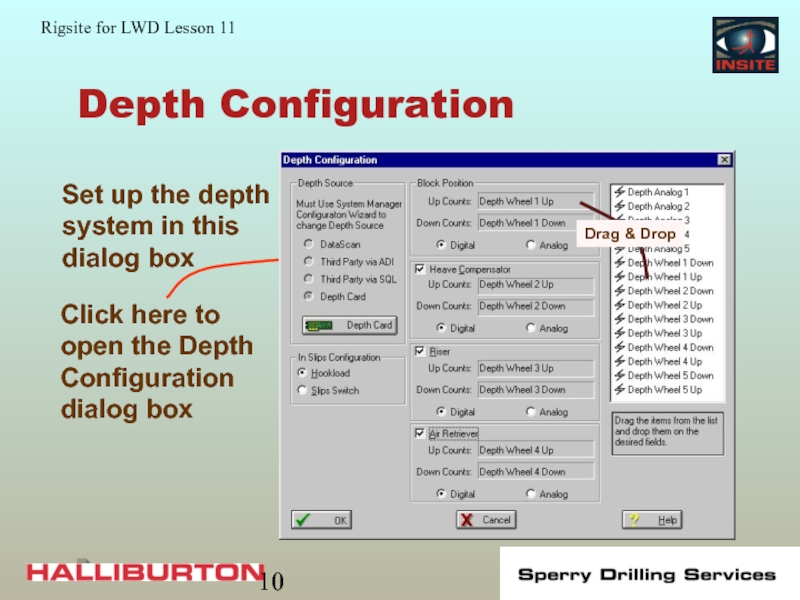
- 10. Depth Configuration
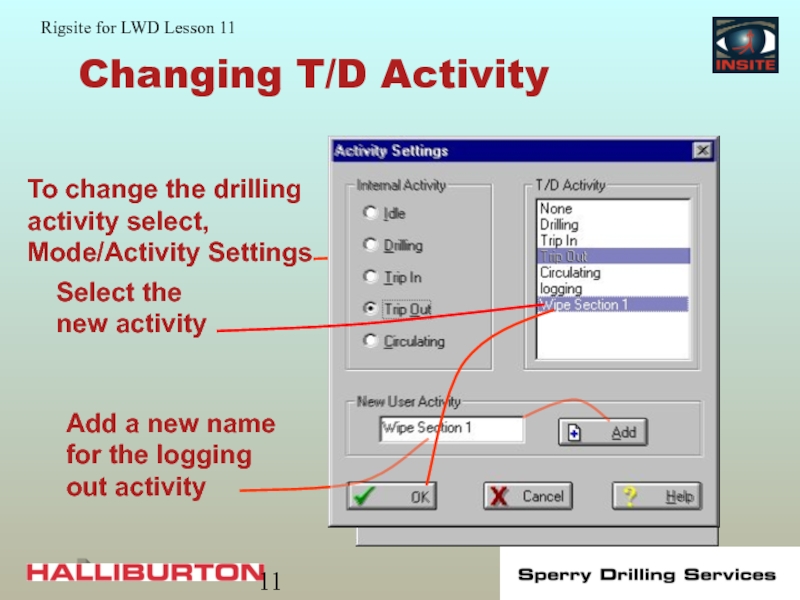
- 11. Changing T/D Activity
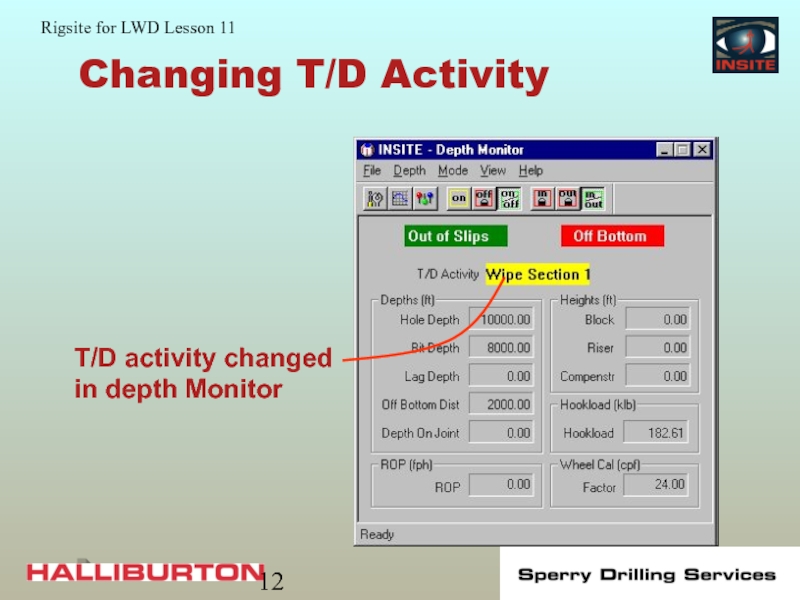
- 12. Changing T/D Activity
- 13. Logging Out of the Hole Set a
- 14. Surface Sensors Accurate calibration and reliable operation
- 15. Depth Calibration Enter the factors for installed sensors in this dialog box
- 16. Depth Calibration
- 17. Drawworks Calibration
- 18. Drawworks Calibration
- 19. Pipe Tally Sheet Copy the pipe joint
- 20. Using the Pipe Tally Sheet
- 21. Depth Control Review Importance of depth monitoring
- 22. Sources of Depth Errors Incorrect entry in
- 23. Incorrect Entry in Tally Sheet First, check
- 24. Driller Used Pipe Out of Order The
- 25. Pipe Used Out of Order Depth drilled
- 26. Inconsistent Kelly Down Drilled depth does not
- 27. Inconsistent Kelly Down
- 28. Depth Calibration Error Same error showing up
- 29. Calibration Error Measurement Error - 0.58 ft
- 30. On Bottom Early Spike in the ROP
- 31. On Bottom Early 6.11 ft hole depth error
- 32. On Bottom Late Caused by Less compression
- 33. On Bottom Late
- 34. Crown Wheel Slipping Most likely to slip
- 35. Crown Wheel Slipping Measurement Error - 0.58
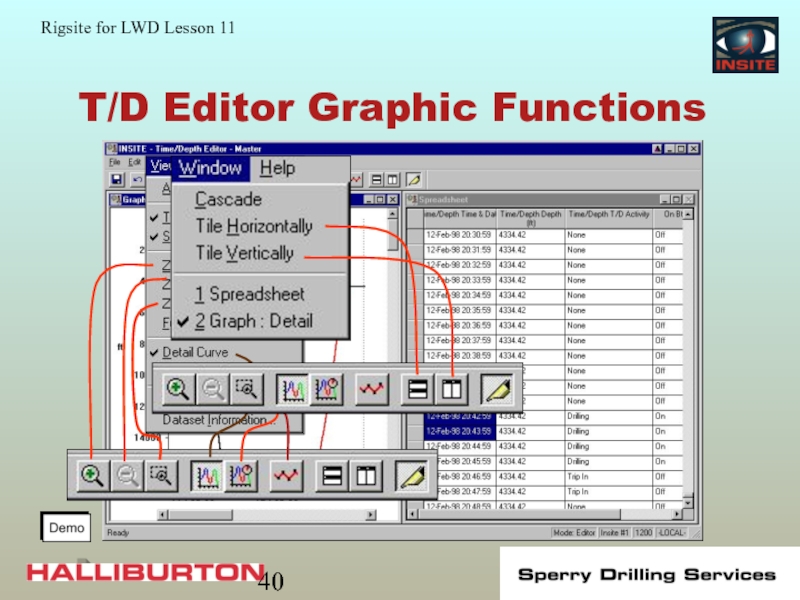
- 36. Time/Depth Editor Functions Find Expand and compress
- 37. Editing the Time/Depth Dataset Always back up
- 38. T/D Editor
- 39. T/D Editor Graphic View
- 40. T/D Editor Graphic Functions
- 41. Time/Depth Review Sources of depth error Time/Depth
- 42. Real-Time Data Display Six applications display real-time
- 43. Real-Time Displays Real-time displays are customized for
- 44. Real-Time Setup Files Applications with real-time displays
- 45. DDU Display The DDU provides the driller
- 46. Real-Time Table Real-time tables are customized for
- 47. Real-Time Table Display
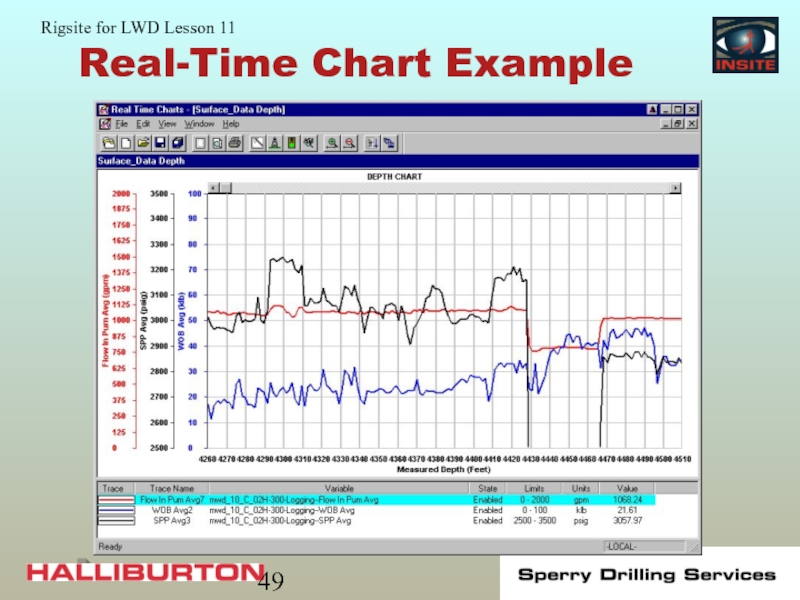
- 48. Real-Time Charts Real-time Charts: X,Y plot or
- 49. Real-Time Chart Example
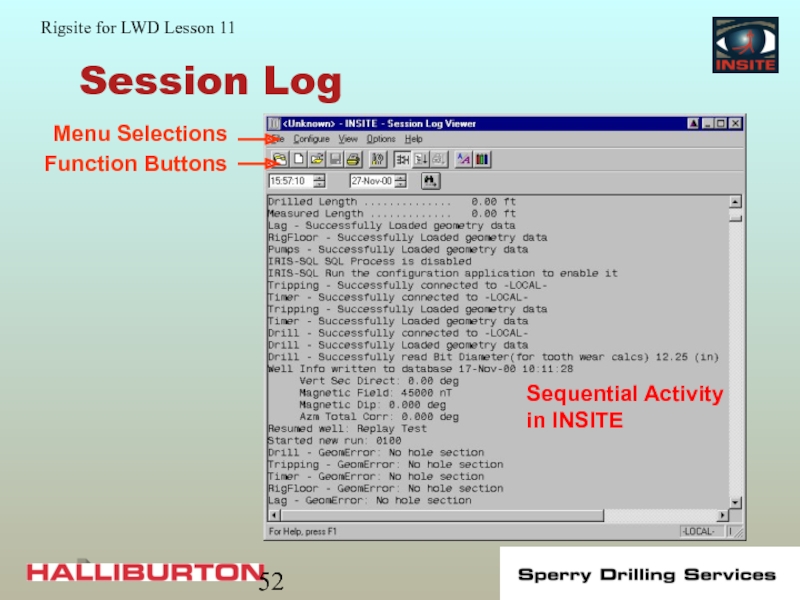
- 50. Session Log Record of all information received
- 51. Session Log continued Realtime or historical mode
- 52. Session Log Sequential Activity in INSITE
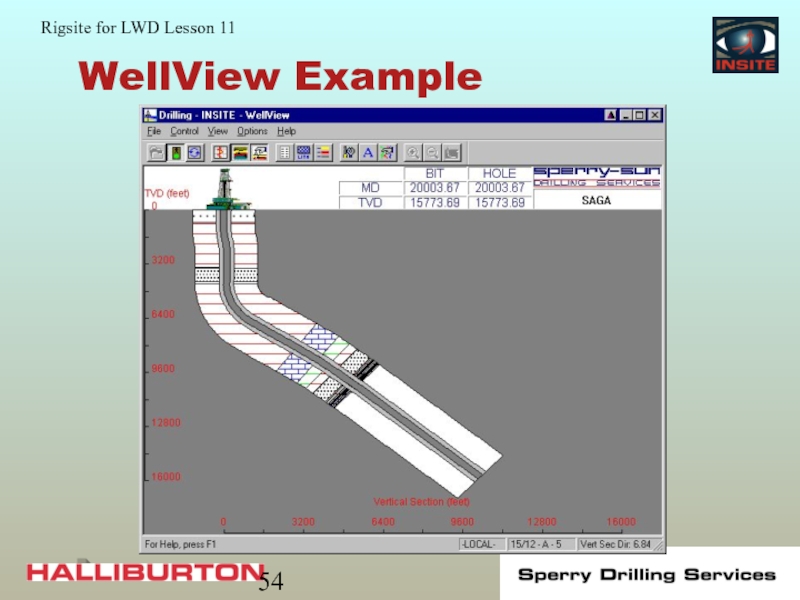
- 53. WellView WellView is a graphic presentation of
- 54. WellView Example
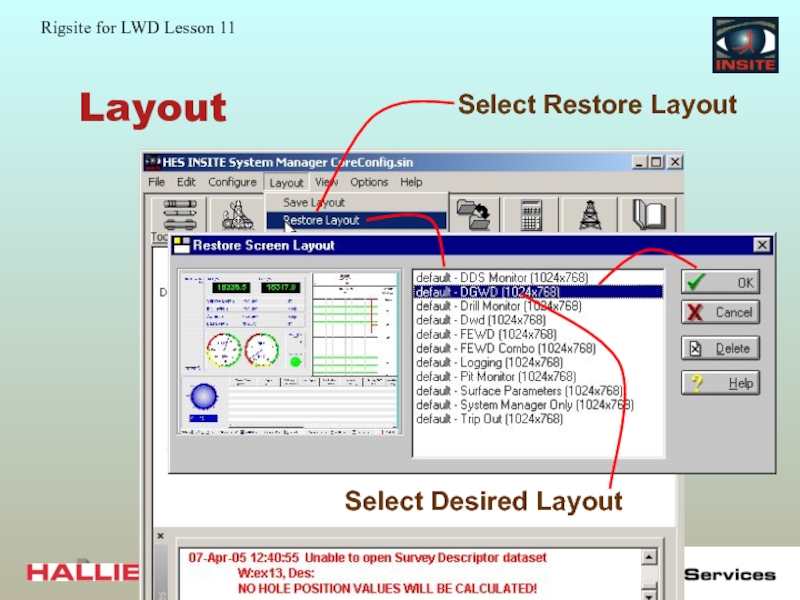
- 55. Layout Layout provides a set up of
- 56. Layout
- 57. Layout
- 58. Real-time Display Review DDU Tables Plots Session log Layout
- 59. End of Lesson 11
Слайд 2Depth Measurement
All LWD data depend on accurate depth measurements.
Accurate depth
Слайд 3Depth Measurement Process
Computer
Depth sensors data are processed and added to the
Слайд 4Types of Failure or Error
Mechanical failure
Software failure
Human Error
Three possible ways to
Слайд 5Accurate Depth Monitoring
Vigilance catches depth errors at each connection
Vigilance catches on/off
Maintaining an accurate time/depth dataset requires constant vigilance:
Vigilance produces an accurate time/depth dataset.
Слайд 6Time/Depth Datasets
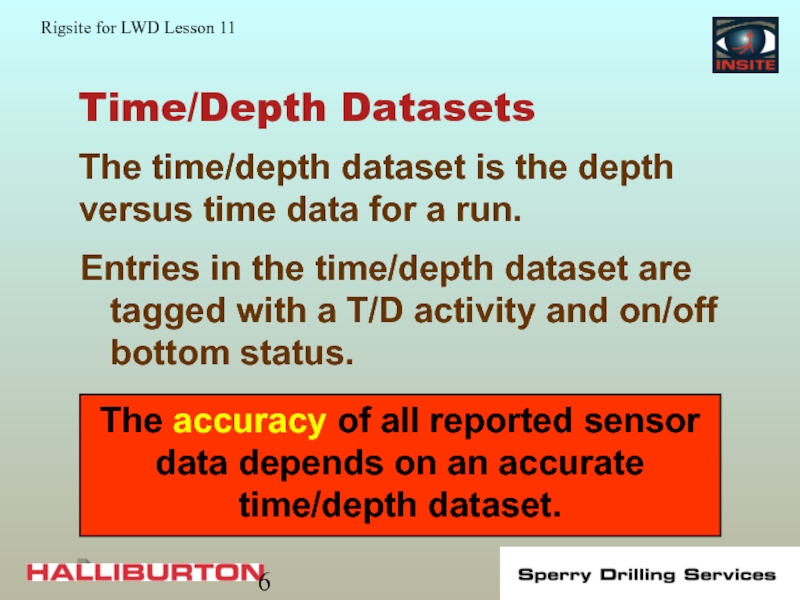
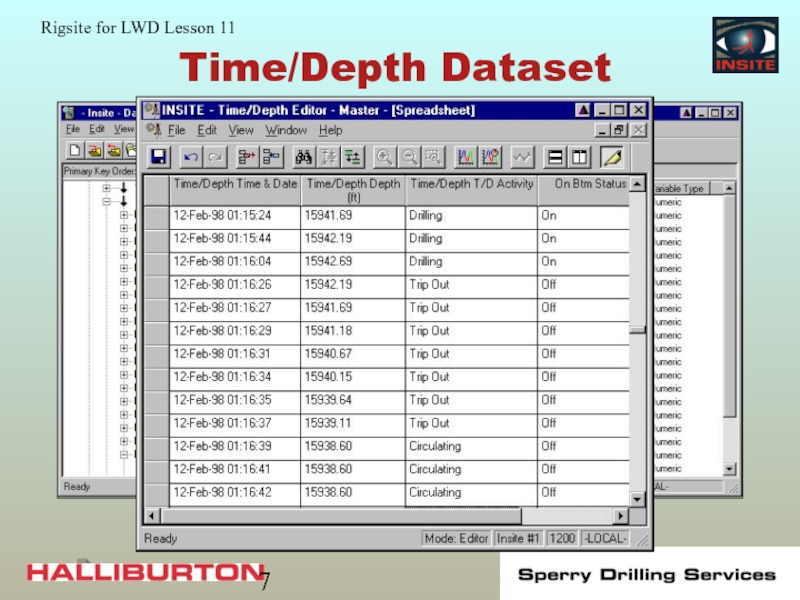
Entries in the time/depth dataset are tagged with a T/D
The time/depth dataset is the depth versus time data for a run.
The accuracy of all reported sensor data depends on an accurate time/depth dataset.
Слайд 8Activating the Depth Monitor
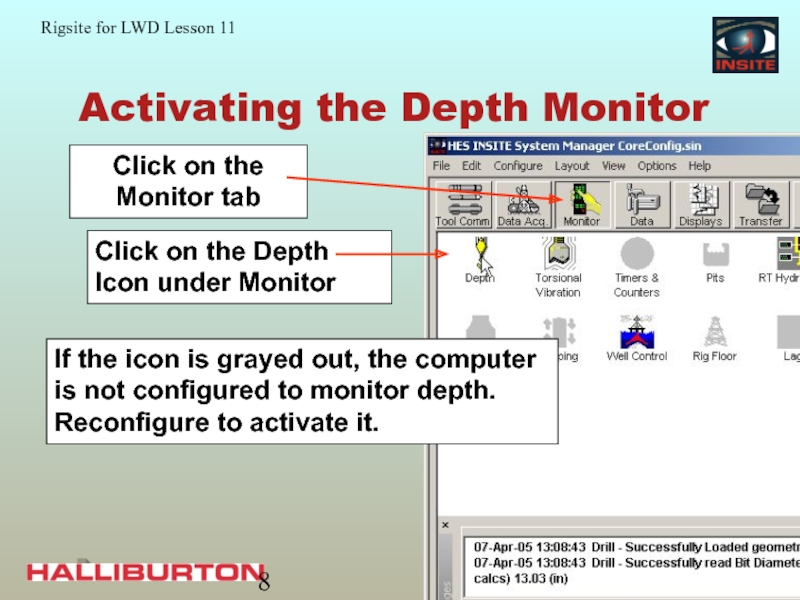
If the icon is grayed out, the computer
Слайд 13Logging Out of the Hole
Set a new T/D activity in the
Used until changed by the operator
Any named T/D activity must reflect professional standards
To identify wipe section data, it must be tagged with a unique T/D activity :
Слайд 14Surface Sensors
Accurate calibration and reliable operation of surface sensors are critical
Слайд 19Pipe Tally Sheet
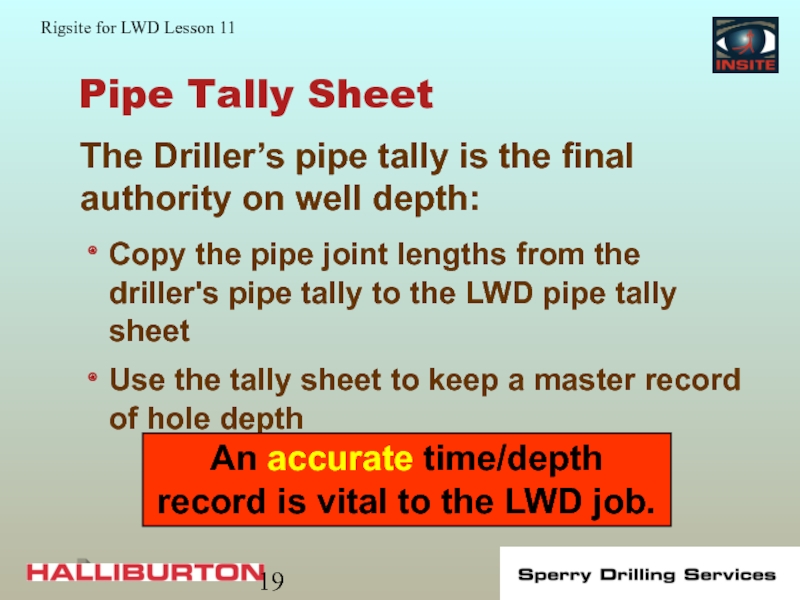
Copy the pipe joint lengths from the driller's pipe
Use the tally sheet to keep a master record of hole depth
The Driller’s pipe tally is the final authority on well depth:
An accurate time/depth record is vital to the LWD job.
Слайд 21Depth Control Review
Importance of depth monitoring
T/D dataset
Depth monitor
Depth configuration
Depth calibration
Pipe tally
Слайд 22Sources of Depth Errors
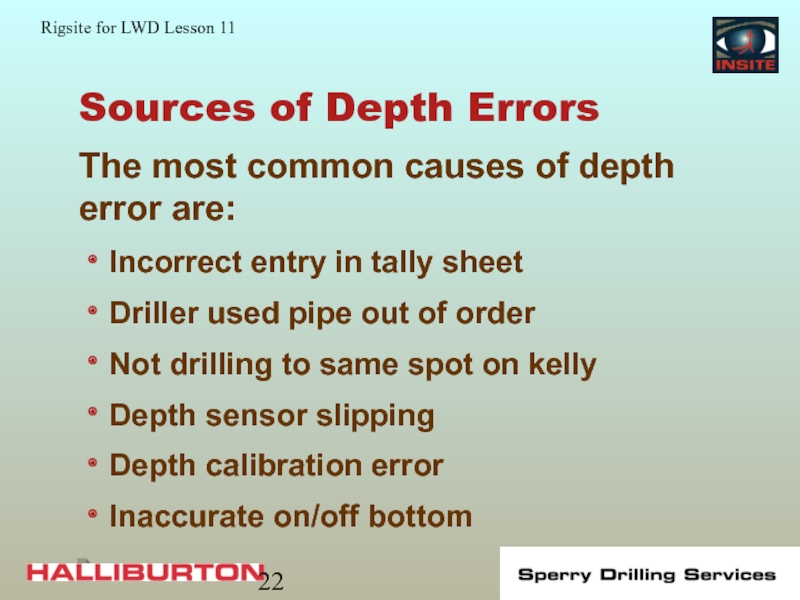
Incorrect entry in tally sheet
Driller used pipe out
Not drilling to same spot on kelly
Depth sensor slipping
Depth calibration error
Inaccurate on/off bottom
The most common causes of depth error are:
Слайд 23Incorrect Entry in Tally Sheet
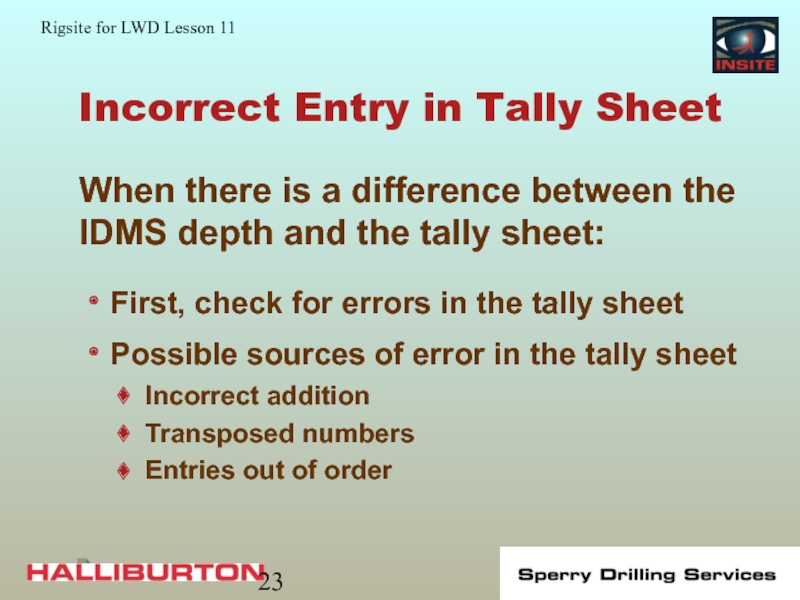
First, check for errors in the tally
Possible sources of error in the tally sheet
Incorrect addition
Transposed numbers
Entries out of order
When there is a difference between the IDMS depth and the tally sheet:
Слайд 24Driller Used Pipe Out of Order
The depth differences will even out
Size of the depth difference depends on difference in length between connections
Get the order used (if known) and make the changes in the tally sheet
When the driller picked up pipe in an order different from the tally book:
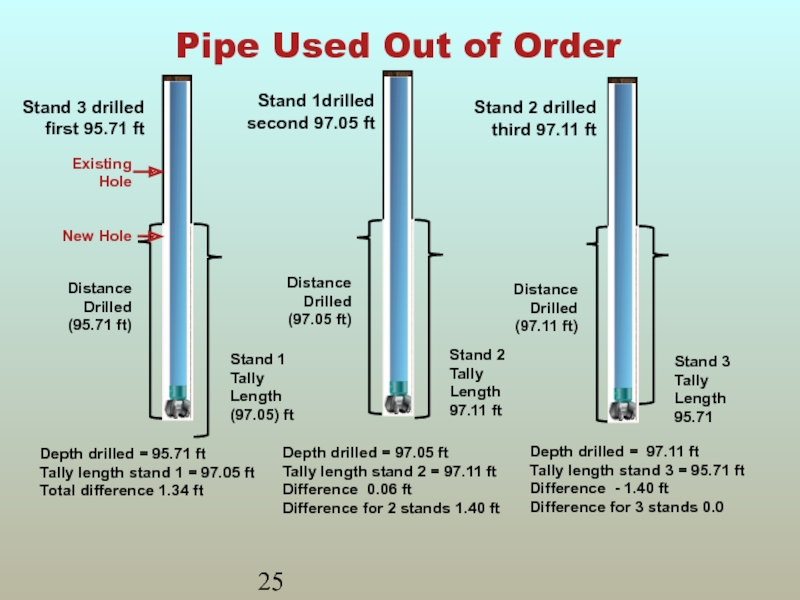
Слайд 25Pipe Used Out of Order
Depth drilled = 95.71 ft
Tally length stand
Total difference 1.34 ft
Depth drilled = 97.05 ft
Tally length stand 2 = 97.11 ft
Difference 0.06 ft
Difference for 2 stands 1.40 ft
Depth drilled = 97.11 ft
Tally length stand 3 = 95.71 ft
Difference - 1.40 ft
Difference for 3 stands 0.0
Слайд 26Inconsistent Kelly Down
Drilled depth does not equal the length of the
IDMS depth does not match the tally book
Depth differences vary from stand to stand
Depth differences even out as drilling continues
If the driller does not drill to the same spot on the kelly each time:
Слайд 28Depth Calibration Error
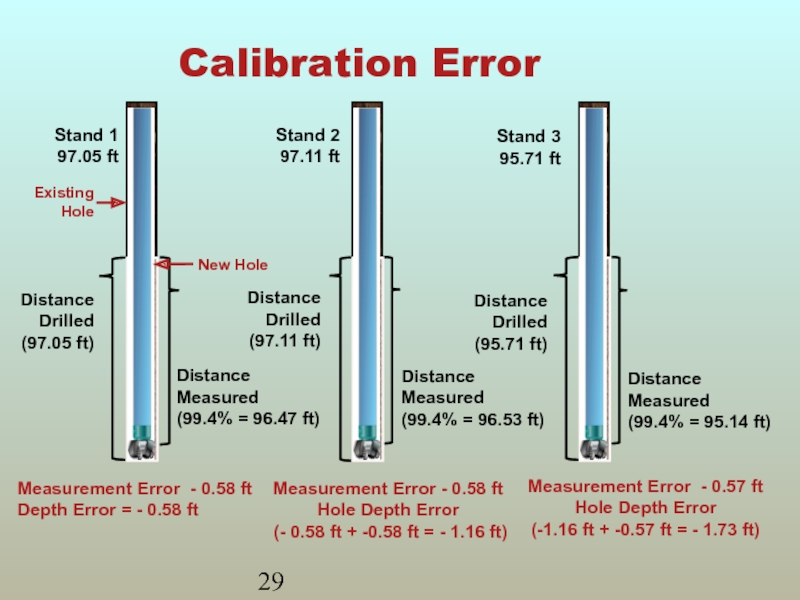
Same error showing up on each stand is a
A small error may require several stands to become apparent
Correction for this error is to recalibrate the sensor
Calibration errors show up as a consistent gain or loss of depth:
Слайд 29Calibration Error
Measurement Error - 0.58 ft
Depth Error = - 0.58 ft
Measurement
(- 0.58 ft + -0.58 ft = - 1.16 ft)
Measurement Error - 0.57 ft
Hole Depth Error
(-1.16 ft + -0.57 ft = - 1.73 ft)
Слайд 30On Bottom Early
Spike in the ROP at beginning of a stand
Positive
IDMS on bottom before bit is actually on bottom causes:
Слайд 32On Bottom Late
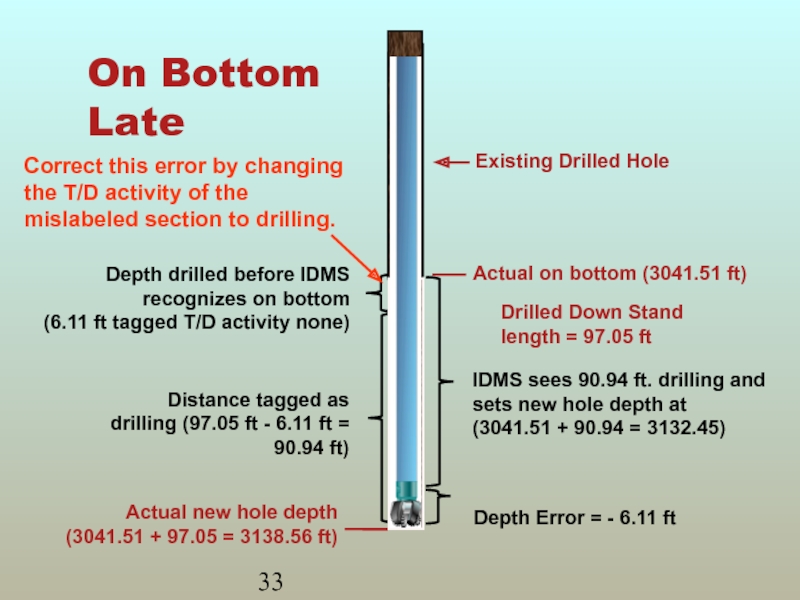
Caused by
Less compression on pipe (less WOB)
Error in
Gap in the data when plotted unless corrected
IDMS depth not on bottom when bit is drilling:
Слайд 34Crown Wheel Slipping
Most likely to slip during fast movement of the
Hot weather can contribute to slipping
Wet conditions can contribute to slipping
Can cause inaccurate INSITE on bottom tracking
Crown wheel slipping causes erratic differences between tally and INSITE bit depth:
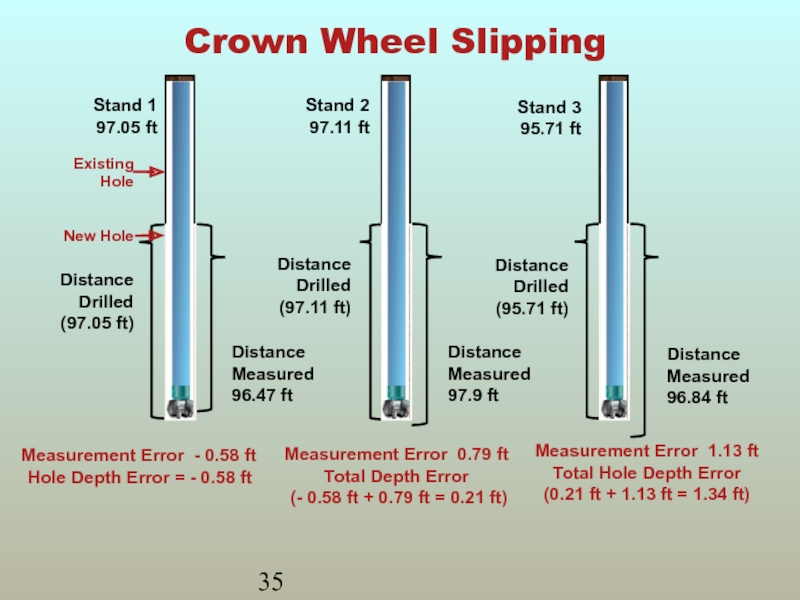
Слайд 35Crown Wheel Slipping
Measurement Error - 0.58 ft
Hole Depth Error = -
Measurement Error 0.79 ft Total Depth Error
(- 0.58 ft + 0.79 ft = 0.21 ft)
Measurement Error 1.13 ft
Total Hole Depth Error
(0.21 ft + 1.13 ft = 1.34 ft)
Слайд 36Time/Depth Editor Functions
Find
Expand and compress
Shift
Insert and append
Delete
Edit single records
Functions of the
Слайд 37Editing the Time/Depth Dataset
Always back up the Time/Depth dataset before editing.
After
Caution
Do not change the Time/Depth dataset until all other possible remedies have been tried.
Слайд 41Time/Depth Review
Sources of depth error
Time/Depth editor layout
Editing functions and when to
Graphic display
Слайд 42Real-Time Data Display
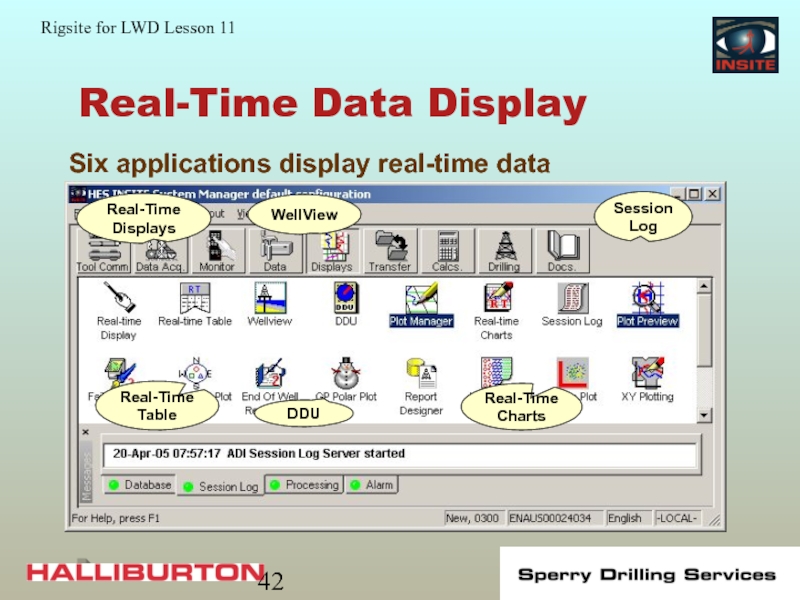
Six applications display real-time data
Real-Time Displays
WellView
Session Log
Real-Time Table
DDU
Real-Time Charts
Слайд 43Real-Time Displays
Real-time displays are customized for specific tools or situations:
Built up
Give a familiar form to the data
Display any type of data
Changes display at set limits
Saved as .rtf files in the INSITE/Data/ RTDisplay folder
Слайд 44Real-Time Setup Files
Applications with real-time displays (except DDU and WellView) can
Saved in the INSITE/Data /application folder
Opened from System Manager/Displays application set
Default and saved templates for each application can be copied to other computers
Слайд 45DDU Display
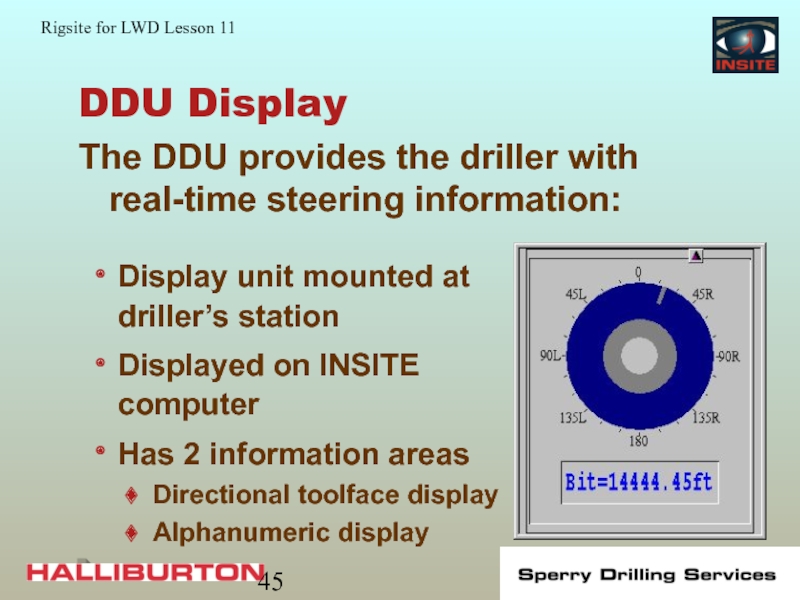
The DDU provides the driller with real-time steering information:
Display
Displayed on INSITE computer
Has 2 information areas
Directional toolface display
Alphanumeric display
Слайд 46Real-Time Table
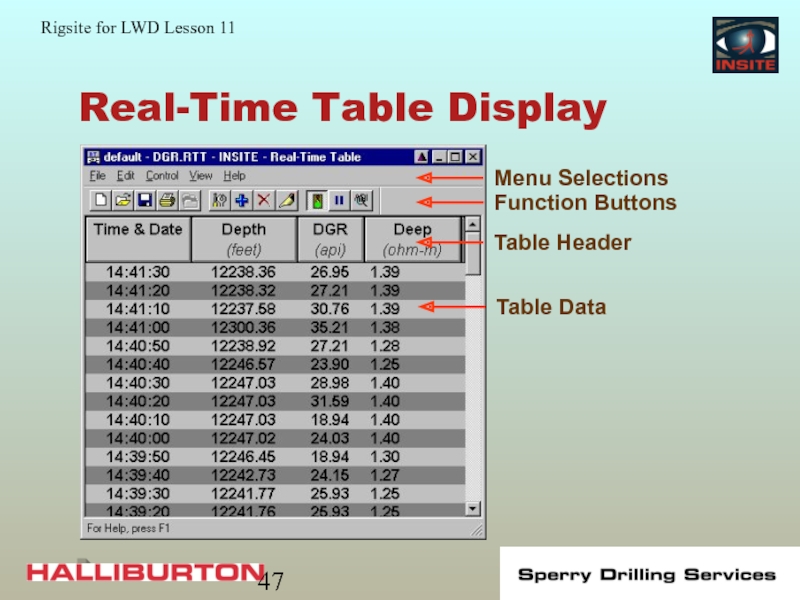
Real-time tables are customized for specific tools or situations:
Easier to
Highlight data outside limits
Display any variable in the datasets
Saved as .rtt files in the INSITE/Data/ RTTable folder
No historical data
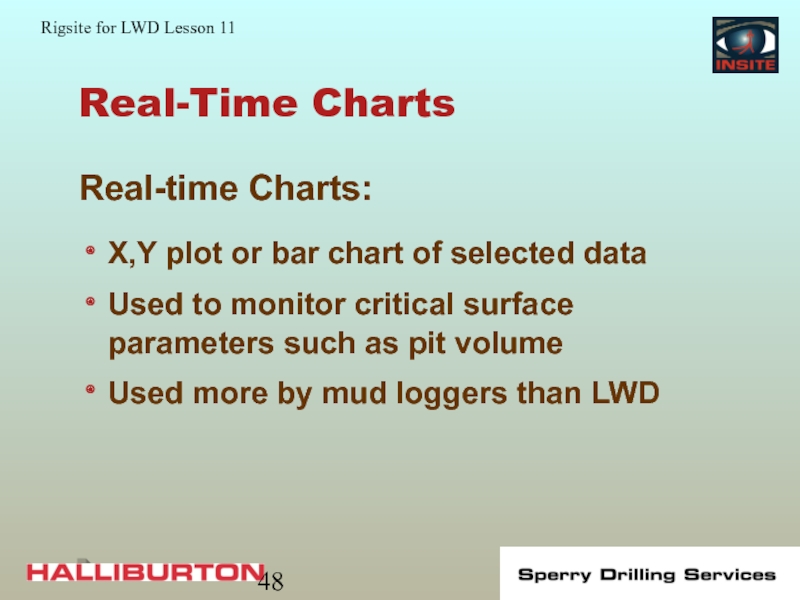
Слайд 48Real-Time Charts
Real-time Charts:
X,Y plot or bar chart of selected data
Used
Used more by mud loggers than LWD
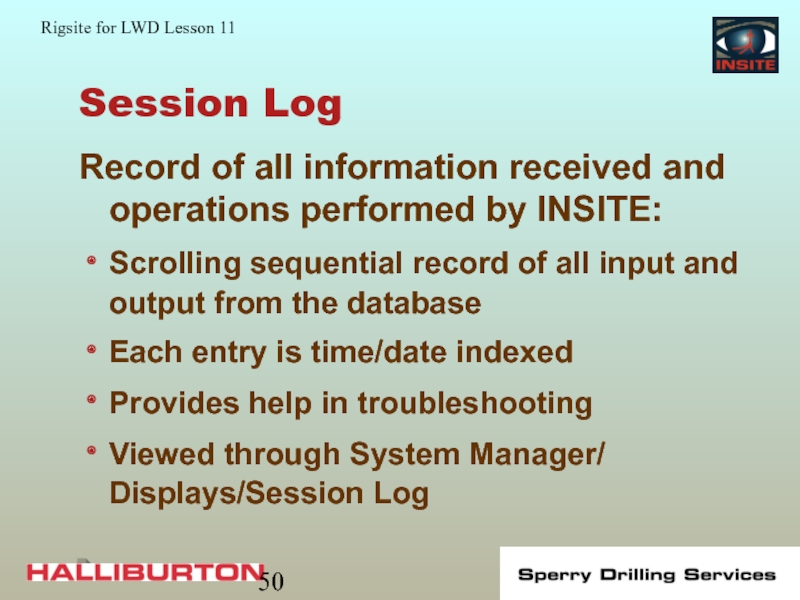
Слайд 50Session Log
Record of all information received and operations performed by INSITE:
Scrolling
Each entry is time/date indexed
Provides help in troubleshooting
Viewed through System Manager/ Displays/Session Log
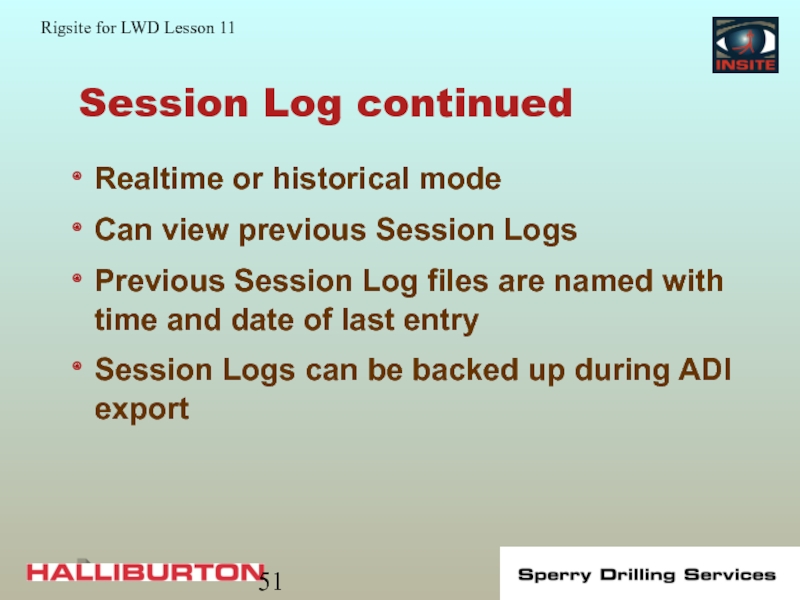
Слайд 51Session Log continued
Realtime or historical mode
Can view previous Session Logs
Previous Session
Session Logs can be backed up during ADI export
Слайд 53WellView
WellView is a graphic presentation of the drilling track:
Provides a visual
Memory intensive
Generally not run by LWD engineer
Run on customer workstations
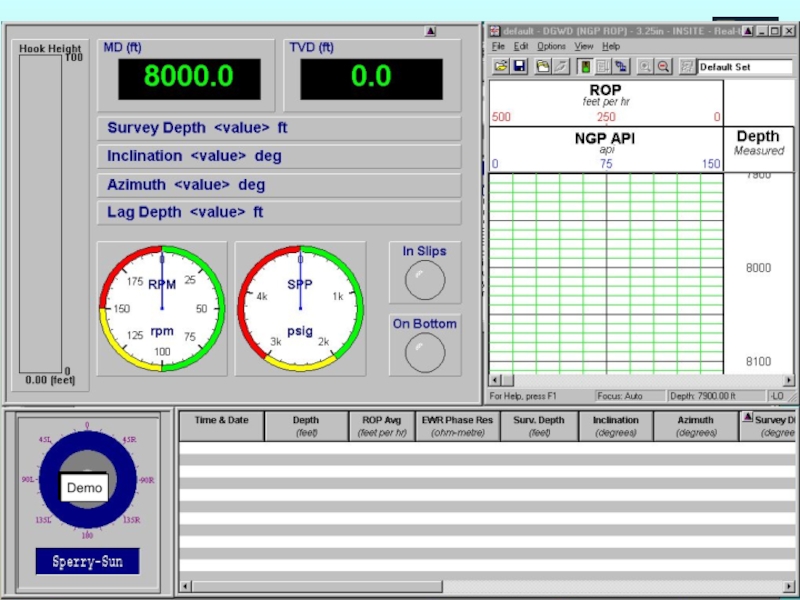
Слайд 55Layout
Layout provides a set up of real-time displays:
Contains templates for different
Templates can be modified for specific job situations
Saves custom layouts
Changes layout when drilling activity changes with sequencer
