December 4, 2017
- Главная
- Разное
- Дизайн
- Бизнес и предпринимательство
- Аналитика
- Образование
- Развлечения
- Красота и здоровье
- Финансы
- Государство
- Путешествия
- Спорт
- Недвижимость
- Армия
- Графика
- Культурология
- Еда и кулинария
- Лингвистика
- Английский язык
- Астрономия
- Алгебра
- Биология
- География
- Детские презентации
- Информатика
- История
- Литература
- Маркетинг
- Математика
- Медицина
- Менеджмент
- Музыка
- МХК
- Немецкий язык
- ОБЖ
- Обществознание
- Окружающий мир
- Педагогика
- Русский язык
- Технология
- Физика
- Философия
- Химия
- Шаблоны, картинки для презентаций
- Экология
- Экономика
- Юриспруденция
Introduction to server side performance testing презентация
Содержание
- 1. Introduction to server side performance testing
- 2. AGENDA
- 3. EPAM POG facts Group started in 1999
- 4. SOFTWARE QUALITY Quality is a property which
- 5. THE PURPOSE OF PERFORMANCE OPTIMIZATION As per
- 6. WHY PERFORMANCE? No Performance Poor Performance
- 7. STEPS TO ASSURE GOOD PERFORMANCE The ultimate
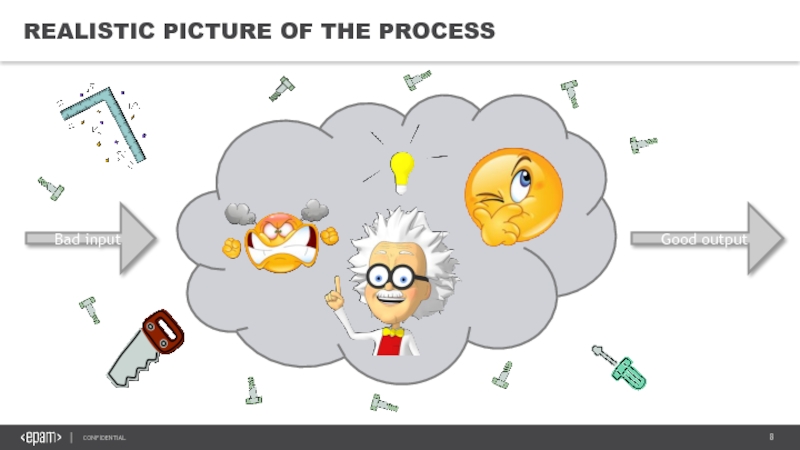
- 8. REALISTIC PICTURE OF THE PROCESS Bad input Good output
- 9. WHO IS PERFORMANCE ENGINEER? Tester To
- 10. WHEN TO START Classic Approach: When code
- 11. WHERE TO FIND ROOTS OF PROBLEMS?
- 12. WHAT IS WEB-SYSTEM FOR PERFORMANCE ANALYST?
- 14. SOME DEFINITIONS Performance Performance of a
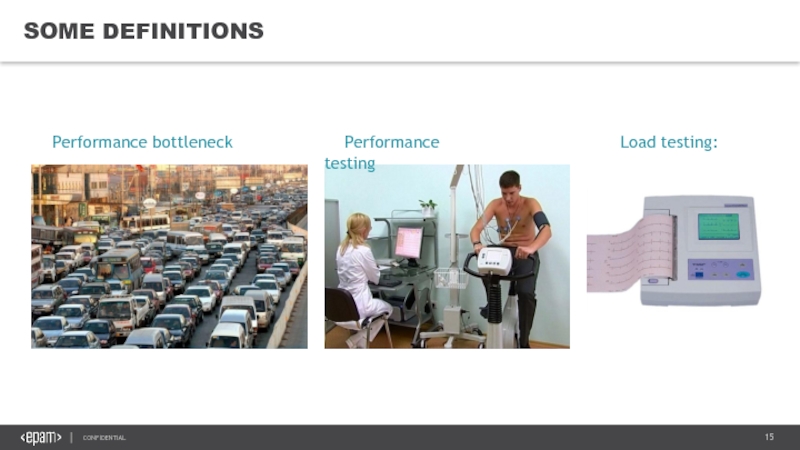
- 15. SOME DEFINITIONS Performance bottleneck Performance testing Load testing:
- 16. TYPES OF PERFORMANCE TESTS As said
- 17. Also TESTS to mention In fact, there
- 18. SUMMARY: TYPES OF PERFORMANCE TESTS Server-Side
- 19. MECHANICS OF CAPACITY Assume there is
- 20. RAMP-UP TEST AGAINST IDEAL SYSTEM The
- 21. RAMP-UP TEST AGAINST REAL GOOD SYSTEM
- 22. RAMP-UP TEST AGAINST REAL BAD SYSTEM
- 23. RAMP-UP TEST AGAINST REALLY BAD SYSTEM
- 24. TESTS WITH FIXED LEVEL OF LOAD
- 25. LONGEVITY TEST Example: graph from a
- 26. WHY TO MONITOR Issues and unexpected
- 27. BASIC PERFORMANCE COUNTERS TO MONITOR The
- 28. WHAT TO REPORT The rule is
- 29. HOW TO REPORT Choose the right
- 30. TOOLS WinDbg MS SQL Server
- 31. MATERIALS TO EXPLORE Useful book that
- 32. THANK YOU Marharyta Halamuzdava Marharyta_Halamuzdava@epam.com Victoria Blinova Victoria_Blinova@epam.com Aliaksandr Kavaliou Aliaksandr_Kavaliou@epam.com
Слайд 1Introduction to
server side performance testing
~30 slides to make the World
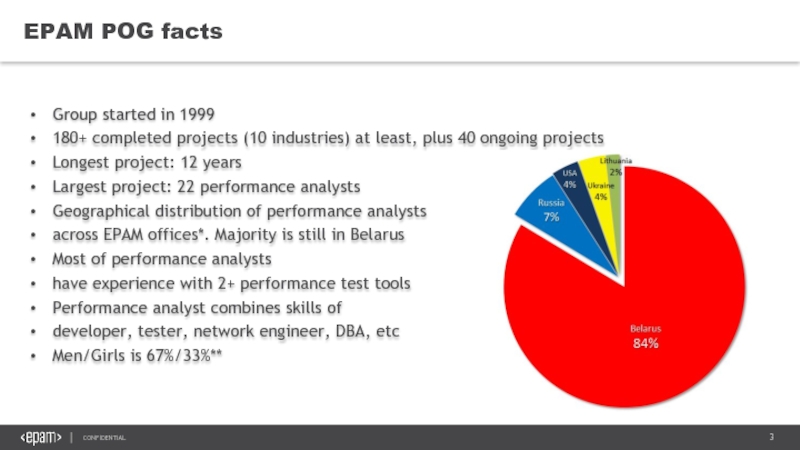
Слайд 3EPAM POG facts
Group started in 1999
180+ completed projects (10 industries) at
Longest project: 12 years
Largest project: 22 performance analysts
Geographical distribution of performance analysts
across EPAM offices*. Majority is still in Belarus
Most of performance analysts
have experience with 2+ performance test tools
Performance analyst combines skills of
developer, tester, network engineer, DBA, etc
Men/Girls is 67%/33%**
Слайд 4SOFTWARE QUALITY
Quality is a property which shows if product meets its
Anything wrong?
One small correction makes difference:
Quality is a property which shows if product meets its requirements (expectations) or not.
Performance - The degree to which a system or component accomplishes its designated functions within given constraints* (IEEE).
Слайд 5THE PURPOSE OF PERFORMANCE OPTIMIZATION
As per ISO 9126, software product quality
Functionality
Usability
Reliability
Efficiency
Maintainability
Portability
Functional testing process
Performance optimization process
Our descendants will do that… hopefully
Слайд 6WHY PERFORMANCE?
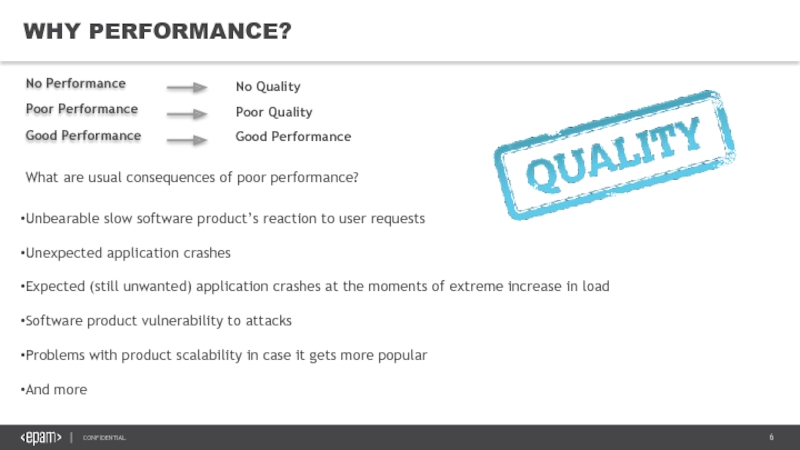
No Performance
Poor Performance
Good Performance
No Quality
Poor Quality
Good Performance
What are usual consequences of poor performance?
Unbearable slow software product’s reaction to user requests
Unexpected application crashes
Expected (still unwanted) application crashes at the moments of extreme increase in load
Software product vulnerability to attacks
Problems with product scalability in case it gets more popular
And more
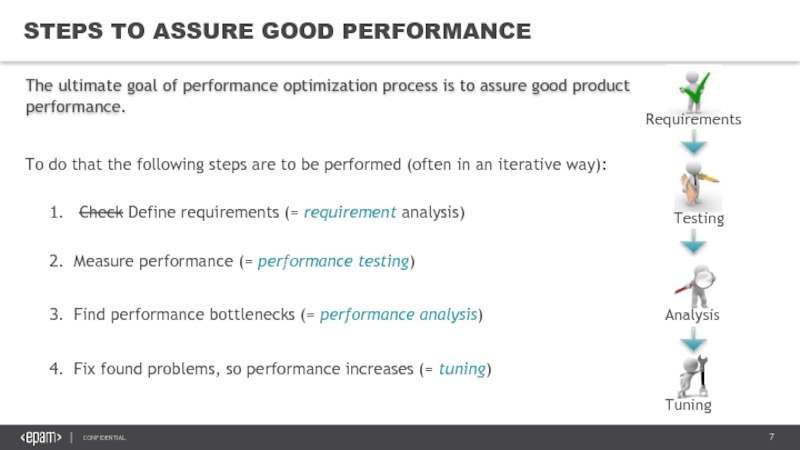
Слайд 7STEPS TO ASSURE GOOD PERFORMANCE
The ultimate goal of performance optimization process
To do that the following steps are to be performed (often in an iterative way):
Check Define requirements (= requirement analysis)
Measure performance (= performance testing)
Find performance bottlenecks (= performance analysis)
Fix found problems, so performance increases (= tuning)
Requirements
Testing
Analysis
Tuning
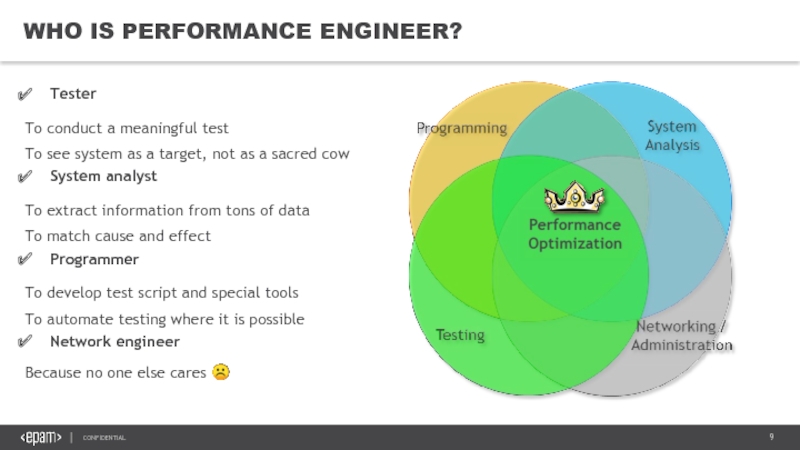
Слайд 9WHO IS PERFORMANCE ENGINEER?
Tester
To conduct a meaningful test
To see system as
System analyst
To extract information from tons of data
To match cause and effect
Programmer
To develop test script and special tools
To automate testing where it is possible
Network engineer
Because no one else cares ☹
Слайд 10WHEN TO START
Classic Approach:
When code is ready and functionally working.
But it’s
Better options:
Start test at same time as functional team (at least) – meaning you need to develop scripts and prepare everything even earlier
Start after functional test, but allocate time for performance fixes and functional re-test
Remember!
You’re likely to spend most of time on test results analysis. It is not scripting and test running what makes it all difficult and long lasting, it is rather searching for the performance bottlenecks.
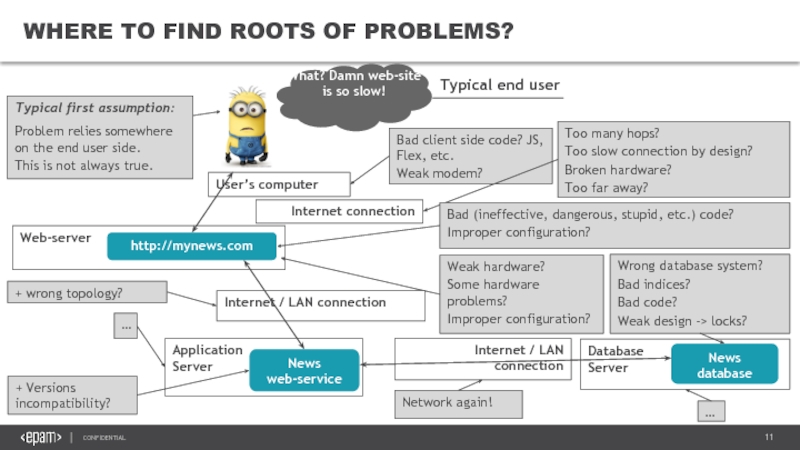
Слайд 11WHERE TO FIND ROOTS OF PROBLEMS?
WHERE TO FIND ROOTS OF PROBLEMS?
Typical
http://mynews.com
Typical first assumption:
Problem relies somewhere on the end user side.
This is not always true.
User’s computer
Bad client side code? JS, Flex, etc.
Weak modem?
Internet connection
Too many hops?
Too slow connection by design?
Broken hardware?
Too far away?
Web-server
Weak hardware?
Some hardware problems?
Improper configuration?
News
web-service
Internet / LAN connection
+ wrong topology?
Application
Server
News
database
…
Bad (ineffective, dangerous, stupid, etc.) code?
Improper configuration?
+ Versions incompatibility?
Wrong database system?
Bad indices?
Bad code?
Weak design -> locks?
Database
Server
…
Internet / LAN connection
Network again!
What? Damn web-site is so slow!
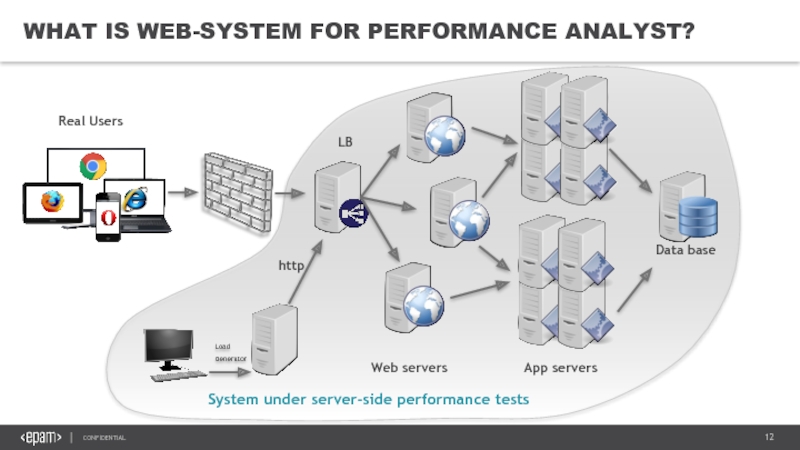
Слайд 12
WHAT IS WEB-SYSTEM FOR PERFORMANCE ANALYST?
Load
Generator
Web servers
http
App servers
Data base
LB
Real Users
System
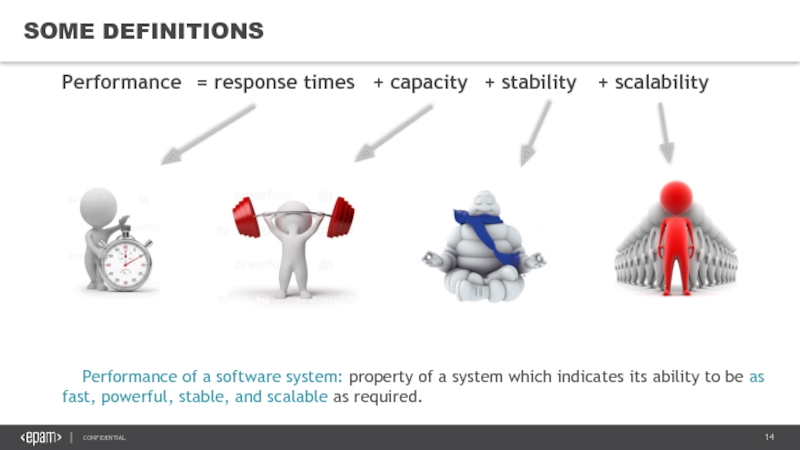
Слайд 14SOME DEFINITIONS
Performance
Performance of a software system: property of a system which
= response times
+ capacity
+ stability
+ scalability
Слайд 16TYPES OF PERFORMANCE TESTS
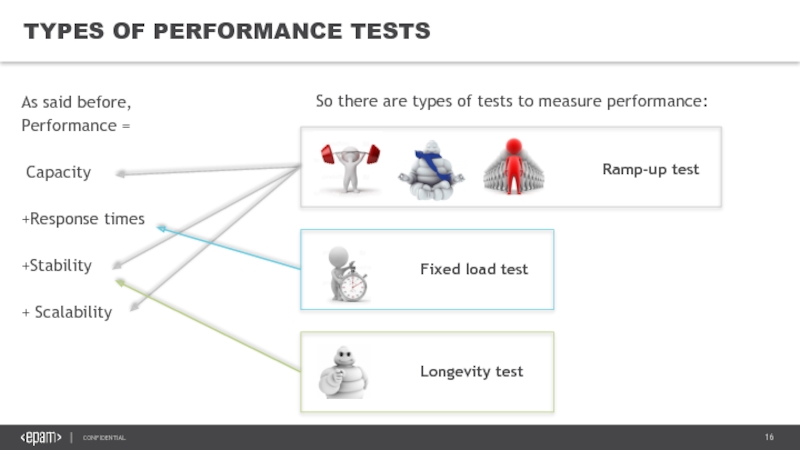
As said before,
Performance =
Capacity
+Response times
+Stability
+ Scalability
So there are types of tests to measure performance:
Ramp-up test
Fixed load test
Longevity test
Слайд 17Also TESTS to mention
In fact, there are some more tests to
Rush-hour
Rendezvous
Render time
Production drip
… And even more to invent!
Ask me how to join performance optimization group to know the details ☺
Слайд 18SUMMARY: TYPES OF PERFORMANCE TESTS
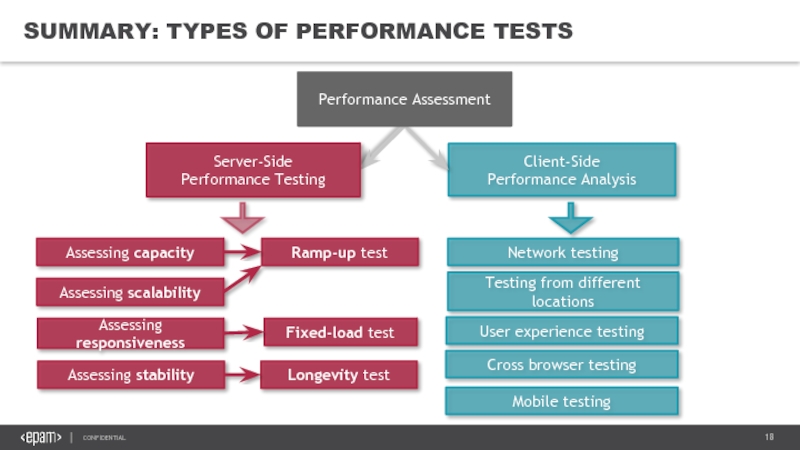
Server-Side
Performance Testing
Client-Side
Performance Analysis
Performance Assessment
Assessing capacity
Ramp-up test
Assessing responsiveness
Assessing
Fixed-load test
Assessing stability
Longevity test
Network testing
Testing from different locations
User experience testing
Cross browser testing
Mobile testing
Слайд 19MECHANICS OF CAPACITY
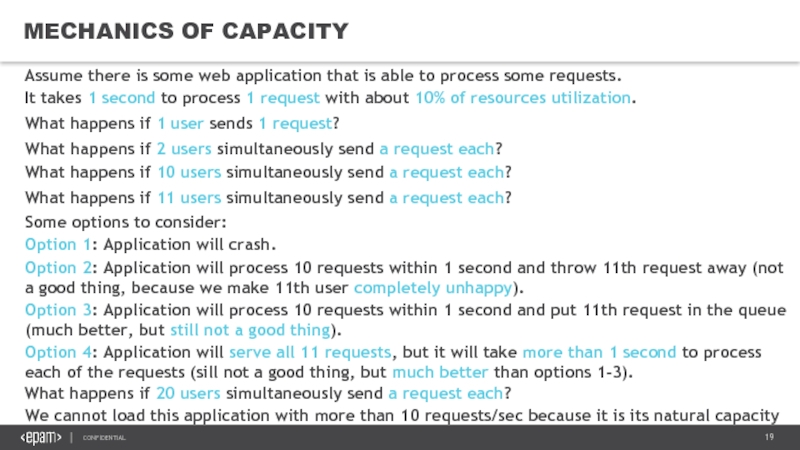
Assume there is some web application that is able
It takes 1 second to process 1 request with about 10% of resources utilization.
What happens if 1 user sends 1 request?
What happens if 2 users simultaneously send a request each?
What happens if 10 users simultaneously send a request each?
What happens if 11 users simultaneously send a request each?
Some options to consider:
Option 1: Application will crash.
Option 2: Application will process 10 requests within 1 second and throw 11th request away (not a good thing, because we make 11th user completely unhappy).
Option 3: Application will process 10 requests within 1 second and put 11th request in the queue (much better, but still not a good thing).
Option 4: Application will serve all 11 requests, but it will take more than 1 second to process each of the requests (sill not a good thing, but much better than options 1-3).
What happens if 20 users simultaneously send a request each?
We cannot load this application with more than 10 requests/sec because it is its natural capacity
Слайд 20RAMP-UP TEST AGAINST IDEAL SYSTEM
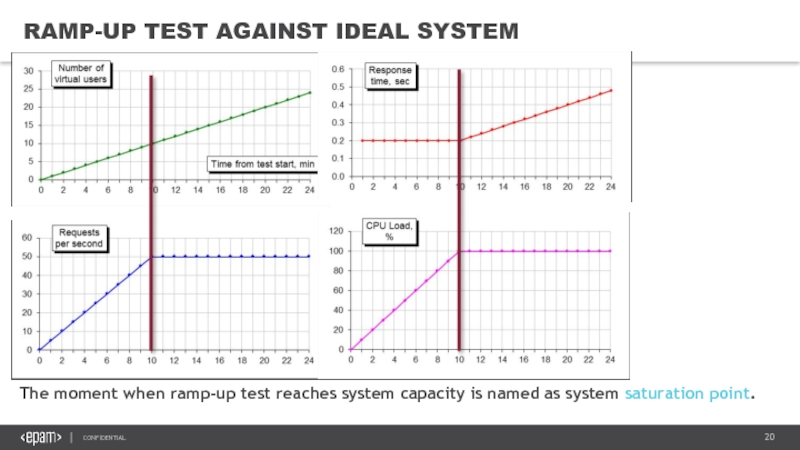
The moment when ramp-up test reaches system
Слайд 21RAMP-UP TEST AGAINST REAL GOOD SYSTEM
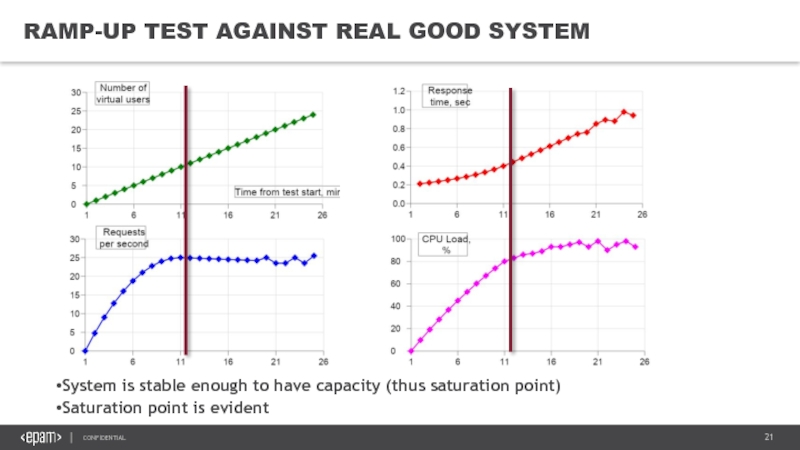
Good news:
System is stable enough to
Saturation point is evident
Слайд 22RAMP-UP TEST AGAINST REAL BAD SYSTEM
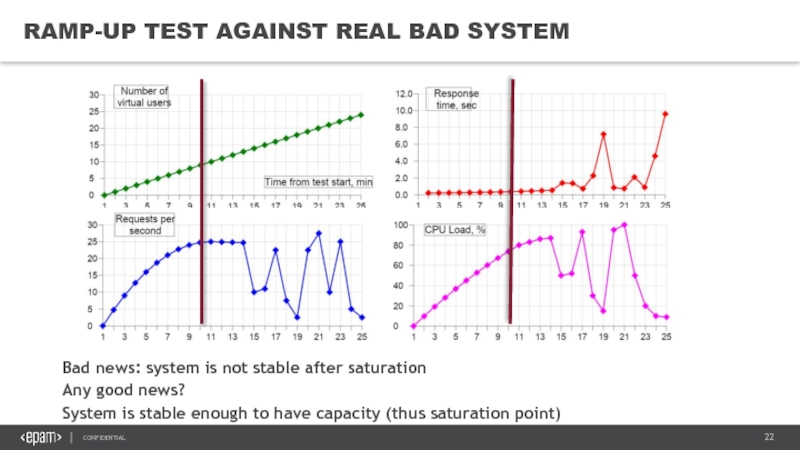
Bad news: system is not stable
Any good news?
System is stable enough to have capacity (thus saturation point)
Слайд 23RAMP-UP TEST AGAINST REALLY BAD SYSTEM
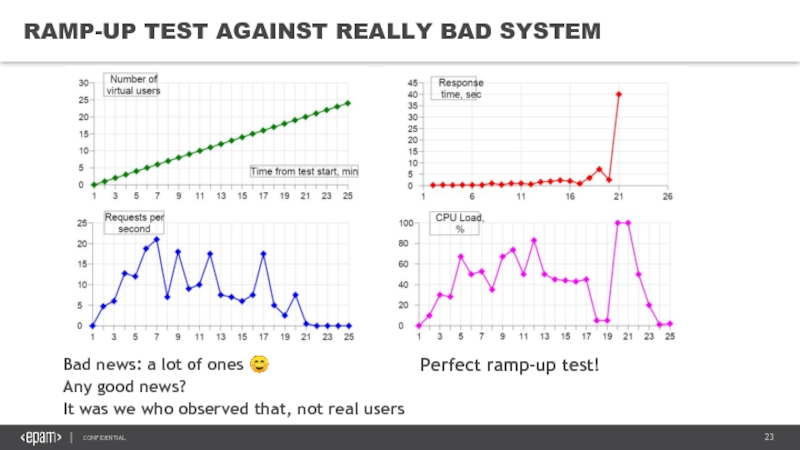
Bad news: a lot of ones
Any good news?
It was we who observed that, not real users
Perfect ramp-up test!
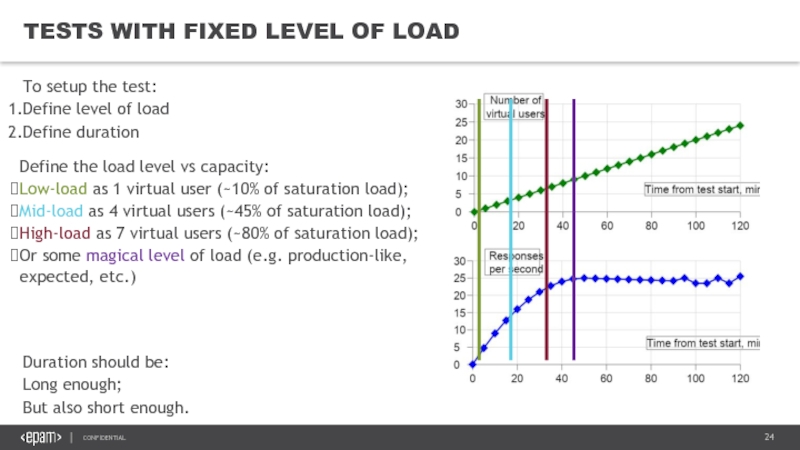
Слайд 24TESTS WITH FIXED LEVEL OF LOAD
To setup the test:
Define level of
Define duration
Define the load level vs capacity:
Low-load as 1 virtual user (~10% of saturation load);
Mid-load as 4 virtual users (~45% of saturation load);
High-load as 7 virtual users (~80% of saturation load);
Or some magical level of load (e.g. production-like, expected, etc.)
Duration should be:
Long enough;
But also short enough.
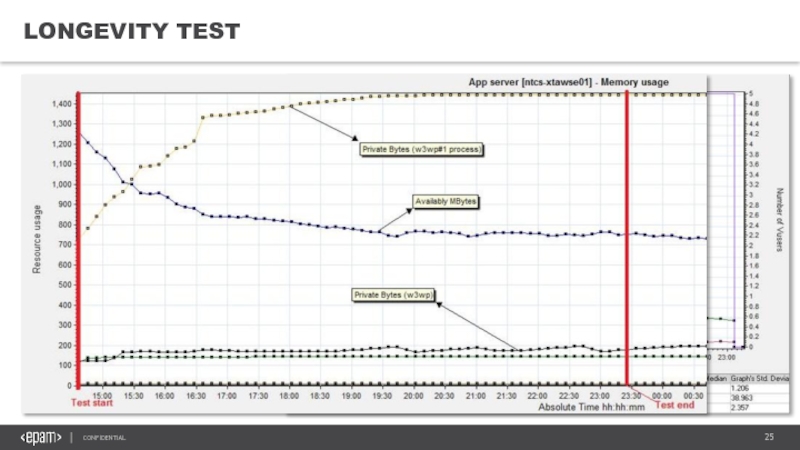
Слайд 25LONGEVITY TEST
Example: graph from a 8-hour-long test
Make high-load test a long
Why is it a different test?
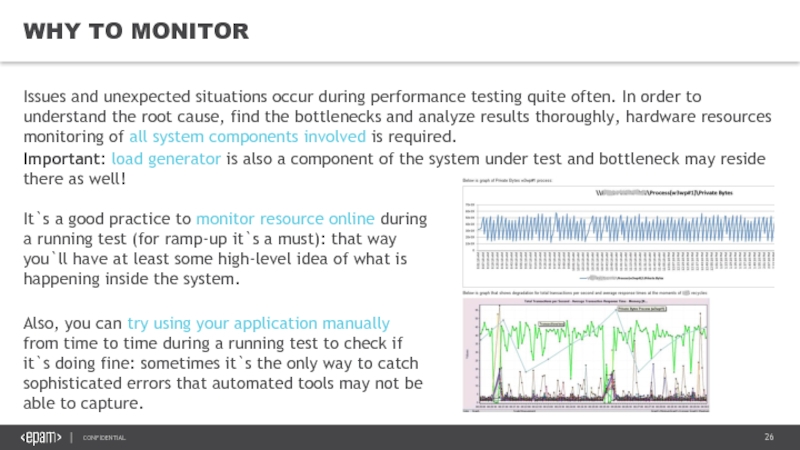
Слайд 26WHY TO MONITOR
Issues and unexpected situations occur during performance testing quite
Important: load generator is also a component of the system under test and bottleneck may reside there as well!
It`s a good practice to monitor resource online during a running test (for ramp-up it`s a must): that way you`ll have at least some high-level idea of what is happening inside the system.
Also, you can try using your application manually from time to time during a running test to check if it`s doing fine: sometimes it`s the only way to catch sophisticated errors that automated tools may not be able to capture.
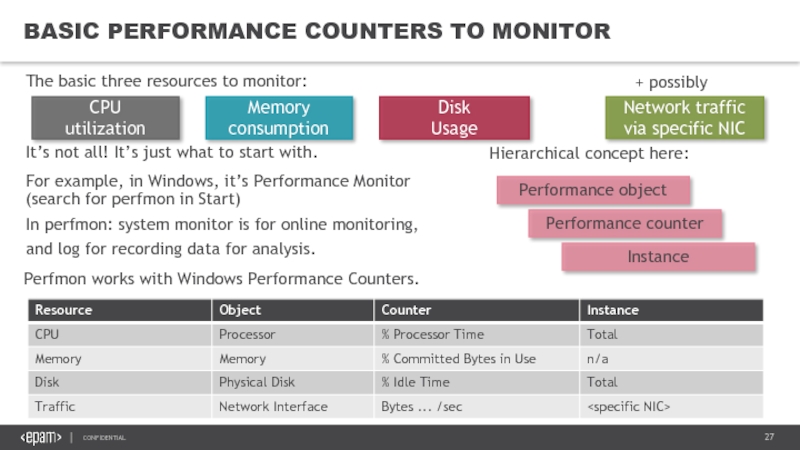
Слайд 27BASIC PERFORMANCE COUNTERS TO MONITOR
The basic three resources to monitor:
It’s not
CPU
utilization
Memory
consumption
Disk
Usage
Network traffic
via specific NIC
+ possibly
For example, in Windows, it’s Performance Monitor
(search for perfmon in Start)
In perfmon: system monitor is for online monitoring,
and log for recording data for analysis.
Perfmon works with Windows Performance Counters.
Performance object
Performance counter
Instance
Hierarchical concept here:
Слайд 28WHAT TO REPORT
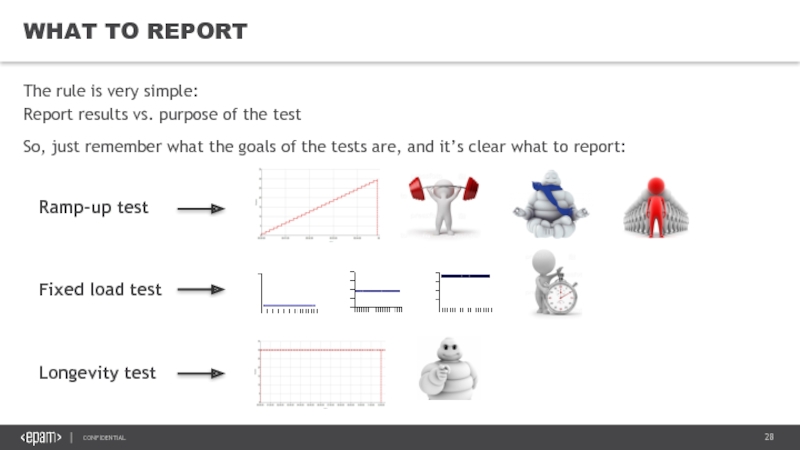
The rule is very simple:
Report results vs. purpose of
Ramp-up test
Fixed load test
Longevity test
So, just remember what the goals of the tests are, and it’s clear what to report:
Слайд 29HOW TO REPORT
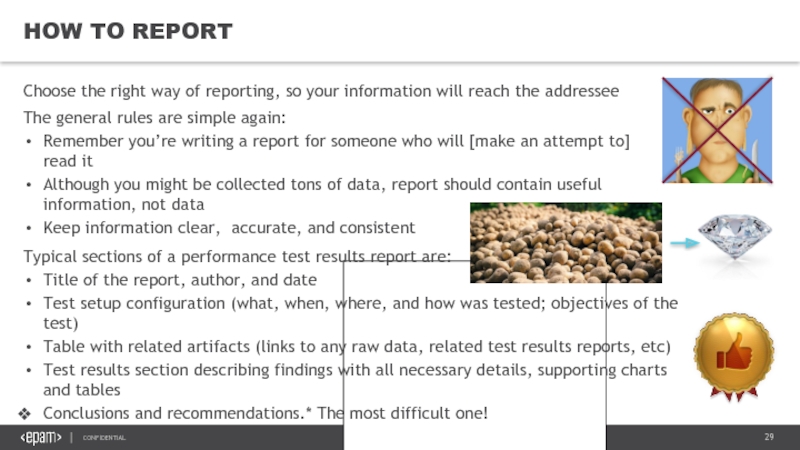
Choose the right way of reporting, so your information
The general rules are simple again:
Remember you’re writing a report for someone who will [make an attempt to] read it
Although you might be collected tons of data, report should contain useful information, not data
Keep information clear, accurate, and consistent
Typical sections of a performance test results report are:
Title of the report, author, and date
Test setup configuration (what, when, where, and how was tested; objectives of the test)
Table with related artifacts (links to any raw data, related test results reports, etc)
Test results section describing findings with all necessary details, supporting charts and tables
Conclusions and recommendations.* The most difficult one!
Слайд 30TOOLS
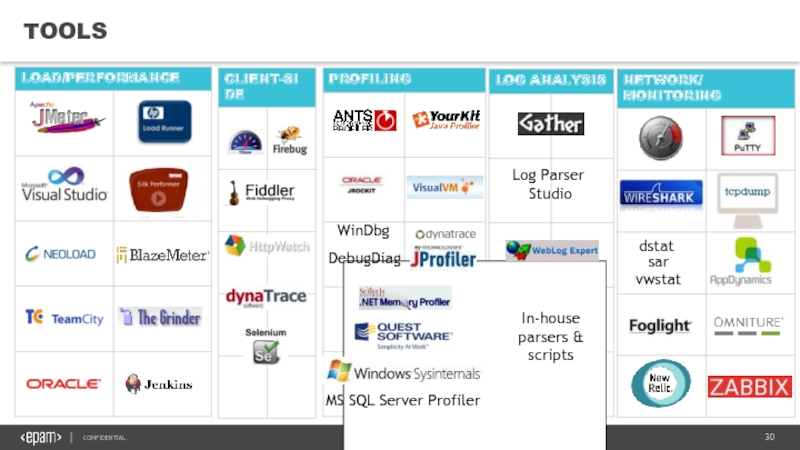
WinDbg
MS SQL Server Profiler
DebugDiag
In-house parsers & scripts
Log Parser
Studio
dstat
sar
vwstat
Слайд 31MATERIALS TO EXPLORE
Useful book that provides great introduction to both server
“Web load testing for dummies”, by Scott Barber and Colin Mason
www.itexpocenter.nl/iec/compuware/WebLoadTestingForDummies.pdf
Nice book about performance testing .NET web-systems (in fact, a lot of general concepts there):
“Performance testing Microsoft .NET web applications”, by Microsoft ACE team
http://www.microsoft.com/mspress/books/5788.aspx
Statistics for dummies ☺:
“The Cartoon Guide to Statistics”, by Larry Gonick and Woolcott Smith
http://www.amazon.com/Cartoon-Guide-Statistics-Larry-Gonick/dp/0062731025
And, introduction to JMeter: http://habrahabr.ru/post/140310/

