Graphs of motion draw and analyze презентация

Learning Objectives: Plot and interpret distance – time, displacement – time, velocity – time, and acceleration – time graphs calculating the area under velocity – time graph to work out

Слайд 1Distance – Time Graph
GRAPHS OF MOTION

Displacement– Time Graph

Acceleration – Time

Graph​

Velocity – Time Graph


DRAW AND ANALYZE


Слайд 2Learning Objectives:

Plot and interpret distance – time, displacement – time, velocity

– time, and acceleration – time graphs calculating the area under velocity – time graph to work out distance travelled for motion with constant velocity or constant acceleration.


Слайд 3Recall
Define the following:

a. Time
b. Distance
c. Displacement
d. Speed
e. Velocity
f. Acceleration


Слайд 4Difference between 
Distance – time graph from Displacement – time graph
* The

position-time graph (x-t) is the same as displacement-time graph. This graph will tell you the exact change in position of a body (using the shortest path between the initial and final point), irrespective of the actual path used (that is called displacement), with respect to time. 

Слайд 5
A distance-time graph, on the other hand, will tell you the

distance covered, that is the exact length of the actual path used to travel from initial point to final point, with respect to time.

Difference between ​
Distance – time graph from Displacement – time grap


Слайд 6Plot the following data of a car traveling on a straight

road with a constant speed, which is indicated by the speedometer of the car. The driver measures the time the car takes to pass every successive kilometers stone on the side of the road. He finds that the car passes the first kilometers in 1 and ½ min., the second kilometre in 3 min. and so on. Thus he notes the position of the car every one and a half minutes :

Слайд 7Answer the following:
1. Describe the data table. 
2. After plotting the data

in the table above, what does the graph look like?
3. What does your answer in number 2 indicate about the motion of the car?
4. How can you determine the instantaneous speed in the graph?
5. What is the slope/ gradient of the graph?
6. What is the unit of the slope of the graph? What physical quantity does it represent?  

Слайд 8Describe the motion of the object having a graph like this. 


Слайд 9As in uniform motion, the distance time graph would be a

straight line, because the equal distance is covered in equal units of time.

The graph shows data from two
moving objects.

1. Describe the two lines. What can you say about
the speeds of the two objects?

2. What is the distance covered by both objects?
How did you say that?

3. Which of the two objects covered the 50 km first?
The second?

4. At what speed was the object represented by the
red line moving?

5. At what speed was the object represented by the
green line moving?

6. What can you conclude about the 
steepness of the line? 


Слайд 10As in uniform motion, the distance time graph would be a

straight line, because the equal distance is covered in equal units of time.

* You can see that there are three bodies A, B and C, all of them are in uniform motion then why do they have different slopes?

** From graph in the right, what conclusion can you make regarding the speeds of the three bodies? 

*** Which has the highest speed (fastest) and which has the least speed (slowest)?


Слайд 11Position-time Graphs or
Displacement - Time Graphs
Distance-Time Graphs give you speed,

but speed is never negative so you can only have a positive slope in a distance-time graph. Position-Time graphs show displacement, have direction, and from which you can calculate velocity. 

Questions:

1. What does the slope of a displacement -time graph indicates?

2. Describe the graph.

3. What is the slope of the graph?

4. What does it tell about the velocity of the object described by that graph?


Слайд 12Describe these graphs’:

1. line

2. slope

3. velocity


Слайд 13Some more displacement - time graphs exercises.  
1. What is the

displacement of  the car travel in the first hour?

2. How far did the car travel in the last hour?

Displacement
   (km)

Time (hr)


Слайд 141.  What does displacement-time graph tells us?

2. Describe the motion of

the following lines:
A . green line D. violet line
B. brown line E. orange line
C. red line F. light blue line


Слайд 15Answers:

1. D- t graphs tell us how far from an object

has moved with time.
2. A. fast and steady/ constant speed
B.  decreasing velocity over time
C. steady/ constant velocity
D. stationary / at rest
E. returning to start with a constant velocity
F. increasing velocity over time    

Слайд 16*  The velocity of an object is its speed in a

particular direction. This means that two cars traveling at the same speed, but in opposite directions, have different velocities. One velocity will be positive, and the velocity in the other direction will be negative.


* The vertical axis of a velocity-time graph is the velocity of the object and the horizontal axis is the time taken from the start.


* When an object is moving with a constant velocity, the line on the graph is horizontal. When an object is moving with a steadily increasing velocity, or a steadily decreasing velocity, the line on the graph is straight, but sloped. The following diagram shows some typical lines on a velocity-time graph..


Слайд 17Answer the following:

1. What is the unit of the slope of

a V-t graph? 

2. Describe the line, slope and motion of the object projected by line A, B, C and D.

3. Which of the 4 lines has the greatest acceleration? Which has the least?  


Слайд 181. An object’s motion is seen in the graph in the

right.

Interpret the graph. A. Describe the slope and motion of the object for the first 3 seconds.

B. Then, motion for the next 2 seconds (from t=3 to t=5).

C. Next from t=5 to t=8.

D.  What about for the last 2 seconds?

Слайд 192. Draw the velocity – time graph for this displacement -time

graph.

Слайд 21Which of the following graphs show a graph for a uniformly

accelerated motion that the distance is changing exponentially indicating that the velocity is changing at a constant rate or there is constant acceleration?

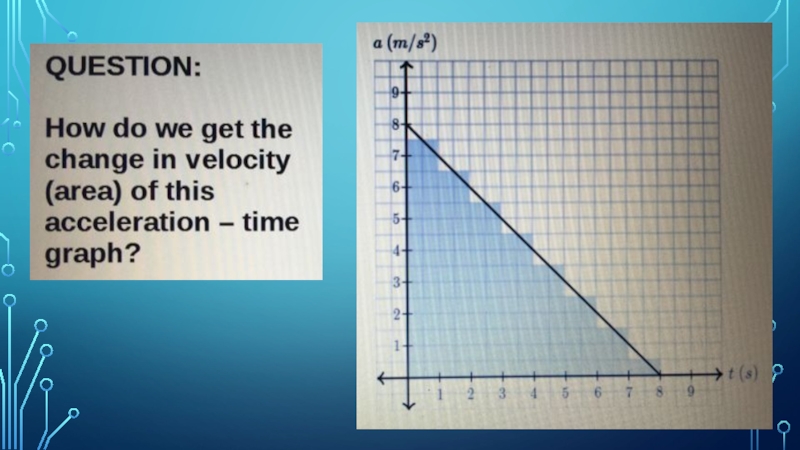
Draw the velocity – time graph of the graph showing uniformly accelerated motion.


Слайд 23The shaded area is representative of the displacement during from 0

seconds to 6 seconds. This area takes on the shape of a rectangle can be calculated using the following equation.

Слайд 24The shaded area is representative of the displacement during from 0

seconds to 4 seconds. This area takes on the shape of a triangle can be calculated using the following equation.

Слайд 25The shaded area is representative of the displacement during from 2

seconds to 5 seconds. This area takes on the shape of a trapezoid can be calculated using the appropriate equation.

Обратная связь

Если не удалось найти и скачать презентацию, Вы можете заказать его на нашем сайте. Мы постараемся найти нужный Вам материал и отправим по электронной почте. Не стесняйтесь обращаться к нам, если у вас возникли вопросы или пожелания:

Email: Нажмите что бы посмотреть 

Что такое ThePresentation.ru?

Это сайт презентаций, докладов, проектов, шаблонов в формате PowerPoint. Мы помогаем школьникам, студентам, учителям, преподавателям хранить и обмениваться учебными материалами с другими пользователями.


Для правообладателей

Яндекс.Метрика