- Главная
- Разное
- Дизайн
- Бизнес и предпринимательство
- Аналитика
- Образование
- Развлечения
- Красота и здоровье
- Финансы
- Государство
- Путешествия
- Спорт
- Недвижимость
- Армия
- Графика
- Культурология
- Еда и кулинария
- Лингвистика
- Английский язык
- Астрономия
- Алгебра
- Биология
- География
- Детские презентации
- Информатика
- История
- Литература
- Маркетинг
- Математика
- Медицина
- Менеджмент
- Музыка
- МХК
- Немецкий язык
- ОБЖ
- Обществознание
- Окружающий мир
- Педагогика
- Русский язык
- Технология
- Физика
- Философия
- Химия
- Шаблоны, картинки для презентаций
- Экология
- Экономика
- Юриспруденция
Data coding and screening презентация
Содержание
- 1. Data coding and screening
- 2. WHAT IS DATA CODING? “A systematic
- 3. Variables: Categories: Gender Age Male Female 18-25
- 4. WHEN TO CODE When testing a hypothesis
- 5. LEVELS OF CODING (FOR QUALITATIVE DATA)
- 6. WHY DO DATA CODING? It lets you
- 7. DATA SCREENING Used to identify miscoded, missing,
- 8. DETERMINING CODES (BOURQUE, 2004) For surveys
- 9. IMPORTANCE OF CODEBOOK (SHENTON, 2004) Allows
- 10. DETERMINING CODES, CONT. Exhaustive – a unique
- 11. DETERMINING CODES, CONT. Missing Data - includes
- 12. CREATING CODE FRAME PRIOR TO DATA
- 13. TABLE OF CODE VALUES (EPSTEIN & MARTIN, 2005)
- 14. TRANSCRIPT (SHENTON, 2004) Appropriate for open-ended answers
- 15. THREE PARTS TO TRANSCRIPT (SHENTON, 2004)
- 16. POSTCODING (SHENTON, 2004) Post-meeting observations Post-transcript review
- 17. DATA DICTIONARY (SHENTON, 2004)
- 18. REFERENCES Bourque, Linda B. "Coding." In The
- 19. Levels of Measurement
- 20. Coding Mixed Methods: Advantages and Disadvantages
- 21. Position 1 v. Position 2 “When compared
- 22. Move Toward P1 and P2 Cooperation Cooperation
- 23. Advantages of Mixed Methods: Improves validity
- 24. Disadvantages of Mixed Methods Inequality in data
- 25. Key Point in Coding Mixed Methods
- 26. Examining a Mixed Methods Research Study
- 27. Study Details Population: Purposive population, 10 undergraduates
- 28. Methods Data: Used both qualitative and qualitative
- 29. Study Observations Followed 3 groups of business
- 30. Coding Methods Used pre-selected codes from literature
- 31. Coding: Ordinal Measures Opinion Survey What sources
- 32. Examples of Ratio-Interval Coding and Level of
- 33. Study Conclusions This study reveals that in
- 34. Study Weaknesses: Use of Mixed Methods Data
- 35. Study Advantages: Use of Mixed Methods Data
- 36. OUTLIERS IN DATA ANALYSIS
- 37. WHAT IS AN OUTLIER? Miller (1981): '...
- 38. WHY ARE OUTLIERS IMPORTANT IN DATA ANALYSIS?
- 39. ISSUES CONCERNING OUTLIERS Rejection of Outliers “From
- 40. What do we do with outliers? There
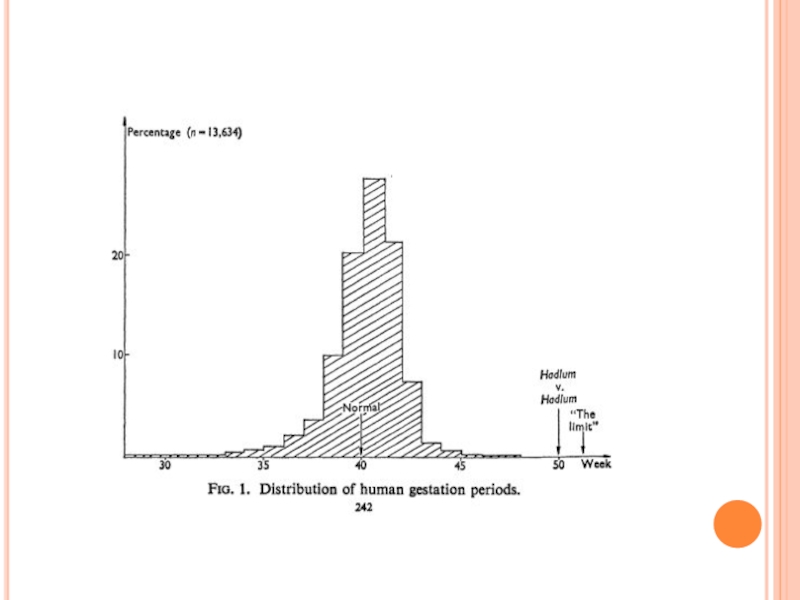
- 41. A CLASSIC EXAMPLE ON THE USE OF OUTLIERS Hadlum vs. Hadlum (1949)
- 43. Sources Barnett, Vic. 1978. The study of

Слайд 2WHAT IS DATA CODING?
“A systematic way in which to condense extensive
“The process by which verbal data are converted into variables and categories of variables using numbers, so that the data can be entered into computers for analysis.”2
Lockyer, Sharon. "Coding Qualitative Data." In The Sage Encyclopedia of Social Science Research Methods, Edited by Michael S. Lewis-Beck, Alan Bryman, and Timothy Futing Liao, v. 1, 137-138. Thousand Oaks, Calif.: Sage, 2004.
Bourque, Linda B. "Coding." In The Sage Encyclopedia of Social Science Research Methods, Edited by Michael S. Lewis-Beck, Alan Bryman, and Timothy Futing Liao, v. 1, 132-136. Thousand Oaks, Calif.: Sage, 2004.

Слайд 3Variables:
Categories:
Gender
Age
Male
Female
18-25
26-33
34-41
Do you like ice cream?
yes
no
Categories and Variables

Слайд 4WHEN TO CODE
When testing a hypothesis (deductive), categories and codes can
When generating a theory (inductive), categories and codes are generated after examining the collected data.
Content analysis
How will the data be used?
Adopted from Bourque (2004) and Lockyer (2004).
, categories and codes can be developed before data")
Слайд 5LEVELS OF CODING
(FOR QUALITATIVE DATA)
Open
Break down, compare, and categorize data
Axial
Make connections
Selective
Select the core category, relate it to other categories and confirm and explain those relationships
Strauss, A. and J. Corbin. Basics of qualitative research: Grounded theory procedures and techniques. Newbury Park, CA: Sage, 1990 as cited in Lockyer, S., 2004.
OpenBreak down, compare, and categorize dataAxialMake connections between categories after")
Слайд 6WHY DO DATA CODING?
It lets you make sense of and analyze
For qualitative studies, it can help you generate a general theory.
The type of statistical analysis you can use depends on the type of data you collect, how you collect it, and how it’s coded.
“Coding facilitates the organization, retrieval, and interpretation of data and leads to conclusions on the basis of that interpretation.”1
Lockyer, Sharon. "Coding Qualitative Data." In The Sage Encyclopedia of Social Science Research Methods, Edited by Michael S. Lewis-Beck, Alan Bryman, and Timothy Futing Liao, v. 1, 137-138. Thousand Oaks, Calif.: Sage, 2004

Слайд 7DATA SCREENING
Used to identify miscoded, missing, or messy data
Find possible outliers,
Can improve performance of statistical methods
Screening should be done with particular analysis methods in mind
From Data Screening: Essential Techniques for Data Review and Preparation by Leslie R. Odom and Robin K. Henson. A paper presented at the annual meeting of the Southwest Educational Research Association, Feb. 15, 2002, Austin, Texas.

Слайд 8DETERMINING CODES
(BOURQUE, 2004)
For surveys or questionnaires, codes are finalized as
For interviews, focus groups, observations, etc. , codes are developed inductively after data collection and during data analysis
For surveys or questionnaires, codes are finalized as the questionnaire is completedFor")
Слайд 9IMPORTANCE OF CODEBOOK
(SHENTON, 2004)
Allows study to be repeated and validated.
Makes methods transparent by recording analytical thinking used to devise codes.
Allows comparison with other studies.
Allows study to be repeated and validated. Makes methods transparent by")
Слайд 10DETERMINING CODES, CONT.
Exhaustive – a unique code number has been created
Mutually Exclusive – information being coded can only be assigned to one category
Residual other – allows for the participant to provide information that was not anticipated, i.e. “Other” _______________

Слайд 11DETERMINING CODES, CONT.
Missing Data - includes conditions such as “refused,” “not
Heaping – is the condition when too much data falls into same category, ex. college undergraduates in 18-21 range (variable becomes useless because it has no variance)

Слайд 12CREATING CODE FRAME PRIOR TO DATA COLLECTION (BOURQUE, 2004; EPSTEIN &
Use this when know number of variables and range of probable data in advance of data collection, e.g. when using a survey or questionnaire
Use more variables rather than fewer
Do a pre-test of questions to help limit “other” responses
Use this when")
")
Слайд 14TRANSCRIPT (SHENTON, 2004)
Appropriate for open-ended answers as in focus groups, observation,
Strengthens “audit trail” since reviewers can see actual data
Use identifiers that anonymize participant but still reveal information to researcher
ex. Y10/B-3/II/83 or “Mary”
Appropriate for open-ended answers as in focus groups, observation, individual interviews, etc.Strengthens “audit")
Слайд 15THREE PARTS TO TRANSCRIPT
(SHENTON, 2004)
Background information, ex. time, date, organizations
Verbatim transcription (if possible, participants should verify for accuracy)
Observations made by researcher after session, ex. diagram showing seating, intonation of speakers, description of room
Background information, ex. time, date, organizations involved, participants.Verbatim transcription (if")
Слайд 16POSTCODING (SHENTON, 2004)
Post-meeting observations
Post-transcript review
a. Compilation of insightful quotations
b. Preliminary theme
c. Identification of links to previous work
Create categories and definitions of codes
Post-meeting observationsPost-transcript review a. Compilation of insightful quotations b. Preliminary theme tracking c. Identification of")
")
Слайд 18REFERENCES
Bourque, Linda B. "Coding." In The Sage Encyclopedia of Social Science
Lee, Epstein and Andrew Martin. "Coding Variables." In The Encyclopedia of Social Measurement. Ed. Kimberly Kempf-Leonard, v.1, 321-327. New York: Elsevier Academic Press, 2005.
Shenton, Andrew K. “The analysis of qualitative data in LIS research projects: A possible approach.” Education for Information 22 (2004): 143-162.


Слайд 21Position 1 v. Position 2
“When compared to quantitative research, qualitative research
Source: Riggs, D.E. (1998). Let us stop apologizing for qualitative research. College & Research Libraries, 59(5).
Retrieved from: http://www.ala.org/ala/acrl/acrlpubs/crljournal/backissues1998b/september98/ALA_print_layout_1_179518_179518.cfm

Слайд 22Move Toward P1 and P2 Cooperation
Cooperation – last 25 years –
Limitations of only using one method:
Quantitative – lack of thick description
Qualitative – lacks visual presentation of numbers
Source: Grbich, Carol. “Incorporating Data from Multiple Sources.” In Qualitative Data Analysis. (Thousand Oaks, Calif.: Sage Publications, 2007): 195-204.

Слайд 23Advantages of Mixed Methods:
Improves validity of findings
More in-depth data
Increases your capacity
Provides detail of individual experiences behind the statistics
More focused questionnaire
Further in-depth interviews can be used to tease out problems and seek solutions

Слайд 24Disadvantages of Mixed Methods
Inequality in data sets
“Data sets must be properly
“Numerical data set treated less theoretically, mere proving of hypothesis”
Presenting both data sets can overwhelm the reader
Synthesized findings might be “dumbed-down” to make results more readable
Source: Grbich, Carol. “Incorporating Data from Multiple Sources.” In Qualitative Data Analysis. (Thousand Oaks, Calif.: Sage Publications, 2007): 195-204.

Слайд 25Key Point in Coding
Mixed Methods Data
“The issue to be most
Source: Grbich, Carol. “Incorporating Data from Multiple Sources.” In Qualitative Data Analysis. (Thousand Oaks, Calif.: Sage Publications, 2007): 195-204.

Слайд 26Examining a Mixed Methods Research Study
Makani, S. & Wooshue, K. (2006).
. Information seeking behaviors of")
Слайд 27Study Details
Population: Purposive population, 10 undergraduates (2 groups) / 5 graduate
Undergraduate business students at Dalhousie University in Canada
Objectives: To explore the information-seeking behaviors of business students at Dalhousie University in Canada to determine if these behaviors should direct the design and development of digital academic libraries.
 / 5 graduate students Undergraduate business students")
Слайд 28Methods
Data: Used both qualitative and qualitative data collected through a survey,
Qualitative case study data was coded using QSR N6 qualitative data analysis software.

Слайд 29Study Observations
Followed 3 groups of business students working on group project

Слайд 30Coding Methods
Used pre-selected codes from literature review:
Time
Efficiency of use
Cost
Actors
Objects (research sources)
")
Слайд 31Coding: Ordinal Measures
Opinion Survey
What sources do you use to get started

Слайд 32Examples of Ratio-Interval Coding and Level of Measurement
The age of the
Most of the undergraduates were between 18 and 25 years of age (95%)
While 56% of graduate students fell within the same age range.

Слайд 33Study Conclusions
This study reveals that in order to create an effective

Слайд 34Study Weaknesses: Use of Mixed Methods Data
No discussion of how the
Survey questions were not included in the published article
Created for a long results section

Слайд 35Study Advantages: Use of Mixed Methods Data
Numeric data helped create a
Numeric data from the survey questions nicely compliments the excerpts from the semi-structured interviews


Слайд 37WHAT IS AN OUTLIER?
Miller (1981): '... An outlier is a single
Barnett & Lewis (1984): '... An outlier in a set of data is an observation which appears to be inconsistent with the remainder of that set of data....'
: '... An outlier is a single observation or single mean")
Слайд 38WHY ARE OUTLIERS IMPORTANT IN DATA ANALYSIS?
Outliers can influence the analysis
Objective analysis should be done in order to determine the cause of an outlier appearing in a data set

Слайд 39ISSUES CONCERNING OUTLIERS
Rejection of Outliers
“From the earliest efforts to harness and

Слайд 40What do we do with outliers?
There are four basic ways in
The outlier can be accommodated into the data set through sophisticated statistical refinements
An outlier can be incorporated by replacing it with another model
The outlier can be used identify another important feature of the population being analyzed, which can lead to new experimentation
If other options are of no alternative, the outlier will be rejected and regarded as a “contaminant” of the data set

")
Слайд 43Sources
Barnett, Vic. 1978. The study of outliers: purpose and models. Applied
Munoz-Garcia, J., J.L. Moreno-Rebollo, and A. Pascual-Acosta. 1990. Outliers: a formal approach. International Statistical Review 58: 215-226.