- Главная
- Разное
- Дизайн
- Бизнес и предпринимательство
- Аналитика
- Образование
- Развлечения
- Красота и здоровье
- Финансы
- Государство
- Путешествия
- Спорт
- Недвижимость
- Армия
- Графика
- Культурология
- Еда и кулинария
- Лингвистика
- Английский язык
- Астрономия
- Алгебра
- Биология
- География
- Детские презентации
- Информатика
- История
- Литература
- Маркетинг
- Математика
- Медицина
- Менеджмент
- Музыка
- МХК
- Немецкий язык
- ОБЖ
- Обществознание
- Окружающий мир
- Педагогика
- Русский язык
- Технология
- Физика
- Философия
- Химия
- Шаблоны, картинки для презентаций
- Экология
- Экономика
- Юриспруденция
Component maps презентация
Содержание
- 1. Component maps
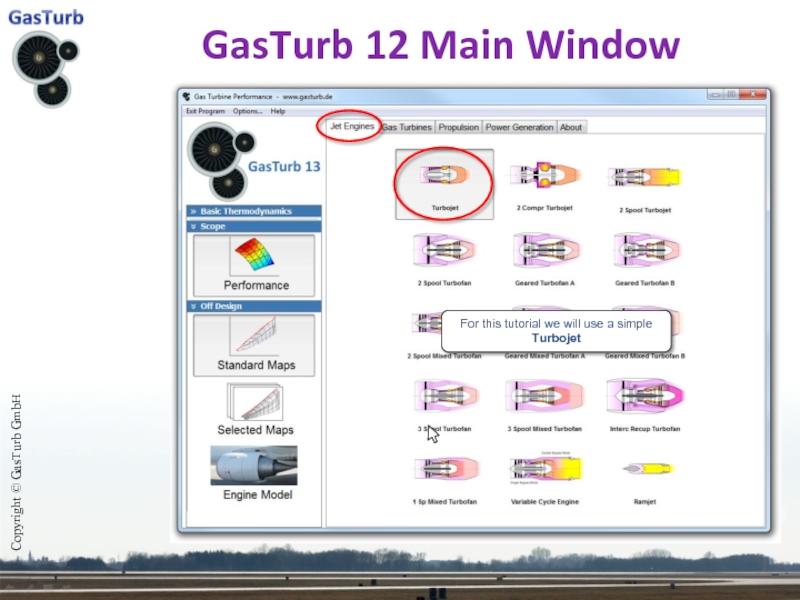
- 2. GasTurb 12 Main Window For
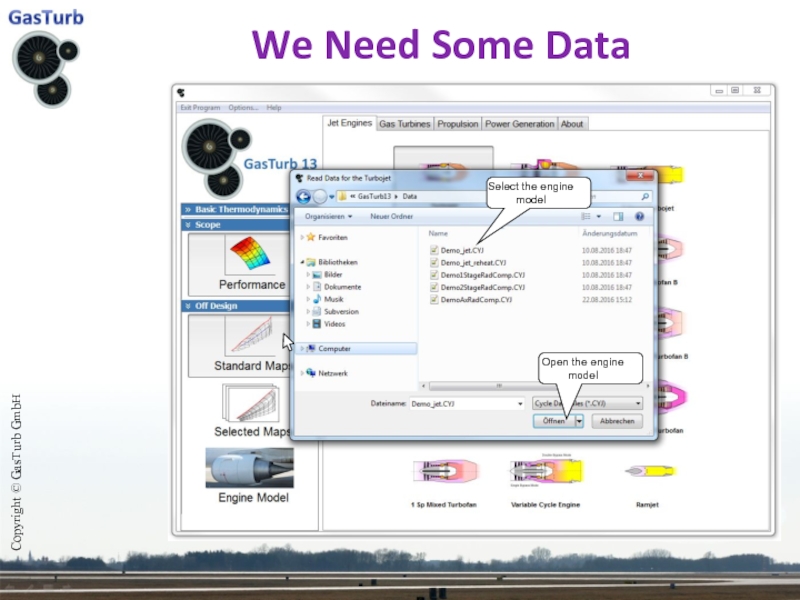
- 3. We Need Some Data Copyright ©
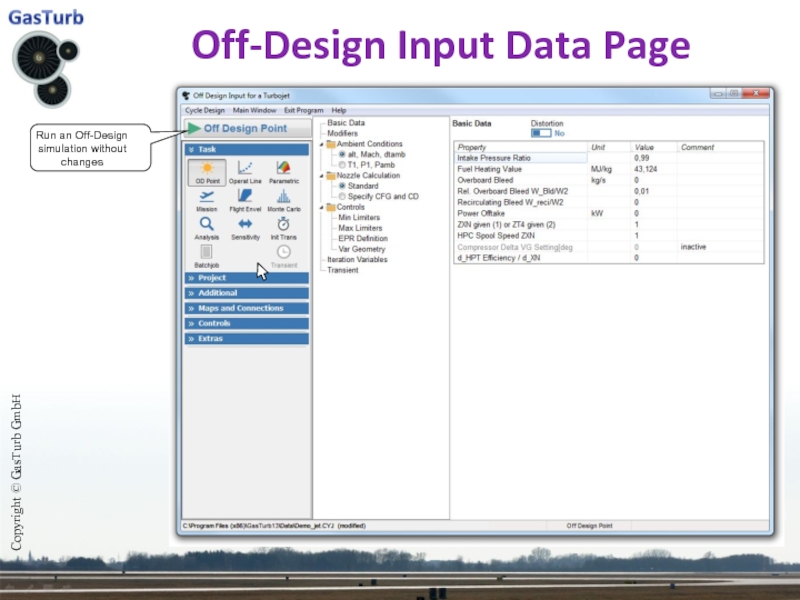
- 4. Off-Design Input Data Page Copyright © GasTurb GmbH Run an Off-Design simulation without changes
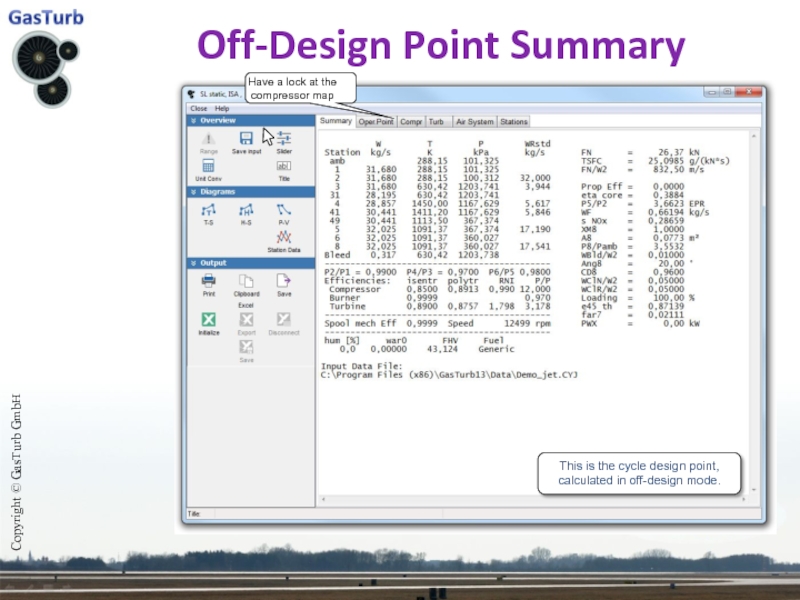
- 5. Off-Design Point Summary Copyright © GasTurb
- 6. Standard Compressor Map In this special
- 7. Off-Design Input Data Page Copyright ©
- 8. HP Compressor Map Copyright © GasTurb GmbH
- 9. Map Scaling Copyright © GasTurb GmbH
- 10. Save the data as Engine Model
- 11. Off-Design Input Data Page Copyright ©
- 12. Compressor Map New Copyright © GasTurb GmbH
- 13. Compressor Map Old Copyright © GasTurb GmbH
- 14. Effect of Map Scaling on SFC Copyright
- 15. Comparing Measured Data With GasTurb Copyright
- 16. Read Test Data Copyright © GasTurb
- 17. Making the Comparative Data Visible Copyright ©
- 18. Comparing SFC Copyright © GasTurb GmbH Simulation
- 19. Comparing Compressor Efficiency Copyright © GasTurb GmbH
- 20. The Compressor Map Editor Copyright © GasTurb
- 21. The Compressor Map Editor Copyright © GasTurb
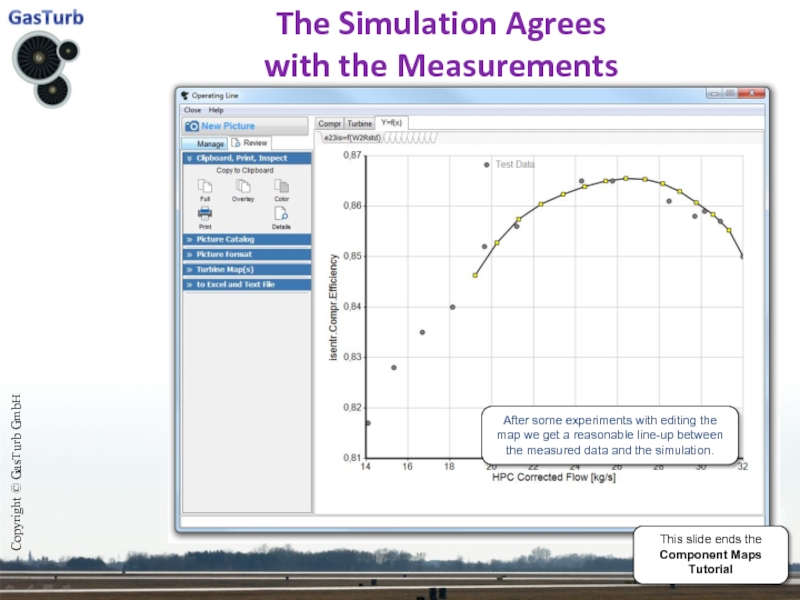
- 22. The Simulation Agrees with the Measurements
Слайд 2GasTurb 12 Main Window
For this tutorial we will use a simple
Copyright © GasTurb GmbH
Слайд 4Off-Design Input Data Page
Copyright © GasTurb GmbH
Run an Off-Design simulation without
Слайд 5Off-Design Point Summary
Copyright © GasTurb GmbH
Have a lock at the compressor
This is the cycle design point, calculated in off-design mode.
Слайд 6Standard Compressor Map
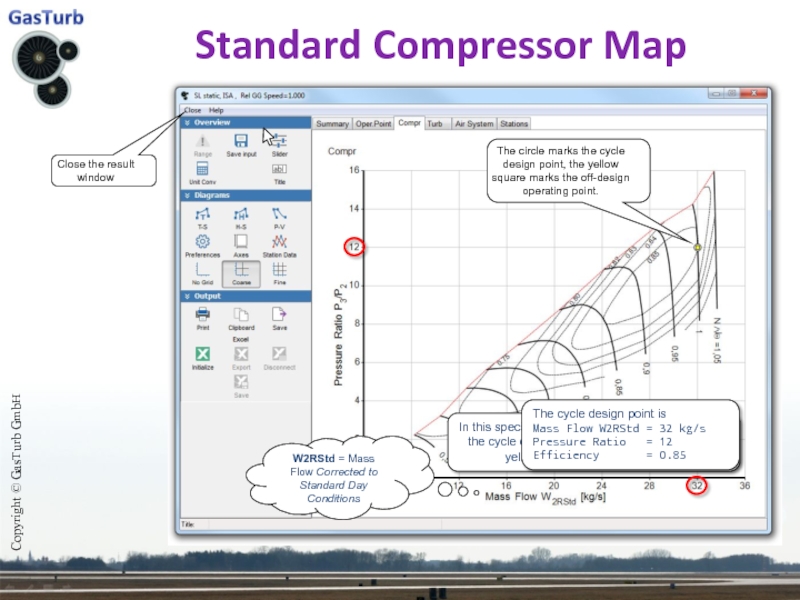
In this special case – because we have calculated
Copyright © GasTurb GmbH
Close the result window
The circle marks the cycle design point, the yellow square marks the off-design operating point.
The cycle design point is
Mass Flow W2RStd = 32 kg/s
Pressure Ratio = 12
Efficiency = 0.85
W2RStd = Mass Flow Corrected to Standard Day Conditions
Слайд 7Off-Design Input Data Page
Copyright © GasTurb GmbH
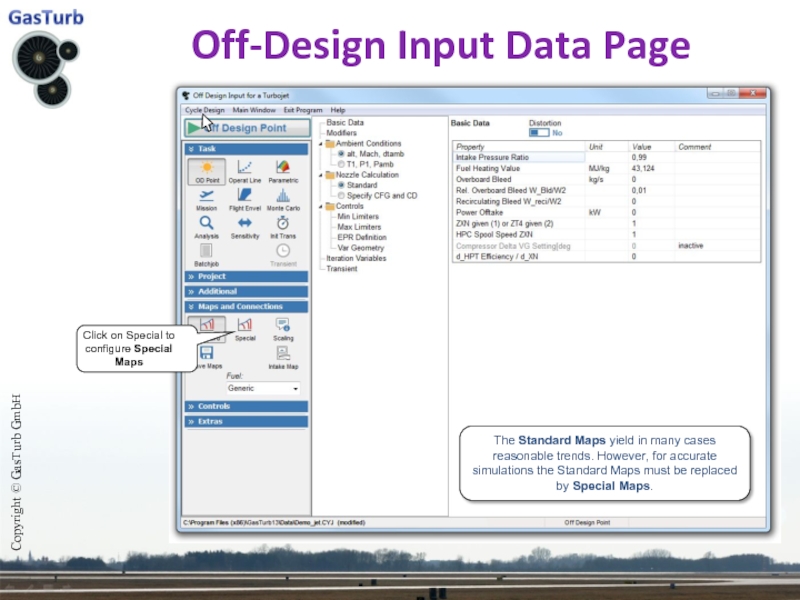
Click on Special to configure
The Standard Maps yield in many cases reasonable trends. However, for accurate simulations the Standard Maps must be replaced by Special Maps.
Слайд 8HP Compressor Map
Copyright © GasTurb GmbH
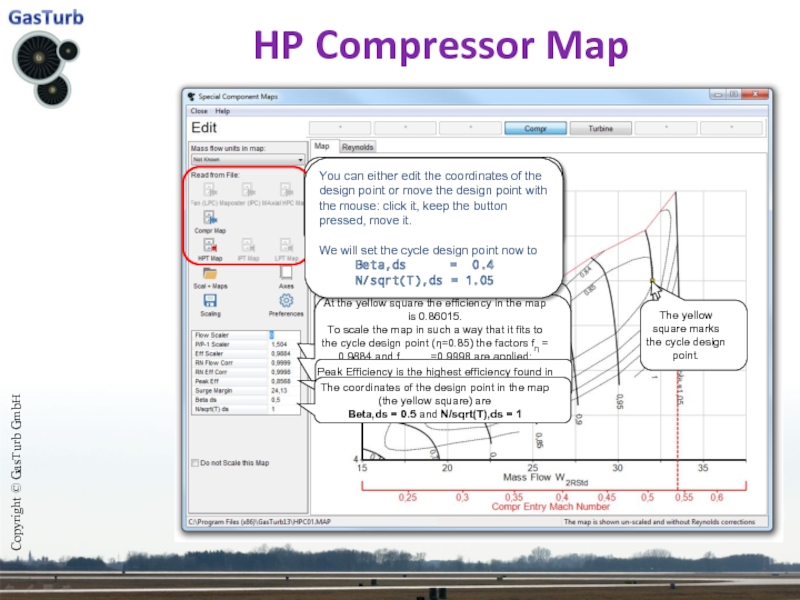
In this window you can read
To shorten the tutorial we do not read a special map, we stay with the default map.
Peak Efficiency is the highest efficiency found in the scaled map.
The coordinates of the design point in the map (the yellow square) are
Beta,ds = 0.5 and N/sqrt(T),ds = 1
The yellow square marks the cycle design point.
You can either edit the coordinates of the design point or move the design point with the mouse: click it, keep the button pressed, move it.
We will set the cycle design point now to
Beta,ds = 0.4
N/sqrt(T),ds = 1.05
Слайд 9Map Scaling
Copyright © GasTurb GmbH
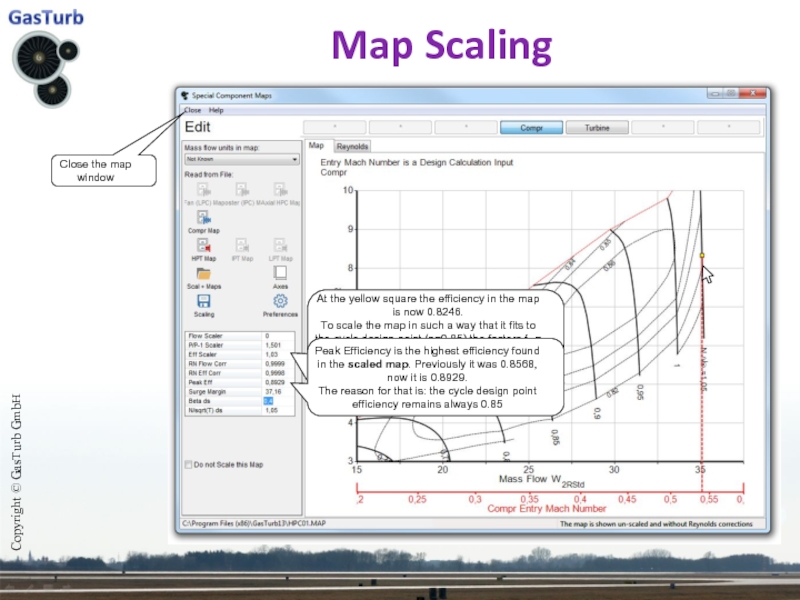
Peak Efficiency is the highest efficiency found
The reason for that is: the cycle design point efficiency remains always 0.85
Close the map window
Слайд 10Save the data as Engine Model
Copyright © GasTurb GmbH
Click on Operating
The data can only be stored as Engine Model File if all data on the Steady State page are identical to those from the cycle design point and if all the Modifiers are zero.
An Engine Model File contains in addition to a normal data file information about the component maps and how they are scaled.
Next we run a single operating line with the default settings.
Слайд 11Off-Design Input Data Page
Copyright © GasTurb GmbH
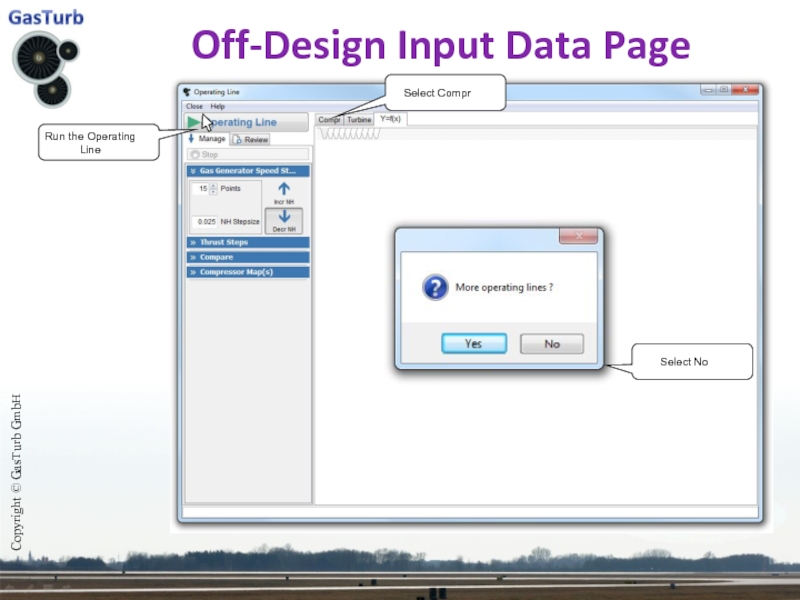
Run the Operating Line
Select No
Select
Слайд 12Compressor Map New
Copyright © GasTurb GmbH
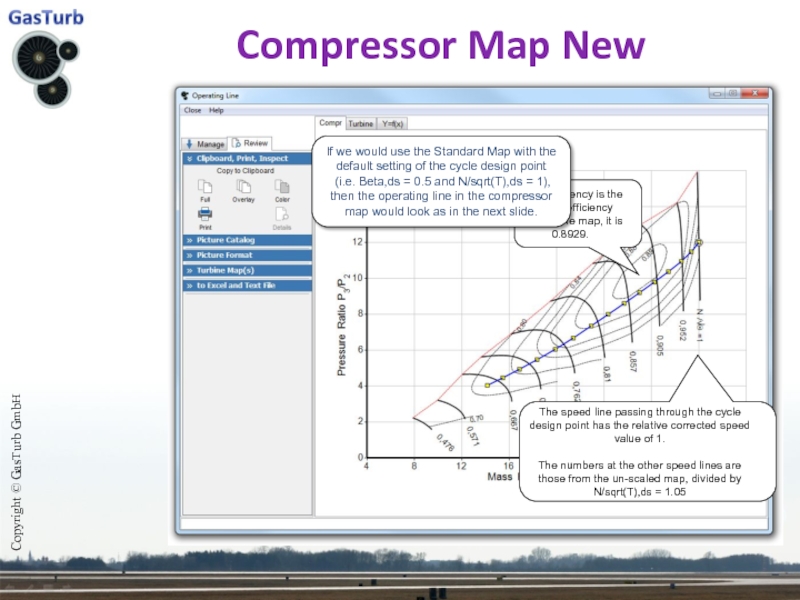
The speed line passing through the
The numbers at the other speed lines are those from the un-scaled map, divided by N/sqrt(T),ds = 1.05
Peak Efficiency is the highest efficiency found in the map, it is 0.8929.
If we would use the Standard Map with the default setting of the cycle design point
(i.e. Beta,ds = 0.5 and N/sqrt(T),ds = 1),
then the operating line in the compressor map would look as in the next slide.
Слайд 13Compressor Map Old
Copyright © GasTurb GmbH
The speed line passing through the
Peak Efficiency is the highest efficiency found in the map, here it is 0.8568.
Слайд 14Effect of Map Scaling on SFC
Copyright © GasTurb GmbH
Standard Map Scaled
Standard Map Scaled With the Special Design Point Coordinates
Beta,ds = 0.4 and N/sqrt(T),ds = 1.05
This is the cycle design point where both operating lines agree.
Hint:
This slide is made of two pictures which were copied to the clipboard from GasTurb and then pasted into Power Point.
Слайд 15Comparing Measured Data With GasTurb
Copyright © GasTurb GmbH
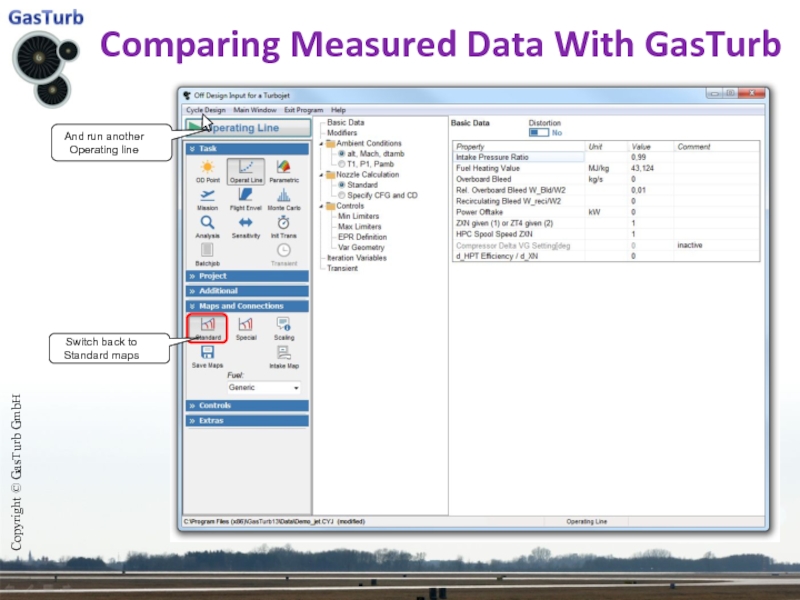
And run another Operating
Switch back to Standard maps
Слайд 16
Read Test Data
Copyright © GasTurb GmbH
Read the file demo_jet.tst
Read a file
Click Open
Run the Operating Line
Select No
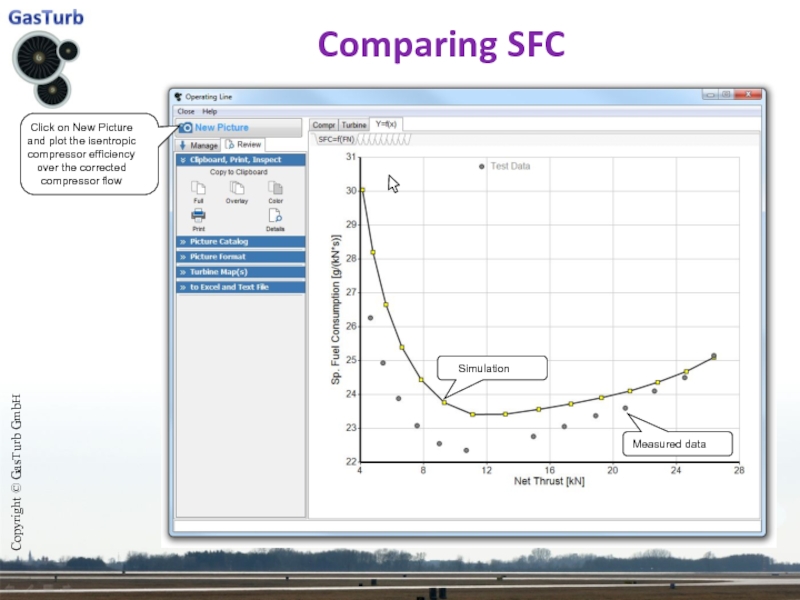
Слайд 18Comparing SFC
Copyright © GasTurb GmbH
Simulation
Measured data
Click on New Picture and plot
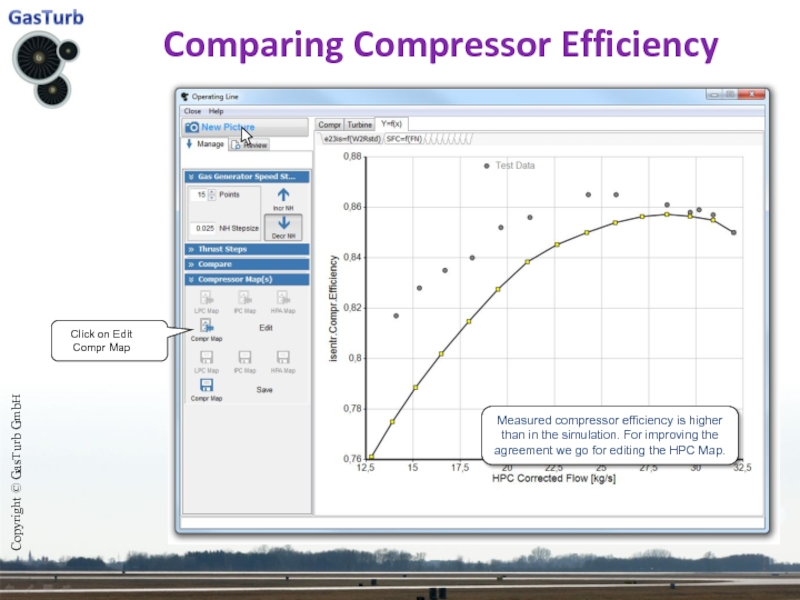
Слайд 19Comparing Compressor Efficiency
Copyright © GasTurb GmbH
Click on Edit Compr Map
Measured compressor
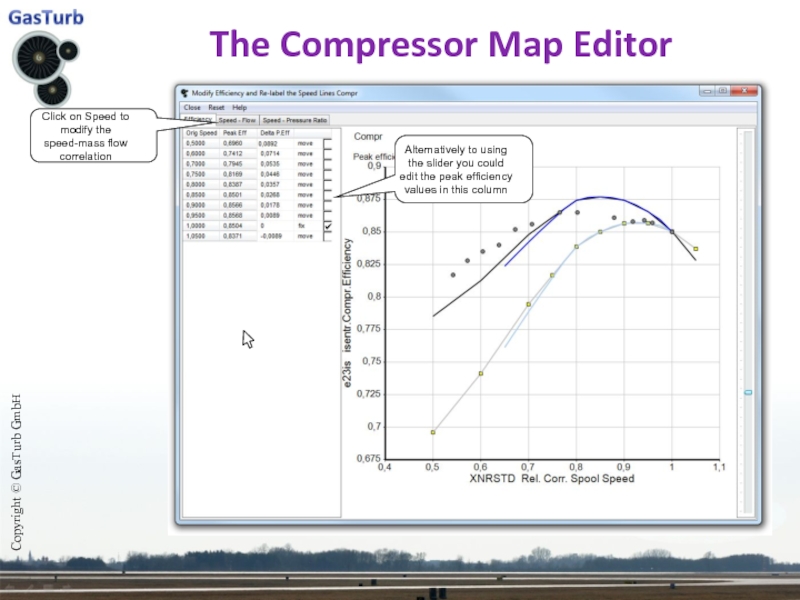
Слайд 20The Compressor Map Editor
Copyright © GasTurb GmbH
We will now use the
This line shows the peak efficiency on each speed line
This line shows the efficiency for beta=0.5
These are the measured efficiency data points
Alternatively to using the slider you could edit the peak efficiency values in this column
Click on Speed to modify the speed-mass flow correlation
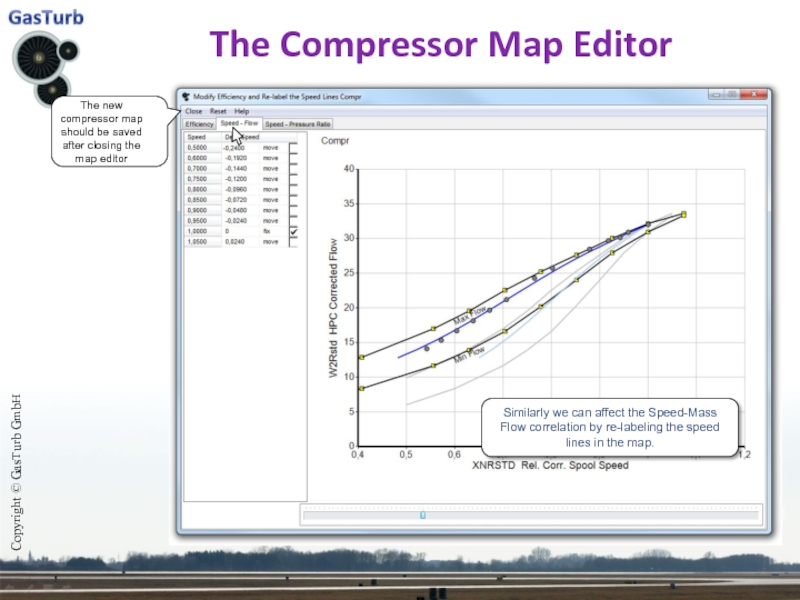
Слайд 21The Compressor Map Editor
Copyright © GasTurb GmbH
Similarly we can affect the
The new compressor map should be saved after closing the map editor
Слайд 22The Simulation Agrees
with the Measurements
Copyright © GasTurb GmbH
After some experiments
This slide ends the
Component Maps Tutorial

