- Главная
- Разное
- Дизайн
- Бизнес и предпринимательство
- Аналитика
- Образование
- Развлечения
- Красота и здоровье
- Финансы
- Государство
- Путешествия
- Спорт
- Недвижимость
- Армия
- Графика
- Культурология
- Еда и кулинария
- Лингвистика
- Английский язык
- Астрономия
- Алгебра
- Биология
- География
- Детские презентации
- Информатика
- История
- Литература
- Маркетинг
- Математика
- Медицина
- Менеджмент
- Музыка
- МХК
- Немецкий язык
- ОБЖ
- Обществознание
- Окружающий мир
- Педагогика
- Русский язык
- Технология
- Физика
- Философия
- Химия
- Шаблоны, картинки для презентаций
- Экология
- Экономика
- Юриспруденция
World demography (natural and mechanical movement of population) презентация
Содержание
- 1. World demography (natural and mechanical movement of population)
- 2. World Population: Growth & Trends
- 3. What’s demography? The quantitative study of
- 4. Natural movement of population Rate birth, death and natural growth
- 5. Mechanical movement of population Human migration
- 6. Take away concepts Why is population growth
- 7. Why Population is so important Thomas Malthus
- 8. Maltus’ 1st Axiom “The power of population
- 9. World Population: 7.3 billion As of Sept., 2014 (Super)exponential growth
- 10. Some observations... Pre-19th century growth rates were ~0.2%/yr
- 11. More... Population growth after 1800’s ranged 1.2-1.9%!
- 12. Likely population by 2050: 9 billion
- 13. Toward “logistic growth” time population Levels off eventually
- 14. Factors affecting Growth Rate Growth rate =
- 15. Calculating Growth Rates (r) Nt = Noexp(r
- 16. Factors affecting Birth Rate Global BR =
- 17. Factors affecting Death Rate Global DR =
- 18. Population Projections Current ~7.3 billion (and rising),
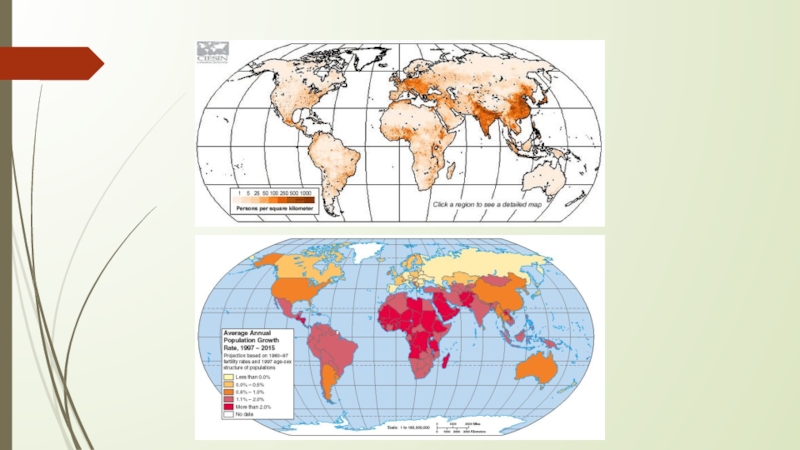
- 19. Where people live
- 20. Population growth rates
- 22. Demographic Transition Refers to the impact of
- 23. Four stages of DT The Preindustrial Stage
- 24. Demographic Transition When is the period of maximum population growth rate?
- 25. Demographic Transition Stage 1: Death rates and
- 26. Population Pyramid Age Population in age class
- 27. 2) Transitional Stage 2.9% growth rate; 4.8 births/woman; 43% population under 15 yrs
- 28. Why is this group so important? Largest
- 29. Population Momentum (also population lag effect)
- 30. 3) Industrial Stage 1.9% growth rate
- 31. 4) Early Postindustrial 0.1% growth rate; 1.8 births/woman; 18% of population under 15 yrs
- 32. 4) Late Postindustrial -0.1% growth rate; 1.2 births/woman; 14% population under 15 yrs
- 33. Population Pyramids for the four demographic transition phases
- 34. China’s past and future population pyramid
- 35. Views from Joel Cohen’s 1995 book “How
- 36. © 2007 POPULATION REFERENCE BUREAU Global Population
- 37. © 2006 POPULATION REFERENCE BUREAU Fertility
- 38. © 2007 POPULATION REFERENCE BUREAU An Important
- 39. © 2007 POPULATION REFERENCE BUREAU In Many
- 40. © 2007 POPULATION REFERENCE BUREAU South Asia
- 41. © 2007 POPULATION REFERENCE BUREAU Vitamin A
- 42. © 2007 POPULATION REFERENCE BUREAU Despite Rising
- 43. © 2007 POPULATION REFERENCE BUREAU Women in
- 44. © 2007 POPULATION REFERENCE BUREAU In Many
- 45. © 2007 POPULATION REFERENCE BUREAU Older People
- 46. Demographic Impact of HIV/AIDS HIV infection rates Impact on life expectancy
- 47. UN Millennium Development Goals UN Millennium Declaration,
- 48. Religious: world and national Languages –
- 49. Thanks for attention!
 I.B.Sarsenova")

Слайд 3What’s demography?
The quantitative study of human populations. Demographers study subjects


Слайд 5Mechanical movement of population Human migration is the movement by people
Migration of population
M = N of I – N of E

Слайд 6Take away concepts
Why is population growth so central to environmental problems?
What is the current population? What will it be in 2050?
What factors affect population growth rates?
How do growth rate compare in developed vs. developing countries?
What is a "demographic transition? What are its stages?
Interpreting Population Pyramids.
Understanding modern demographic trends.

Слайд 7Why Population is so important
Thomas Malthus (1798)
Organism populations increase exponentially,
Factually correct, but a complex problem...
Modern example: high populations AND high quality of life
 Organism populations increase exponentially, whereas the “environment” is")
Слайд 8Maltus’ 1st Axiom
“The power of population is indefinitely greater than the
“Population, when unchecked, increases in a geometrical ratio (exponentially). Subsistence increases only in an arithmetical ratio (linearly).”

exponential growth")
Слайд 10Some observations...
Pre-19th century growth rates were ~0.2%/yr
140 million died of plague: 6th, 14th, and 17th centuries.
Replaced in a few centuries.
Population increased after Renaissance
Modern era population explosion: post-1960

Слайд 11More...
Population growth after 1800’s ranged 1.2-1.9%!
Super-exponential growth
Post-1960 was first time EVER


Слайд 14Factors affecting Growth Rate
Growth rate = Birth Rate - Death Rate
Of these the Birth Rate is the most important contributor, specifically the Fertility Rate (#children/woman)
Why? Because death rates have stabilized...

Слайд 15Calculating Growth Rates (r)
Nt = Noexp(r t)
where No= pop. at
Rearranging to solve for r:
(Nt /No) = exp(r t)
r = ln(Nt/No) / t
Example: with current population of 7 billion, 1% growth rate = 70 million new people/year.
(equiv. to Turkey or Malaysia)
Nt = Noexp(r t) where No= pop. at time t, Nt =")
Слайд 16Factors affecting Birth Rate
Global BR = 1.9% (95% in developing countries).
Lessons
Invest in Family Planning
Reduce poverty
Elevate the status of women
.Lessons on population control from")
Слайд 17Factors affecting Death Rate
Global DR = 0.8% (equal between developing and
Low death rates due to:
medical treatments,
better food supplies and nutrition,
improvements in sanitation, and
access to clean water
Lower DR is the main reason for the global population increase
Low death rates")
Слайд 18Population Projections
Current ~7.3 billion (and rising), growth rate: 1.1% (and falling…).
Projected
Using modern growth rate: Calculated pop. by 2050: ~11 billion.
, growth rate: 1.1% (and falling…).Projected 2050 population: 9 billionUsing")


Слайд 22Demographic Transition
Refers to the impact of economic development on birth and
Responsible for the gradual reduction in pop growth rates during the late-20th century
First noted by demographers for changes in 19th-century Europe, the DT is a critical shift in population growth and age structures that differentiate developed nations from developing nations

Слайд 23Four stages of DT
The Preindustrial Stage when there is little population
The Transitional Stage, when industrialization begins and health care improves, resulting in lowered death rates, but birth rates remain high. Most of the developing world here.
The Industrial Stage, when the birth rate drops due to modernization (and its accompanying social changes). Many developed countries and a few developing countries here.
Finally, the Postindustrial Stage is recognized by further reductions in birth rates, approaching or even below zero population growth. Approximately 13% of the world population (mostly European countries) is in this stage.
A complete DT exhibits both declining birth and death rates


Слайд 25Demographic Transition
Stage 1: Death rates and birth rates both high.
Stage 2:
Stage 3. Decline in birth rate stabilizes population.
Stage 4. Birth and death rates both low, population stable.
Stage 5 (new). Higher death rates than birth rates, populations contract.


 Transitional Stage2.9% growth rate; 4.8 births/woman; 43% population under 15 yrs")
Слайд 28Why is this group so important?
Largest segment of population today..
“bottom billion”
Will be even larger in near future because most of population is under childbearing age (<15 yrs).

Слайд 29Population Momentum
(also population lag effect)
Phenomenon that population will continue to
Due to weighting of age structure towards the young…
So, work toward zero population growth...
Phenomenon that population will continue to grow for decades even")
 Industrial Stage1.9% growth rate")
 Early Postindustrial0.1% growth rate; 1.8 births/woman; 18% of population under 15 yrs")
 Late Postindustrial-0.1% growth rate; 1.2 births/woman; 14% population under 15 yrs")


Слайд 35Views from Joel Cohen’s 1995 book “How Many People Can the Earth
Make a bigger pie: Increase human productive capacities through technology and innovation.
Put fewer forks on the table: Reduce numbers and expectations of people through such means as family planning and vegetarian diets.
3. Teach better manners: Change the terms of people’s interactions through improved planning and government to enhance social justice.

Слайд 36© 2007 POPULATION REFERENCE BUREAU
Global Population Growth Is Driven by Developing
Source: United Nations Population Division, World Population Prospects: The 2006 Revision.
World Population (in Billions): 1950-2050

Слайд 37© 2006 POPULATION REFERENCE BUREAU
Fertility Levels in Selected World Regions,
Children per woman

Слайд 38© 2007 POPULATION REFERENCE BUREAU
An Important Global Issue Is the “Demographic
Source: Carl Haub, 2007 World Population Data Sheet.
Ethiopia and Germany: The Demographic Divide in 2007

Слайд 39© 2007 POPULATION REFERENCE BUREAU
In Many Developing Countries, Fertility Rates Are
Source: United Nations Population Division and National Demographic and Health Surveys.
Fertility Trends in Sub-Saharan Africa: 1980-2005

Слайд 40© 2007 POPULATION REFERENCE BUREAU
South Asia and sub-Saharan Africa Have the
Source: Carl Haub, 2007 World Population Data Sheet.
Prevalence of Underweight Children Under Age 5, by Country

Слайд 41© 2007 POPULATION REFERENCE BUREAU
Vitamin A and Iron Deficiencies Are Also
Source: Disease Control Priorities Project, “Stunting, Wasting, and Micronutrient Disorders” (2006): Table 28.1.
Percent of Children Under Age 5 with Vitamin A and Iron Deficiencies, Selected Regions

Слайд 42© 2007 POPULATION REFERENCE BUREAU
Despite Rising Obesity Levels, Some Households in
Source: U.S. Department of Agriculture, Economic Research Service, Household Food Security in the United States, 2005 (Economic Research Report No.29): Table 1-A.
Percent of Households and Children Who Are Food Insecure, United States: 1998-2005

Слайд 43© 2007 POPULATION REFERENCE BUREAU
Women in the United States Have More
Source: National statistical agencies.
Fertility Trends in Europe and the United States: 1980-2006

Слайд 44© 2007 POPULATION REFERENCE BUREAU
In Many Developing Countries, Fertility Rates Are
Source: United Nations Population Division and National Demographic and Health Surveys.
Fertility Trends in Sub-Saharan Africa: 1980-2005

Слайд 45© 2007 POPULATION REFERENCE BUREAU
Older People Are a Smaller Share of
Source: Carl Haub, 2007 World Population Data Sheet.
Population Age 65 and Older, by Country


Слайд 47UN Millennium Development Goals
UN Millennium Declaration, Sept. 2000
Adopted by 189 countries
By
Eradicate extreme poverty & hunger
Universal primary education
Gender equality, empower women
Reduce child mortality
Improve maternal health
Combat HIV/AIDS and other diseases
Environmental sustainability
Global partnership for development

Слайд 48Religious: world and national Languages – Chinese – 1,2, Arabic – 422,