- Главная
- Разное
- Дизайн
- Бизнес и предпринимательство
- Аналитика
- Образование
- Развлечения
- Красота и здоровье
- Финансы
- Государство
- Путешествия
- Спорт
- Недвижимость
- Армия
- Графика
- Культурология
- Еда и кулинария
- Лингвистика
- Английский язык
- Астрономия
- Алгебра
- Биология
- География
- Детские презентации
- Информатика
- История
- Литература
- Маркетинг
- Математика
- Медицина
- Менеджмент
- Музыка
- МХК
- Немецкий язык
- ОБЖ
- Обществознание
- Окружающий мир
- Педагогика
- Русский язык
- Технология
- Физика
- Философия
- Химия
- Шаблоны, картинки для презентаций
- Экология
- Экономика
- Юриспруденция
How are different types of maps distinguished? презентация
Содержание
- 2. How are different types of maps distinguished?
- 3. Political Maps Usually colored by country or
- 4. World Political Map
- 5. Physical Map Has colors that make natural
- 6. World Physical Map
- 7. Climate Map The climate of a place
- 8. World Climate Map
- 9. Land Use Resource Map These maps show
- 13. Contour maps Contour lines represent the
- 14. Contour map
- 15. Elevation Maps Maps that show elevation change by using color or shading.
- 16. What is the average elevation of most of our state? Elevation Map
- 17. Elevation Map of Tennessee
- 18. Elevation Map
- 19. Elevation Map
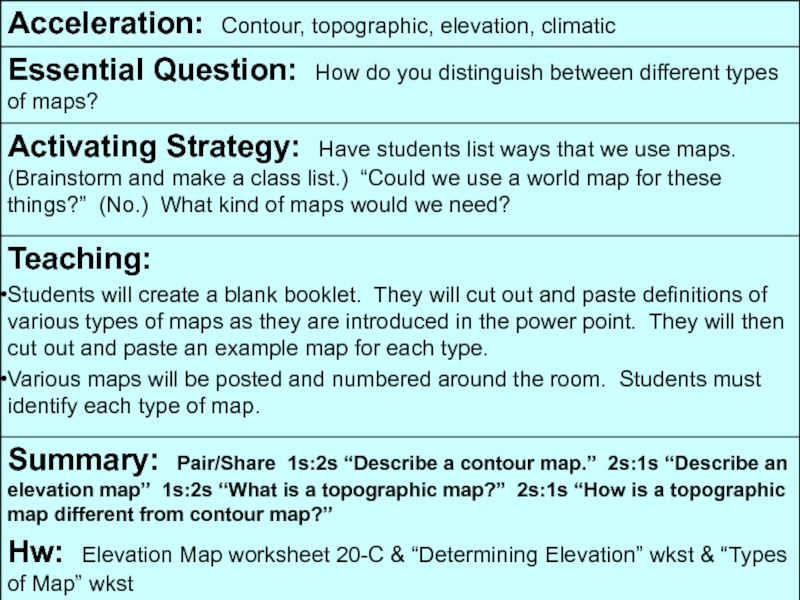
- 20. Topographic Map These maps generally represent a
- 21. Topographic Map
- 22. http://www.tasagraphicarts.com/activities/profile.html
- 23. Types of Maps This map represents a

Слайд 3Political Maps
Usually colored by country or by state
Political colors make it
easy to compare size, shape, and location
Bold letters often make the country names stand out
Symbols make it easy to tell capitals from other cities
Political maps also name certain physical features, such as rivers and lakes
Bold letters often make the country names stand out
Symbols make it easy to tell capitals from other cities
Political maps also name certain physical features, such as rivers and lakes


Слайд 5Physical Map
Has colors that make natural patterns stand out
The colors on
the map can stand for types of vegetation, mountain, and natural features
Names of big natural features are easy to see
Physical maps also include some political information, such as boundaries
Names of big natural features are easy to see
Physical maps also include some political information, such as boundaries


Слайд 7Climate Map
The climate of a place is the weather it has
season by season, year after year
Rainfall and temperature are climate’s main ingredients
Climate is affected by elevation, distance from the ocean, and latitude
Rainfall and temperature are climate’s main ingredients
Climate is affected by elevation, distance from the ocean, and latitude


Слайд 9Land Use Resource Map
These maps show how land is being used.
This might refer to:
vegetation
crops being grown
forest vs. Agriculture
mines and wells
city zoning.
vegetation
crops being grown
forest vs. Agriculture
mines and wells
city zoning.


Слайд 13Contour maps
Contour lines represent the
elevation at that line. If you
were to walk across a line, you
are changing elevation.


Слайд 20Topographic Map
These maps generally represent a small area with a lot
of detail. They show elevation with contour lines, natural and man-made features.


Слайд 23Types of Maps
This map represents a small area with lots of
detail. It has contour lines as well as natural and man-made features. _______________
This map uses colors to show height above sea level. ____________________________
These colorful maps show lines that people use to divide countries and states. They also show major cities. _____________________
These maps show physical features on the Earth like rivers, mountains, and deserts. ____________________________
These maps show how land is being used. For example, they might show which crops are being grown or what animals are being raised. __________________________
These maps show climate regions. ___________________