- Главная
- Разное
- Дизайн
- Бизнес и предпринимательство
- Аналитика
- Образование
- Развлечения
- Красота и здоровье
- Финансы
- Государство
- Путешествия
- Спорт
- Недвижимость
- Армия
- Графика
- Культурология
- Еда и кулинария
- Лингвистика
- Английский язык
- Астрономия
- Алгебра
- Биология
- География
- Детские презентации
- Информатика
- История
- Литература
- Маркетинг
- Математика
- Медицина
- Менеджмент
- Музыка
- МХК
- Немецкий язык
- ОБЖ
- Обществознание
- Окружающий мир
- Педагогика
- Русский язык
- Технология
- Физика
- Философия
- Химия
- Шаблоны, картинки для презентаций
- Экология
- Экономика
- Юриспруденция
Geographical investigations – student guide: extreme weather презентация
Содержание
- 1. Geographical investigations – student guide: extreme weather
- 2. Overview Requirements of the specification What is
- 3. 1. Overview Unit 2 has four components,
- 4. UNIT 2 – Assessment overview and structure
- 5. What do we mean by extreme weather?
- 6. Extreme weather at Malham Tarn (Source: Field
- 7. There are various types of extreme weather
- 8. How can extreme weather events be
- 9. Is extreme weather getting worse? This
- 10. Global deaths from weather-related hazard events (1997-2007)
- 11. Warm front - when a warm moist
- 12. Deep depressions – possible impacts High winds
- 13. Winter and summer anticyclones Winter smog forms
- 14. Risks associated with hurricanes Hurricanes are predictable
- 15. There are other types of extreme weather
- 16. Thinking about fieldwork and research When preparing
- 17. Auditing the specification for extreme weather The
- 18. How show I go about a weather
- 19. Recording the weather twice per day for
- 20. Investigating Flood impacts? Example questionnaire to look
- 21. Flood impacts spreadsheet, interviews and research
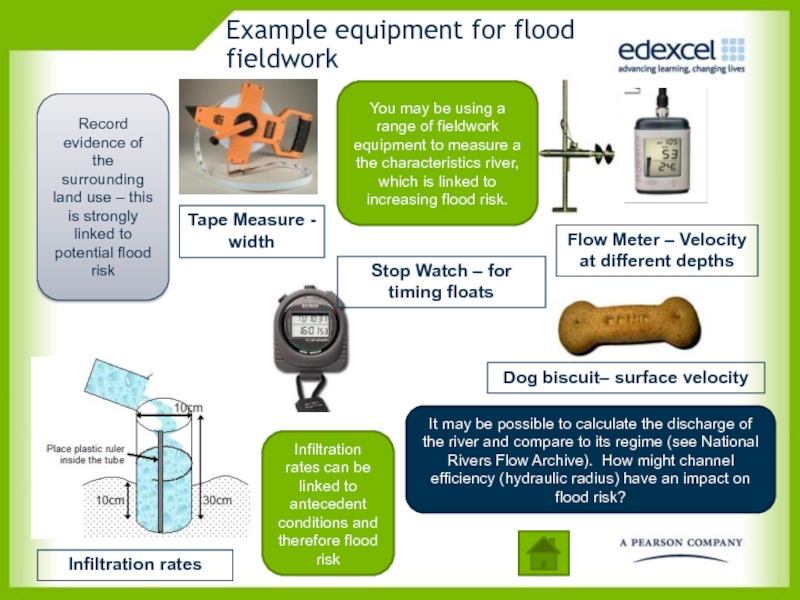
- 22. Dog biscuit– surface velocity Infiltration rates Flow
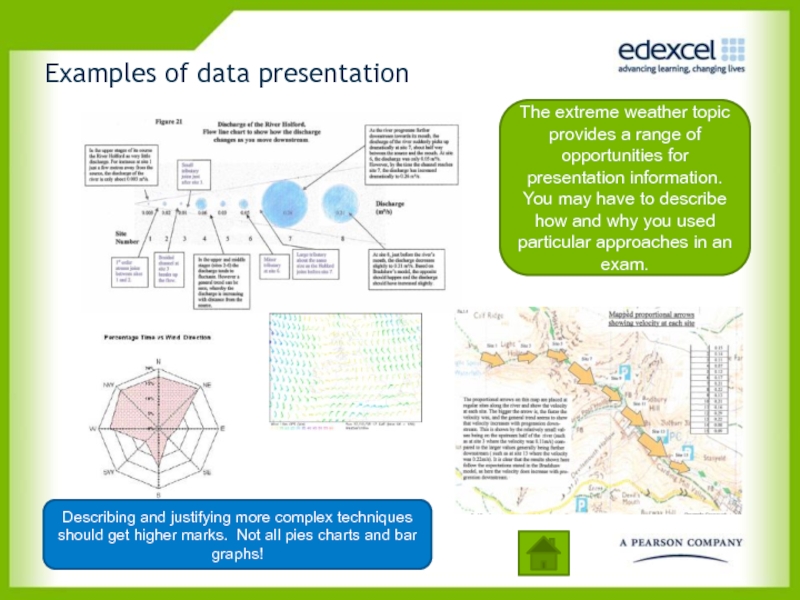
- 23. Examples of data presentation The extreme weather
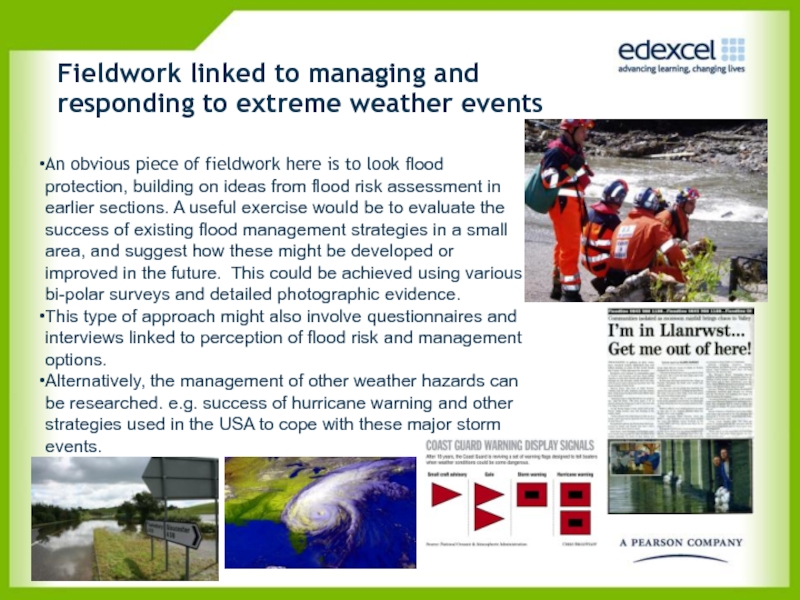
- 24. Fieldwork linked to managing and responding to
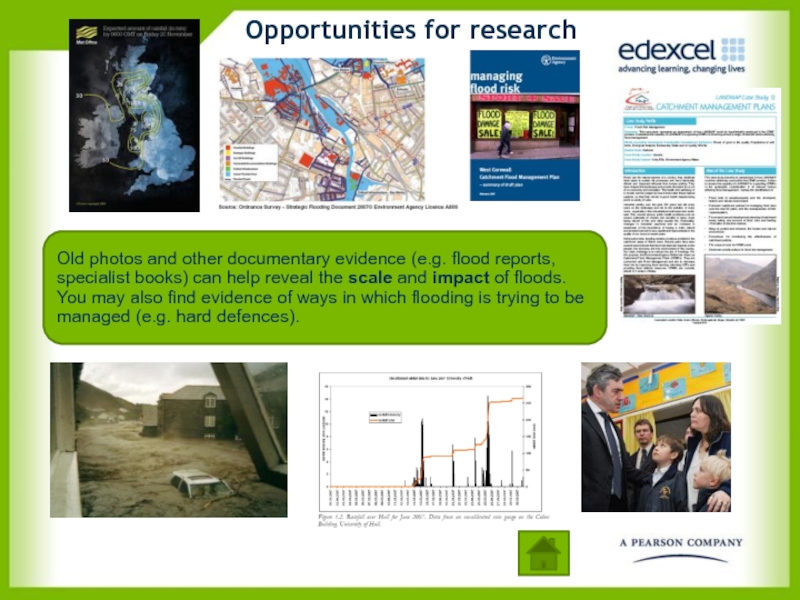
- 25. Old photos and other documentary evidence (e.g.
- 26. Witness accounts and blogs The impacts of
- 27. Following-up the weather fieldwork?
- 28. Summary Revise your personal fieldwork and
Слайд 2Overview
Requirements of the specification
What is extreme weather?
Investigating extreme weather
Ideas for fieldwork
Research
Making it work for the exam
CONTENTS
Click on the information icon to jump to that section.
Click on the home button to return to this contents page
Слайд 31. Overview
Unit 2 has four components, but you are only required
In the 75 minute exam you answer one question based on your two chosen topic areas. This means there is no choice.
This exam is designed to test both knowledge and understanding of geographical concepts as well as geographical skills.
Fieldwork, research and the enquiry process lie at the heart of this exam.
The most important ways of ensuring the highest possible grades in this module is (i) being able to focus on the question set, (ii) to be able to use resources effectively, and (iii) to get your fieldwork in a form that works for the exam.
UNIT 2: The Paired Options –you only study one in each pair!
The ‘Physical’ Pair
Extreme Weather
Crowded Coasts
The ‘Human’ Pair
Unequal Spaces
Rebranding
Слайд 4UNIT 2 – Assessment overview and structure
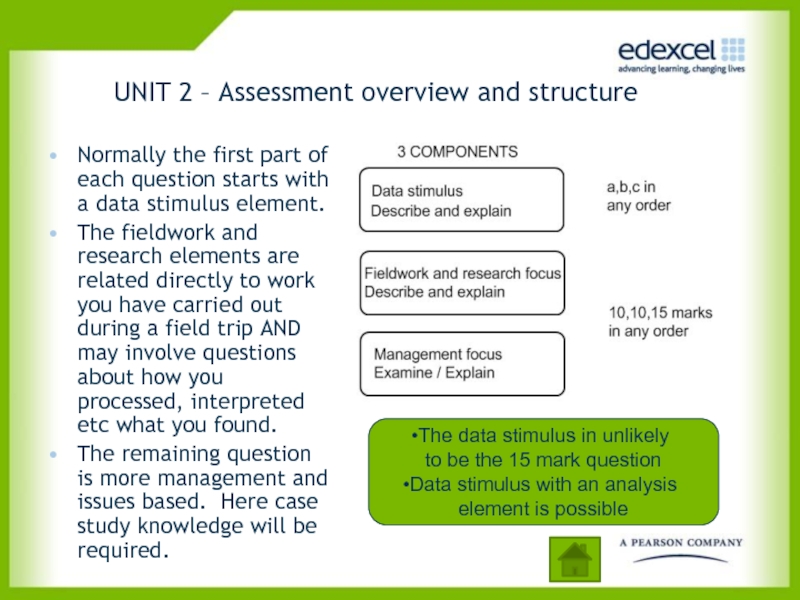
Normally the first part of
The fieldwork and research elements are related directly to work you have carried out during a field trip AND may involve questions about how you processed, interpreted etc what you found.
The remaining question is more management and issues based. Here case study knowledge will be required.
The data stimulus in unlikely
to be the 15 mark question
Data stimulus with an analysis
element is possible
Слайд 5What do we mean by extreme weather?
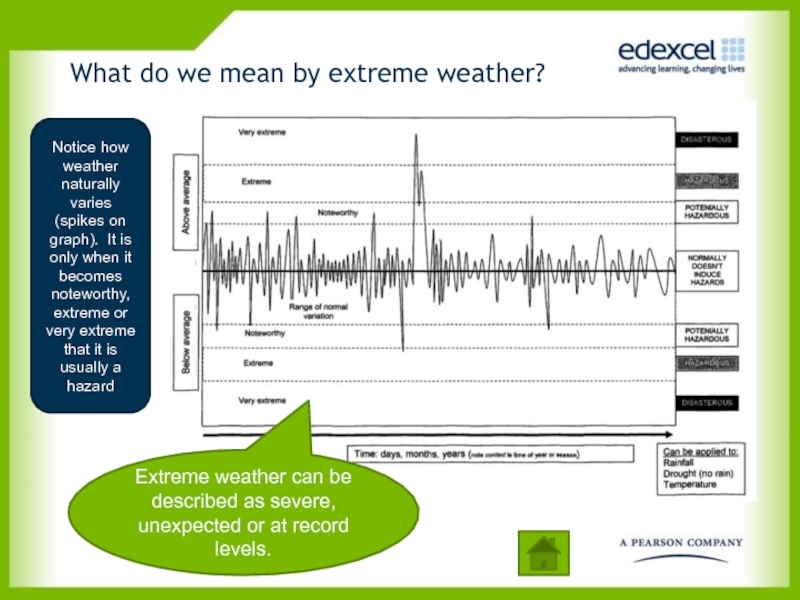
Extreme weather can be described
Notice how weather naturally varies (spikes on graph). It is only when it becomes noteworthy, extreme or very extreme that it is usually a hazard
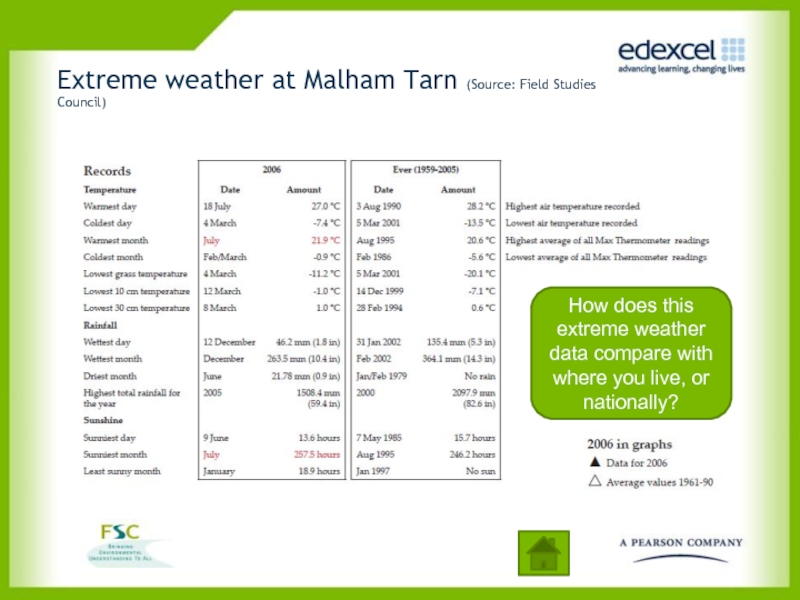
Слайд 6Extreme weather at Malham Tarn (Source: Field Studies Council)
How does this
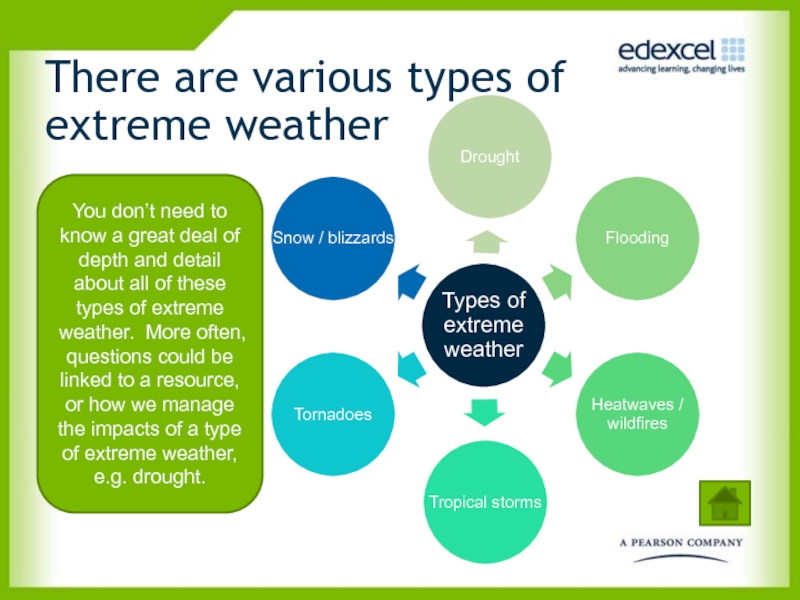
Слайд 7There are various types of extreme weather
You don’t need to know
Слайд 8How can extreme weather events
be classified?
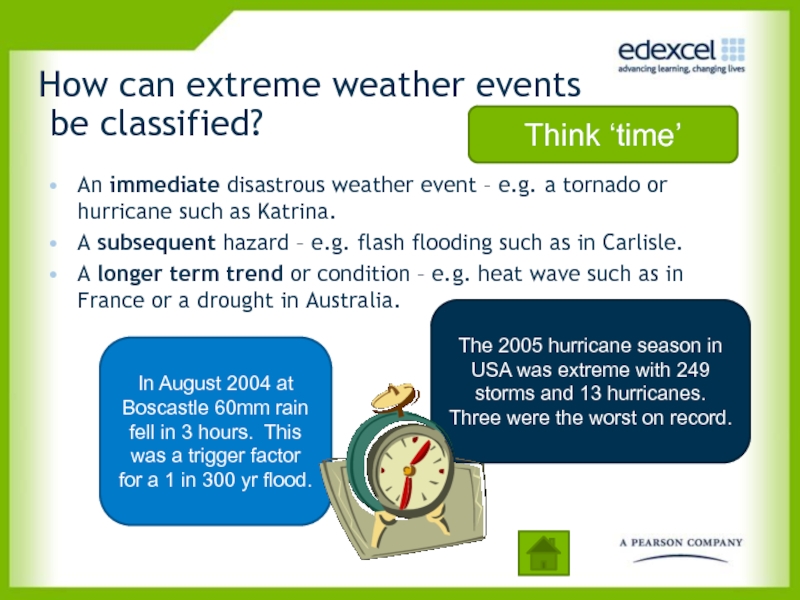
An immediate disastrous weather event
A subsequent hazard – e.g. flash flooding such as in Carlisle.
A longer term trend or condition – e.g. heat wave such as in France or a drought in Australia.
Think ‘time’
The 2005 hurricane season in USA was extreme with 249 storms and 13 hurricanes. Three were the worst on record.
In August 2004 at Boscastle 60mm rain fell in 3 hours. This was a trigger factor for a 1 in 300 yr flood.
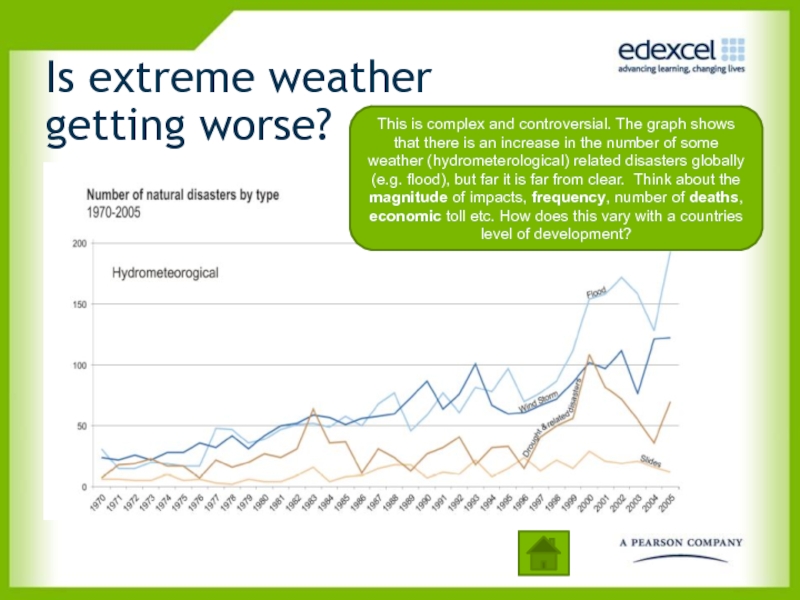
Слайд 9Is extreme weather getting worse?
This is complex and controversial. The graph
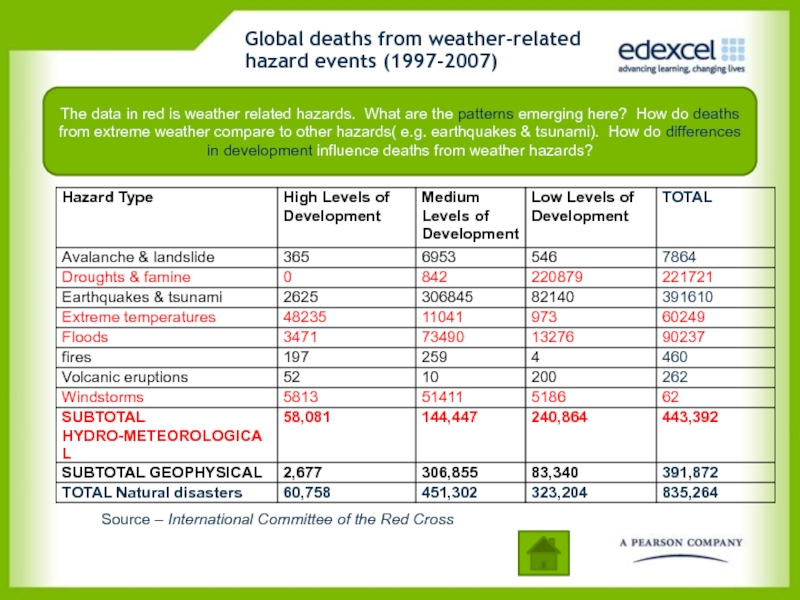
Слайд 10Global deaths from weather-related hazard events (1997-2007)
The data in red is
Source – International Committee of the Red Cross
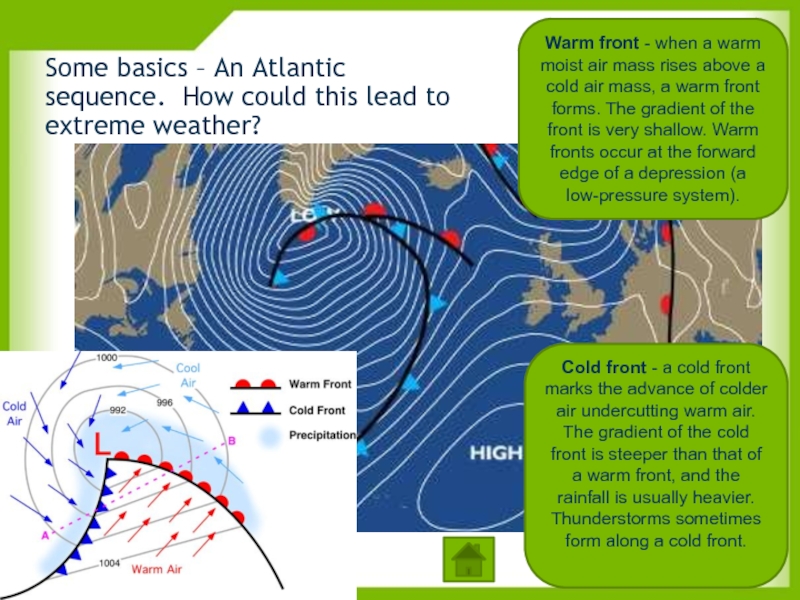
Слайд 11Warm front - when a warm moist air mass rises above
Cold front - a cold front marks the advance of colder air undercutting warm air. The gradient of the cold front is steeper than that of a warm front, and the rainfall is usually heavier. Thunderstorms sometimes form along a cold front.
Some basics – An Atlantic sequence. How could this lead to extreme weather?
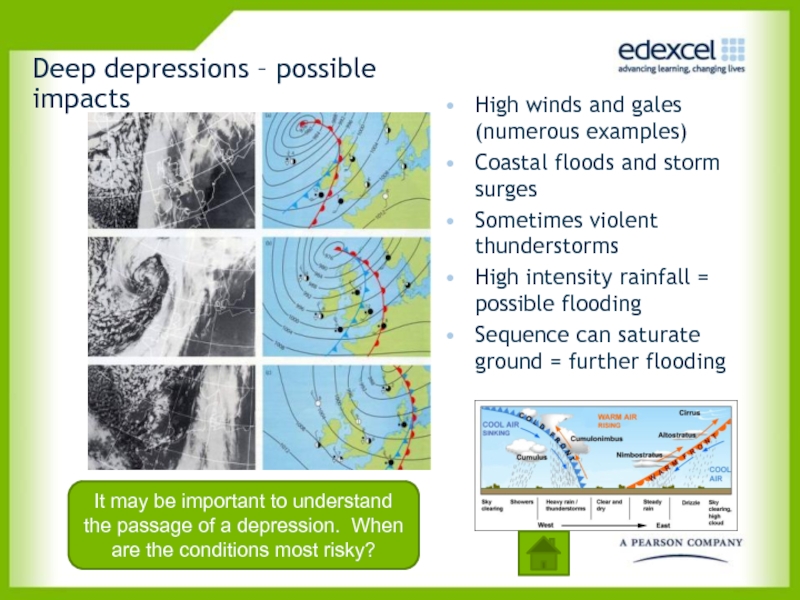
Слайд 12Deep depressions – possible impacts
High winds and gales (numerous examples)
Coastal floods
Sometimes violent thunderstorms
High intensity rainfall = possible flooding
Sequence can saturate ground = further flooding
It may be important to understand the passage of a depression. When are the conditions most risky?
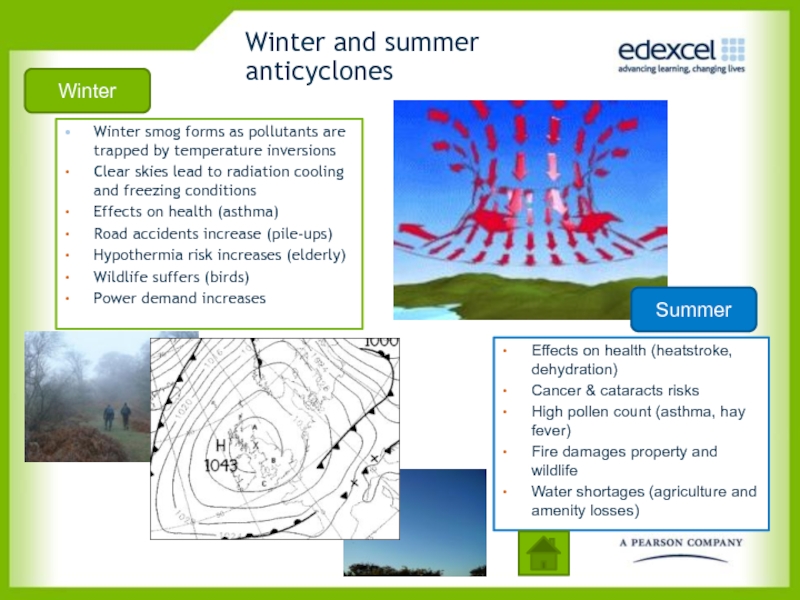
Слайд 13Winter and summer anticyclones
Winter smog forms as pollutants are trapped by
Clear skies lead to radiation cooling and freezing conditions
Effects on health (asthma)
Road accidents increase (pile-ups)
Hypothermia risk increases (elderly)
Wildlife suffers (birds)
Power demand increases
Effects on health (heatstroke, dehydration)
Cancer & cataracts risks
High pollen count (asthma, hay fever)
Fire damages property and wildlife
Water shortages (agriculture and amenity losses)
Summer
Winter
Слайд 14Risks associated with hurricanes
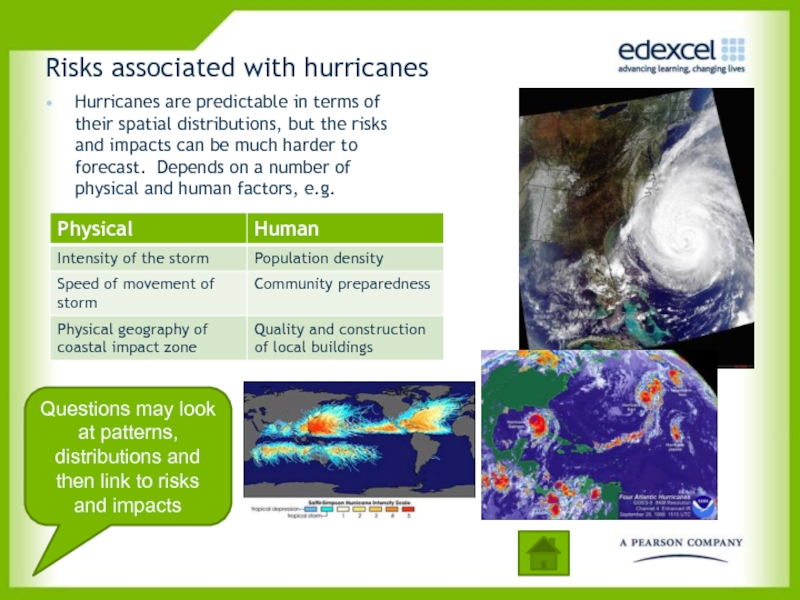
Hurricanes are predictable in terms of their spatial
Questions may look at patterns, distributions and then link to risks and impacts
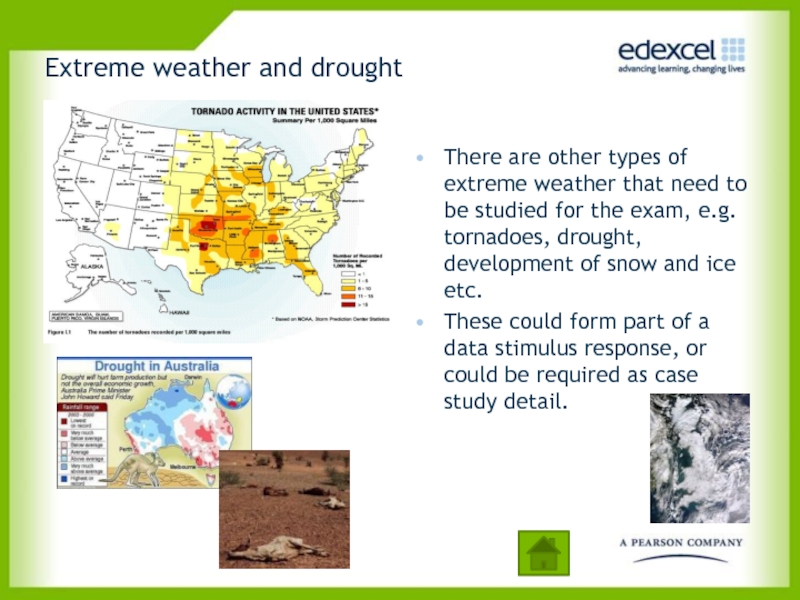
Слайд 15There are other types of extreme weather that need to be
These could form part of a data stimulus response, or could be required as case study detail.
Extreme weather and drought
Слайд 16Thinking about fieldwork and research
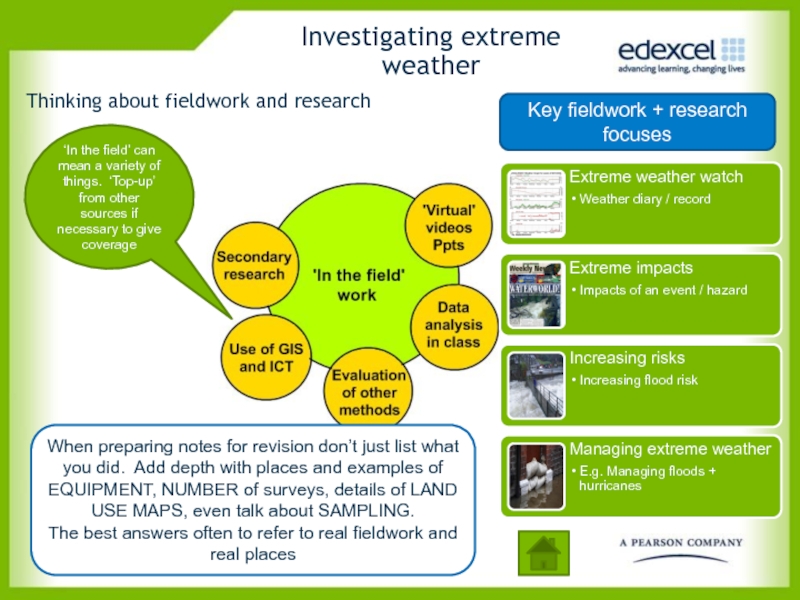
When preparing notes for revision don’t just
The best answers often to refer to real fieldwork and real places
Key fieldwork + research focuses
‘In the field’ can mean a variety of things. ‘Top-up’ from other sources if necessary to give coverage
Investigating extreme weather
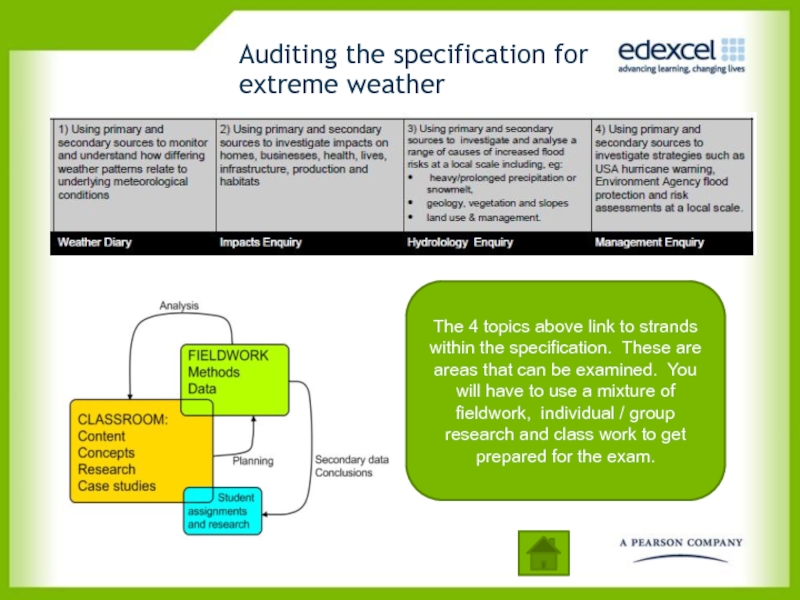
Слайд 17Auditing the specification for extreme weather
The 4 topics above link to
Слайд 18How show I go about a weather diary?
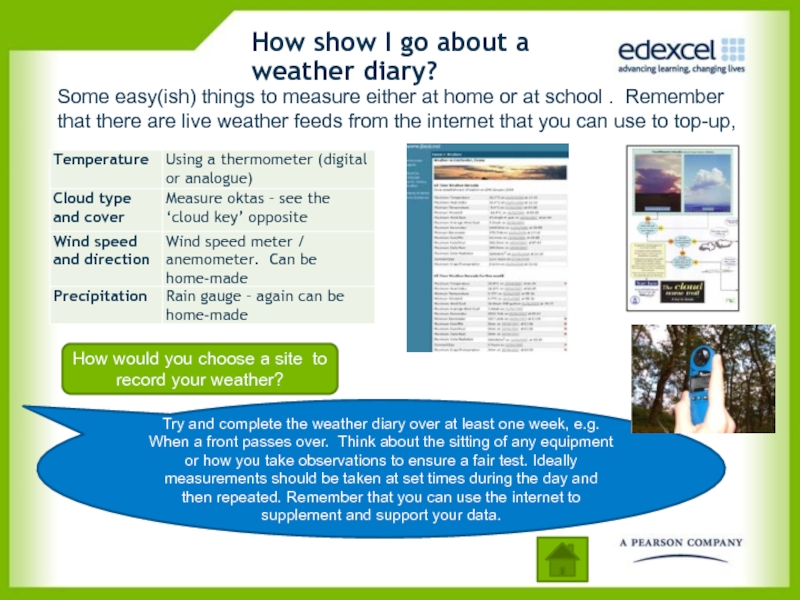
Try and complete the
Some easy(ish) things to measure either at home or at school . Remember that there are live weather feeds from the internet that you can use to top-up,
How would you choose a site to record your weather?
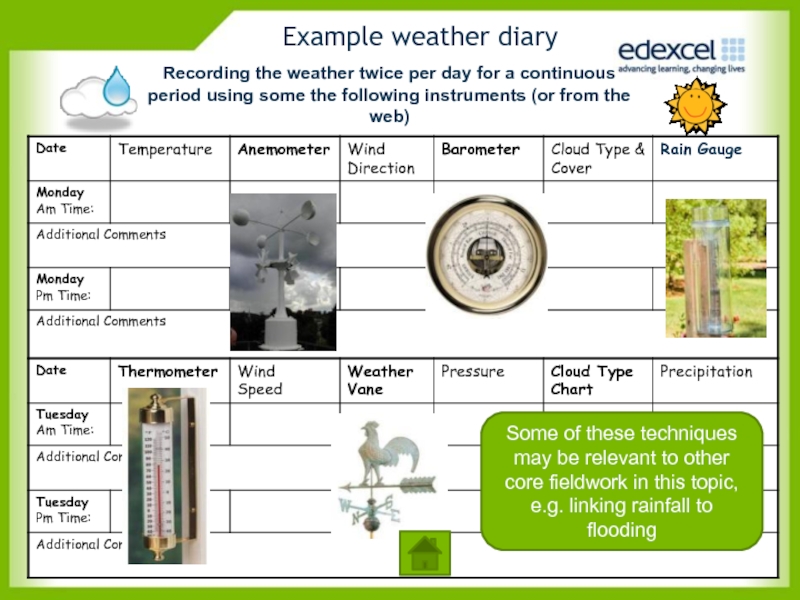
Слайд 19Recording the weather twice per day for a continuous period using
Example weather diary
Some of these techniques may be relevant to other core fieldwork in this topic, e.g. linking rainfall to flooding
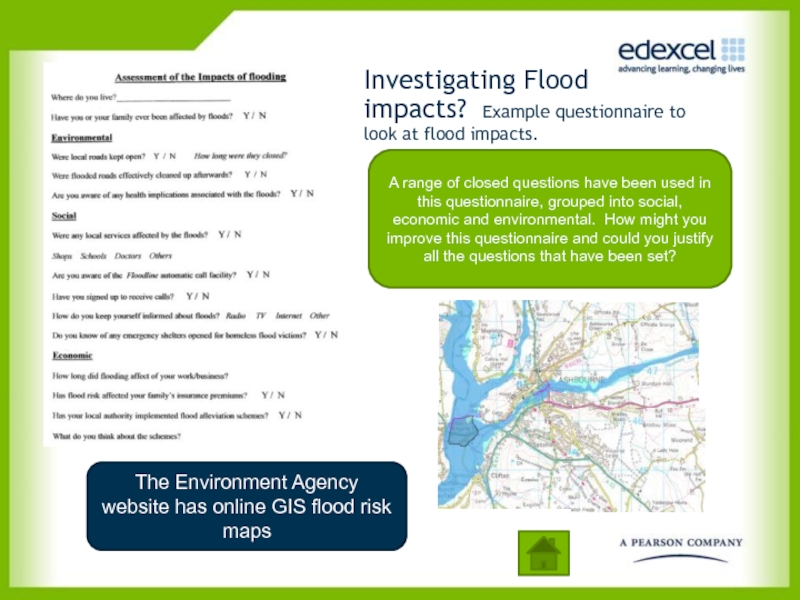
Слайд 20Investigating Flood impacts? Example questionnaire to look at flood impacts.
A range
The Environment Agency website has online GIS flood risk maps
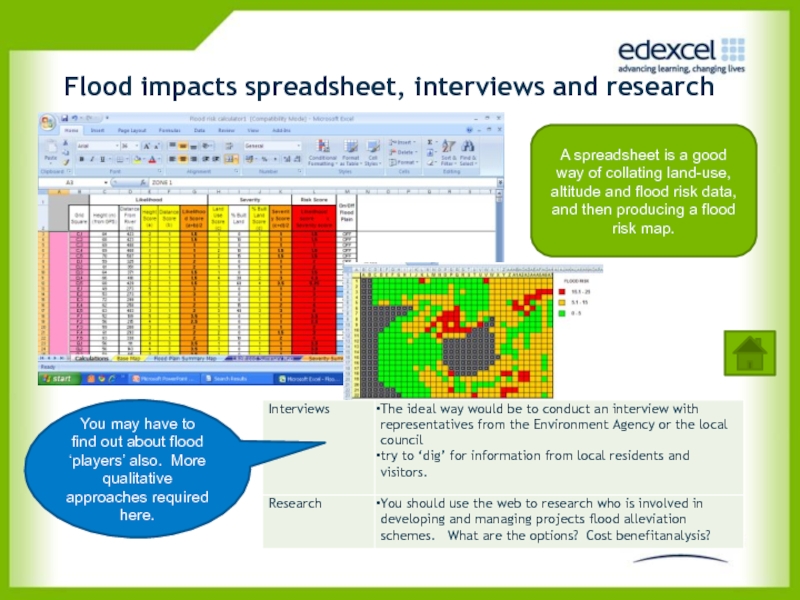
Слайд 21Flood impacts spreadsheet, interviews and research
You may have to find
A spreadsheet is a good way of collating land-use, altitude and flood risk data, and then producing a flood risk map.
Слайд 22Dog biscuit– surface velocity
Infiltration rates
Flow Meter – Velocity at different depths
Stop
Tape Measure - width
Example equipment for flood fieldwork
You may be using a range of fieldwork equipment to measure a the characteristics river, which is linked to increasing flood risk.
It may be possible to calculate the discharge of the river and compare to its regime (see National Rivers Flow Archive). How might channel efficiency (hydraulic radius) have an impact on flood risk?
Infiltration rates can be linked to antecedent conditions and therefore flood risk
Record evidence of the surrounding land use – this is strongly linked to potential flood risk
Слайд 23Examples of data presentation
The extreme weather topic provides a range of
Describing and justifying more complex techniques should get higher marks. Not all pies charts and bar graphs!
Слайд 24Fieldwork linked to managing and responding to extreme weather events
An obvious
This type of approach might also involve questionnaires and interviews linked to perception of flood risk and management options.
Alternatively, the management of other weather hazards can be researched. e.g. success of hurricane warning and other strategies used in the USA to cope with these major storm events.
Слайд 25Old photos and other documentary evidence (e.g. flood reports, specialist books)
Opportunities for research
Слайд 26Witness accounts and blogs
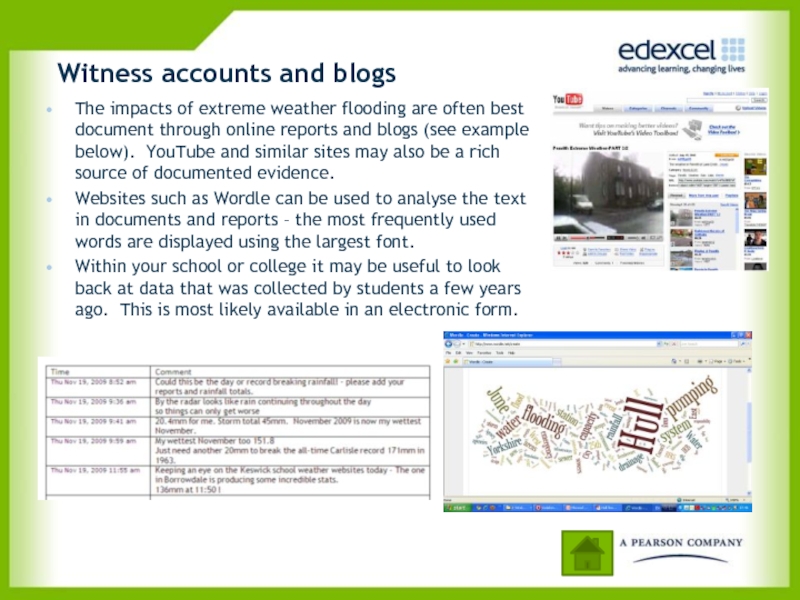
The impacts of extreme weather flooding are often
Websites such as Wordle can be used to analyse the text in documents and reports – the most frequently used words are displayed using the largest font.
Within your school or college it may be useful to look back at data that was collected by students a few years ago. This is most likely available in an electronic form.
Слайд 28Summary
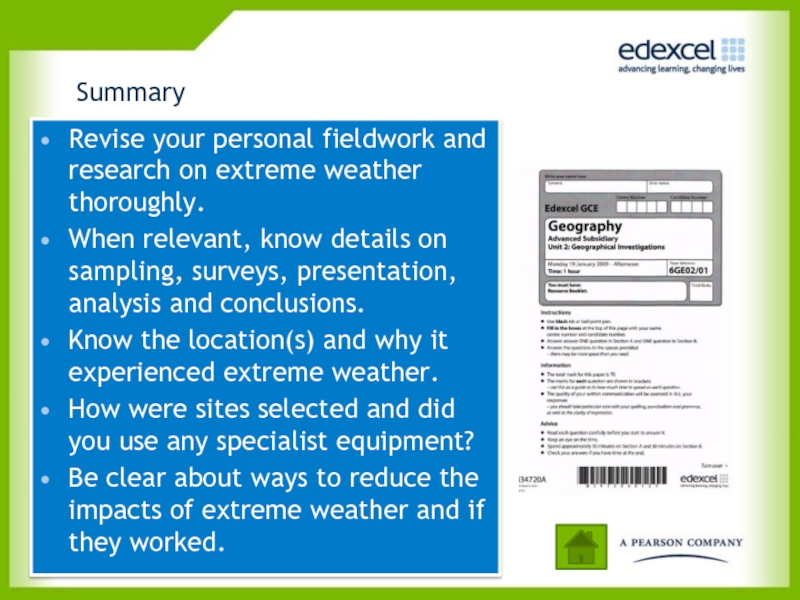
Revise your personal fieldwork and research on extreme weather thoroughly.
When relevant, know details on sampling, surveys, presentation, analysis and conclusions.
Know the location(s) and why it experienced extreme weather.
How were sites selected and did you use any specialist equipment?
Be clear about ways to reduce the impacts of extreme weather and if they worked.
