- Главная
- Разное
- Дизайн
- Бизнес и предпринимательство
- Аналитика
- Образование
- Развлечения
- Красота и здоровье
- Финансы
- Государство
- Путешествия
- Спорт
- Недвижимость
- Армия
- Графика
- Культурология
- Еда и кулинария
- Лингвистика
- Английский язык
- Астрономия
- Алгебра
- Биология
- География
- Детские презентации
- Информатика
- История
- Литература
- Маркетинг
- Математика
- Медицина
- Менеджмент
- Музыка
- МХК
- Немецкий язык
- ОБЖ
- Обществознание
- Окружающий мир
- Педагогика
- Русский язык
- Технология
- Физика
- Философия
- Химия
- Шаблоны, картинки для презентаций
- Экология
- Экономика
- Юриспруденция
Sensors and actuators презентация
Содержание
- 1. Sensors and actuators
- 2. Sensors and Transducers (definition) Pr. Nazim Mir-Nasiri
- 3. Sensors performance terminology and specifications Pr. Nazim
- 4. Sensors performance terminology and specifications Pr. Nazim
- 5. Sensors performance terminology and specifications Pr. Nazim
- 6. Sensors performance terminology and specifications Pr. Nazim
- 7. Sensors performance terminology and specifications Pr. Nazim
- 8. Sensors performance terminology and specifications Pr. Nazim
- 9. Sensors performance terminology and specifications Pr. Nazim
- 10. Sensors performance terminology and specifications Pr. Nazim
- 11. Sensors performance terminology and specifications Pr. Nazim
- 12. Sensors performance terminology and specifications Pr. Nazim
- 13. Sensors performance terminology and specifications Pr. Nazim
- 14. Sensors performance terminology and specifications Pr. Nazim
- 15. Sensors performance terminology and specifications Pr. Nazim
- 16. Sensors performance terminology and specifications Pr. Nazim
- 17. Static and Dynamic Characteristics of Sensors Pr.
- 18. Static and Dynamic Characteristics of Sensors Pr.
- 19. Static and Dynamic Characteristics of Sensors Pr.
- 20. Static and Dynamic Characteristics of Sensors Pr.
- 21. Static and Dynamic Characteristics of Sensors Pr.
- 22. THANK YOU
Слайд 2Sensors and Transducers
(definition)
Pr. Nazim Mir-Nasiri
Sensors are used for an element
Transducers are defined as elements that when subject to some physical change experience a related change
Sensors are transducers
Слайд 3Sensors performance terminology and specifications
Pr. Nazim Mir-Nasiri
Range and span
Range defines the limits between which the input can vary
Span is the maximum value of the input minus the minimum
value. Example, a load cell for the measurement of forces might have a range of 0 to 50 kN and span of 50 kN
2. Error is the difference between the results of the measurement and the true value of the quantity being measured
Error= measured value – true value
Example, if the measured temperature is 25°C when the actual
is 24°, then the error is +1°C. Instead if the measured value
was 26°, then the error should be -1°
Слайд 4Sensors performance terminology and specifications
Pr. Nazim Mir-Nasiri
Accuracy is the extend
measurement system might be wrong. In other words, it is the
summation of all the possible errors that are likely to occur
Example, the temperature – measuring instrument may be
specified as having an accuracy of ± 2°C of the true value . It
means that the reading given by the instrument can be
expected to lie within + or – 2°C of the true value
Accuracy is often expressed as a percentage of the full range
output or full-scale deflection
Example, the reading may be specified as having an accuracy
of ± 5% of full range output. Then if the range of the sensor is 0
to 200° the reading given can be expected to be within + or –
10°C of the true reading
Слайд 5Sensors performance terminology and specifications
Pr. Nazim Mir-Nasiri
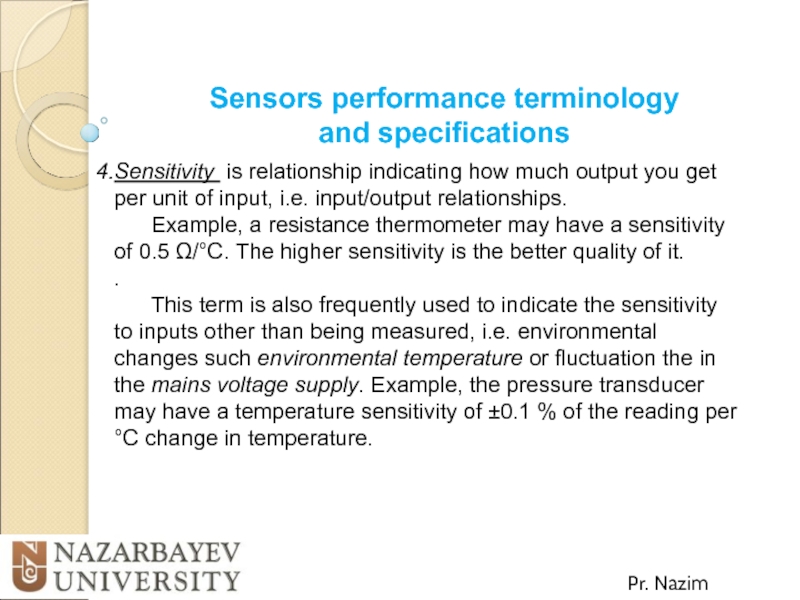
Sensitivity is relationship indicating
Example, a resistance thermometer may have a sensitivity of 0.5 Ω/°C. The higher sensitivity is the better quality of it.
.
This term is also frequently used to indicate the sensitivity to inputs other than being measured, i.e. environmental changes such environmental temperature or fluctuation the in the mains voltage supply. Example, the pressure transducer may have a temperature sensitivity of ±0.1 % of the reading per °C change in temperature.
Слайд 6Sensors performance terminology and specifications
Pr. Nazim Mir-Nasiri
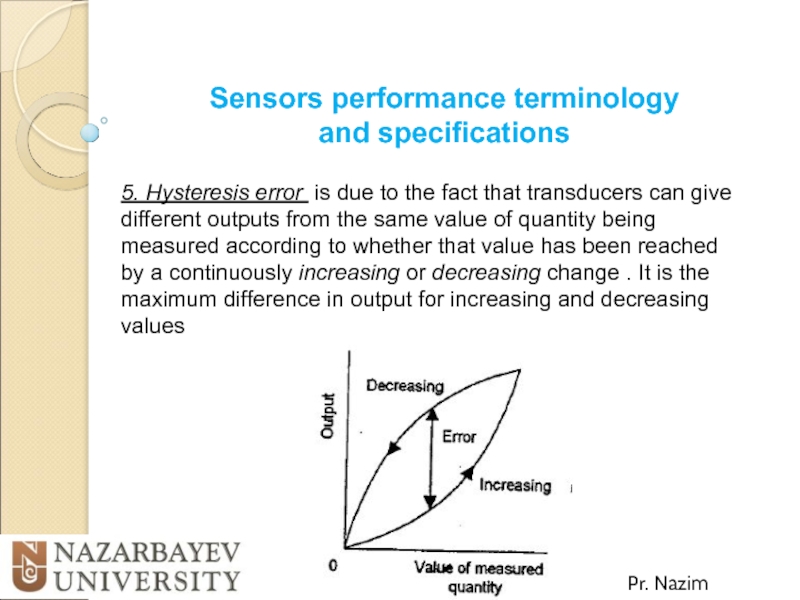
5. Hysteresis error is
Слайд 7Sensors performance terminology and specifications
Pr. Nazim Mir-Nasiri
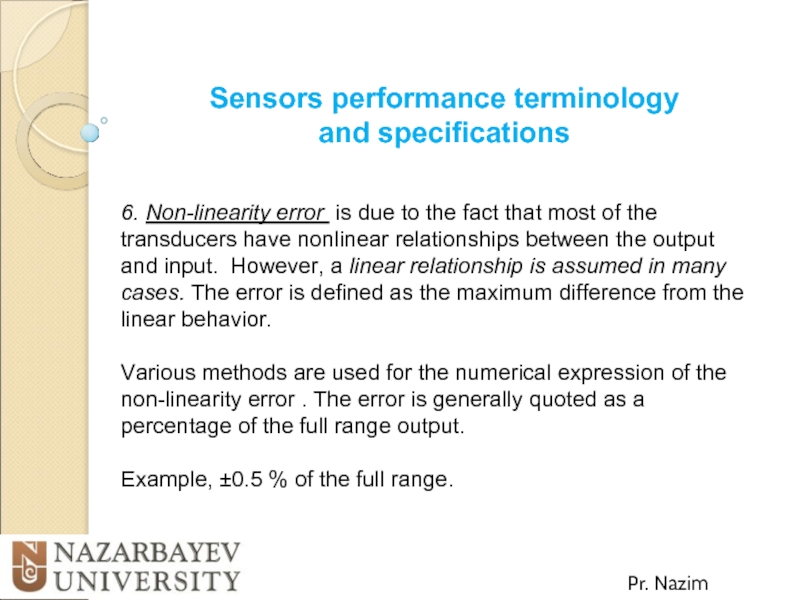
6. Non-linearity error is
Various methods are used for the numerical expression of the non-linearity error . The error is generally quoted as a percentage of the full range output.
Example, ±0.5 % of the full range.
Слайд 8Sensors performance terminology and specifications
Pr. Nazim Mir-Nasiri
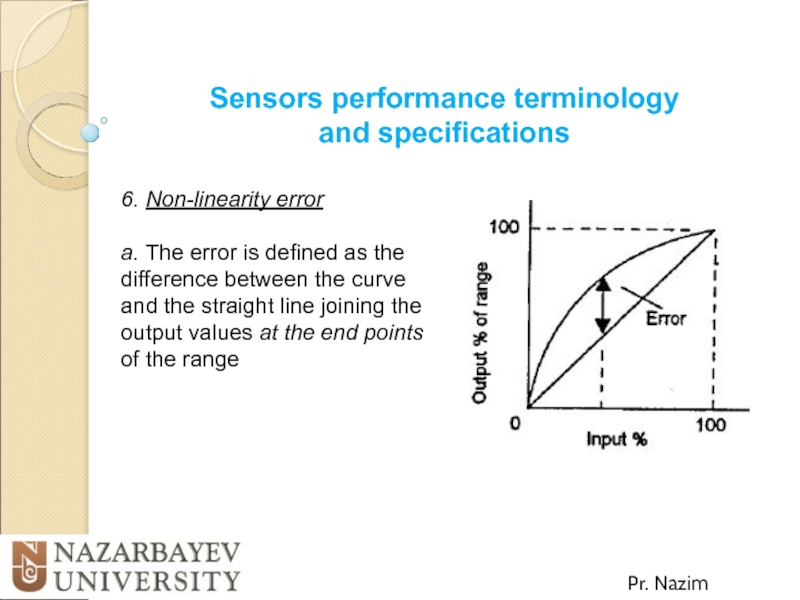
6. Non-linearity error
a. The
Слайд 9Sensors performance terminology and specifications
Pr. Nazim Mir-Nasiri
6. Non-linearity error
b. The
Слайд 10Sensors performance terminology and specifications
Pr. Nazim Mir-Nasiri
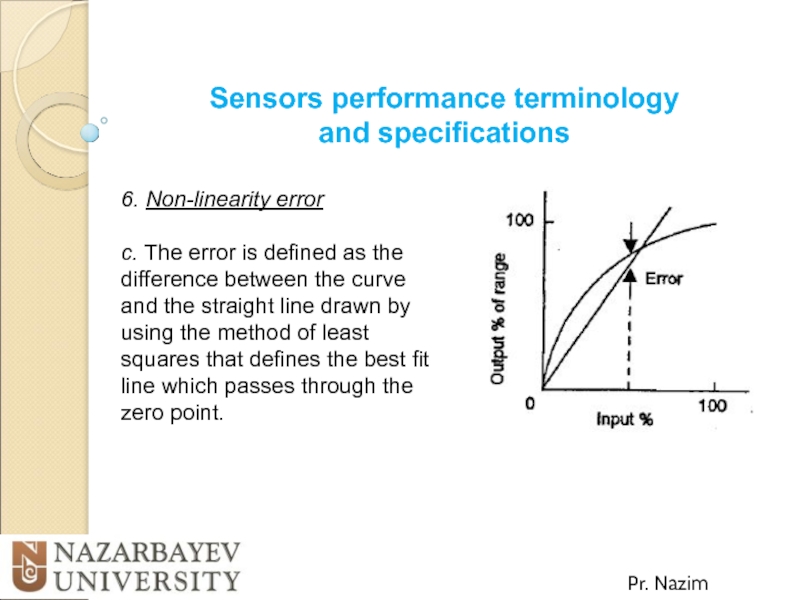
6. Non-linearity error
c. The
Слайд 11Sensors performance terminology and specifications
Pr. Nazim Mir-Nasiri
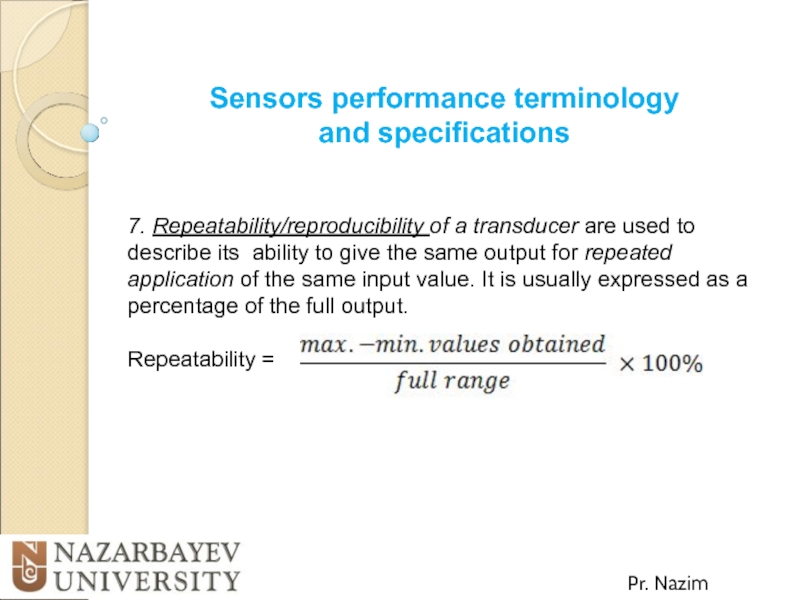
7. Repeatability/reproducibility of a
Repeatability =
Слайд 12Sensors performance terminology and specifications
Pr. Nazim Mir-Nasiri
8. Stability of a
The term drift is often used to describe the change in output that occurs over time. Can be expressed as a percentage of the full range output.
The term zero drift is used for the change that occur in the output when there is zero input.
Слайд 13Sensors performance terminology and specifications
Pr. Nazim Mir-Nasiri
9. Dead band/time of
Example, bearing friction in a flow meter using a rotor might mean that there is no output until the input has reached a particular velocity threshold .
The dead time is the length of time from the application of an input until the output begins to respond and change.
Слайд 14Sensors performance terminology and specifications
Pr. Nazim Mir-Nasiri
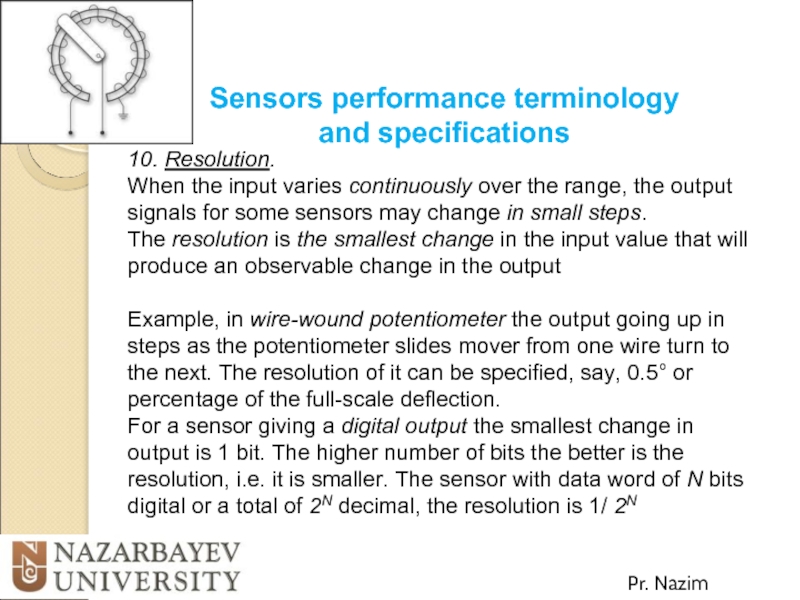
10. Resolution.
When the input
The resolution is the smallest change in the input value that will produce an observable change in the output
Example, in wire-wound potentiometer the output going up in steps as the potentiometer slides mover from one wire turn to the next. The resolution of it can be specified, say, 0.5° or percentage of the full-scale deflection.
For a sensor giving a digital output the smallest change in output is 1 bit. The higher number of bits the better is the resolution, i.e. it is smaller. The sensor with data word of N bits digital or a total of 2N decimal, the resolution is 1/ 2N
Слайд 15Sensors performance terminology and specifications
Pr. Nazim Mir-Nasiri
11. Output impedance
When
The inclusion of the sensor can significantly modify the behavior of the system to which it is connected.
Слайд 16Sensors performance terminology and specifications
Pr. Nazim Mir-Nasiri
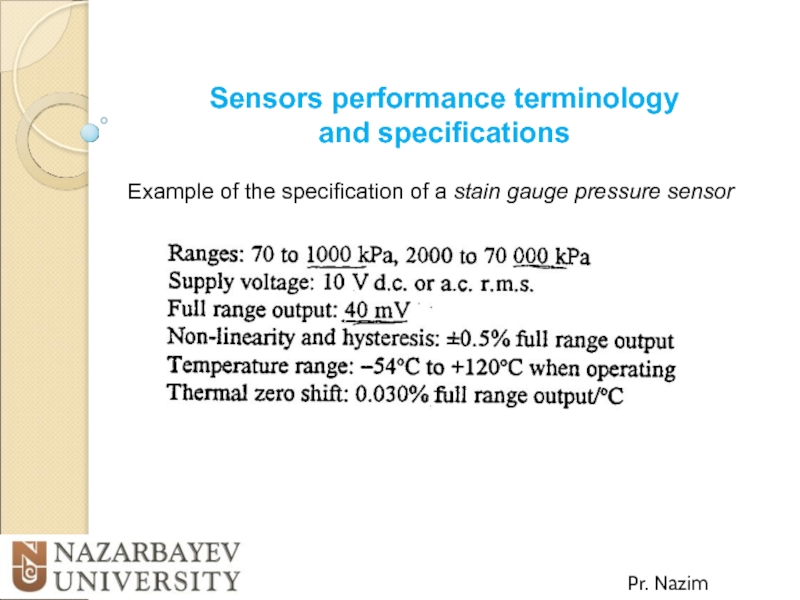
Example of the specification
Слайд 17Static and Dynamic Characteristics of Sensors
Pr. Nazim Mir-Nasiri
The static characteristics
The dynamic characteristics refer to the behavior (or system response) between the time that the input value changes and the time when the output settles down to the steady-state value
Example, the input might be a step input when the input is suddenly changed from 0 to a constant value, or a ramp input when the input is changed at a steady rate, or a sinusoidal input of a specified frequency
Слайд 18Static and Dynamic Characteristics of Sensors
Pr. Nazim Mir-Nasiri
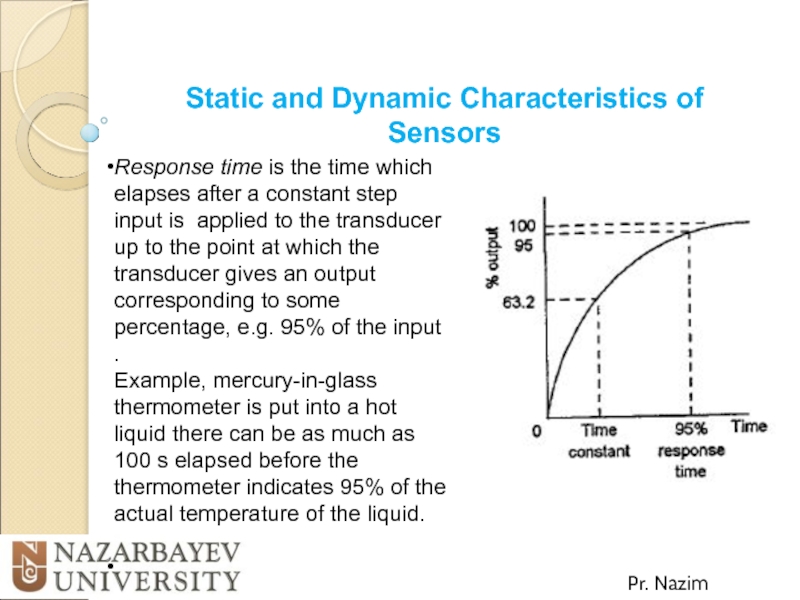
Response time is
Example, mercury-in-glass thermometer is put into a hot liquid there can be as much as 100 s elapsed before the thermometer indicates 95% of the
actual temperature of the liquid.
Слайд 19Static and Dynamic Characteristics of Sensors
Pr. Nazim Mir-Nasiri
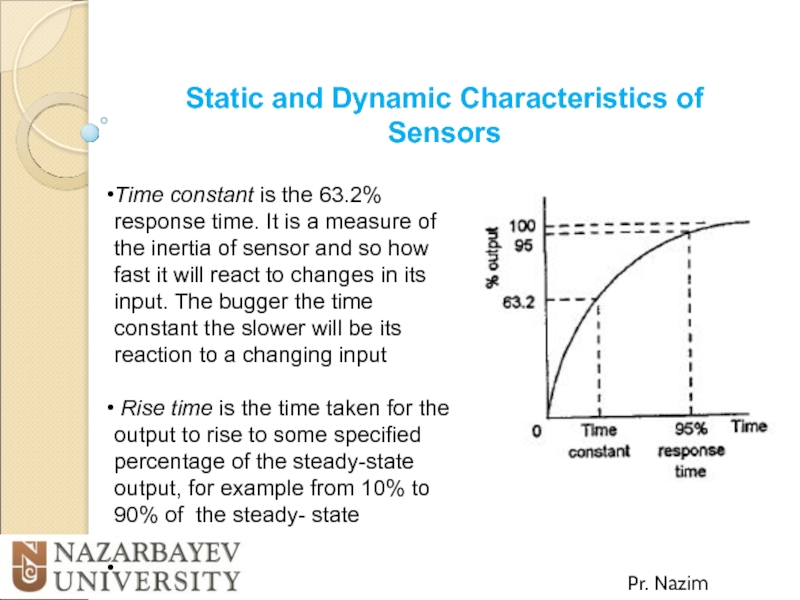
Time constant is
Rise time is the time taken for the output to rise to some specified percentage of the steady-state output, for example from 10% to 90% of the steady- state
Слайд 20Static and Dynamic Characteristics of Sensors
Pr. Nazim Mir-Nasiri
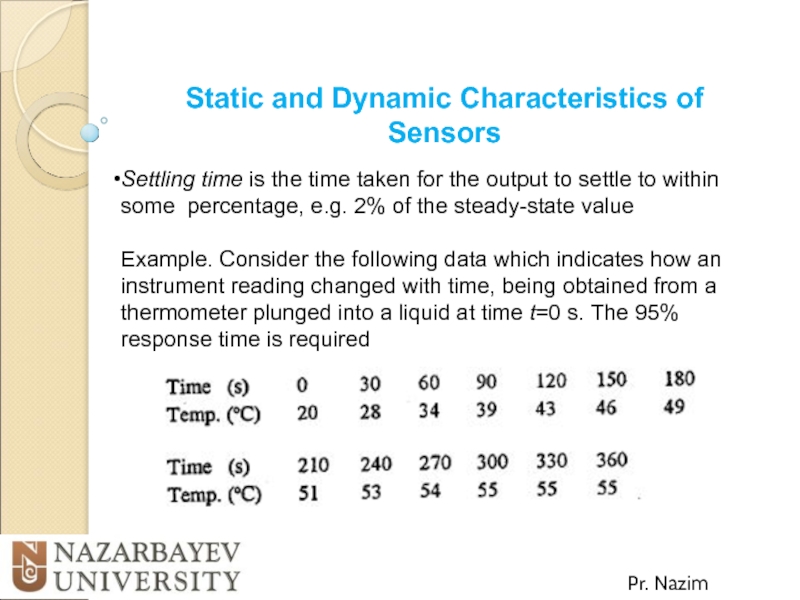
Settling time is
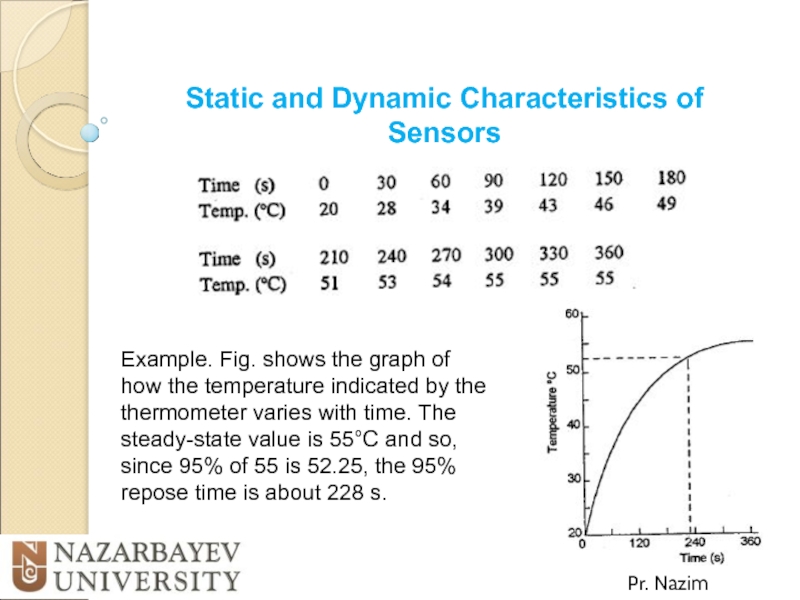
Example. Consider the following data which indicates how an instrument reading changed with time, being obtained from a thermometer plunged into a liquid at time t=0 s. The 95% response time is required
Слайд 21Static and Dynamic Characteristics of Sensors
Pr. Nazim Mir-Nasiri
Example. Fig. shows
