and Power,
Solar Energy Resources
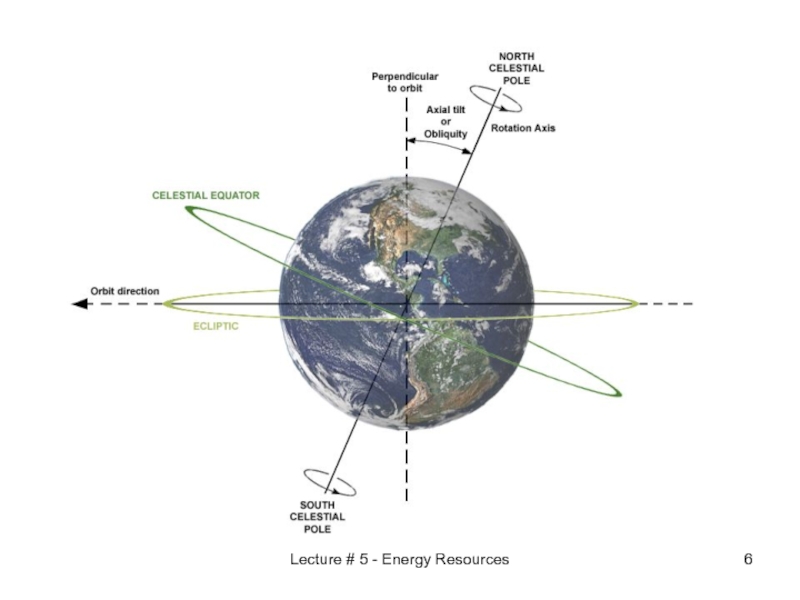
Solar Astronomy
- Главная
- Разное
- Дизайн
- Бизнес и предпринимательство
- Аналитика
- Образование
- Развлечения
- Красота и здоровье
- Финансы
- Государство
- Путешествия
- Спорт
- Недвижимость
- Армия
- Графика
- Культурология
- Еда и кулинария
- Лингвистика
- Английский язык
- Астрономия
- Алгебра
- Биология
- География
- Детские презентации
- Информатика
- История
- Литература
- Маркетинг
- Математика
- Медицина
- Менеджмент
- Музыка
- МХК
- Немецкий язык
- ОБЖ
- Обществознание
- Окружающий мир
- Педагогика
- Русский язык
- Технология
- Физика
- Философия
- Химия
- Шаблоны, картинки для презентаций
- Экология
- Экономика
- Юриспруденция
Energy and power, solar energy resources, solar astronomy. (Lecture 5) презентация
Содержание
- 1. Energy and power, solar energy resources, solar astronomy. (Lecture 5)
- 2. Notion of the Cost per peak watt
- 3. Lecture # 5 - Energy Resources Solar
- 4. Lecture # 5 - Energy Resources Components
- 5. Direct Normal realization Concentration Tracking: DN +
- 6. Lecture # 5 - Energy Resources
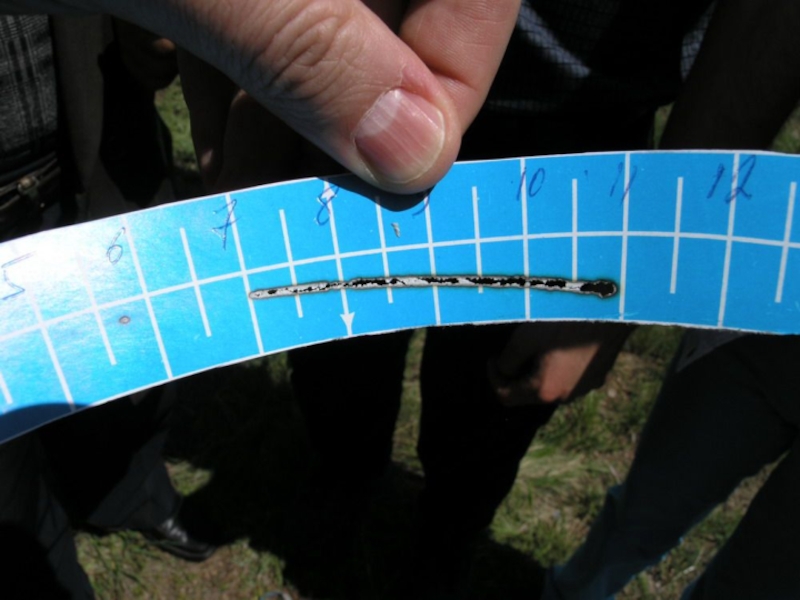
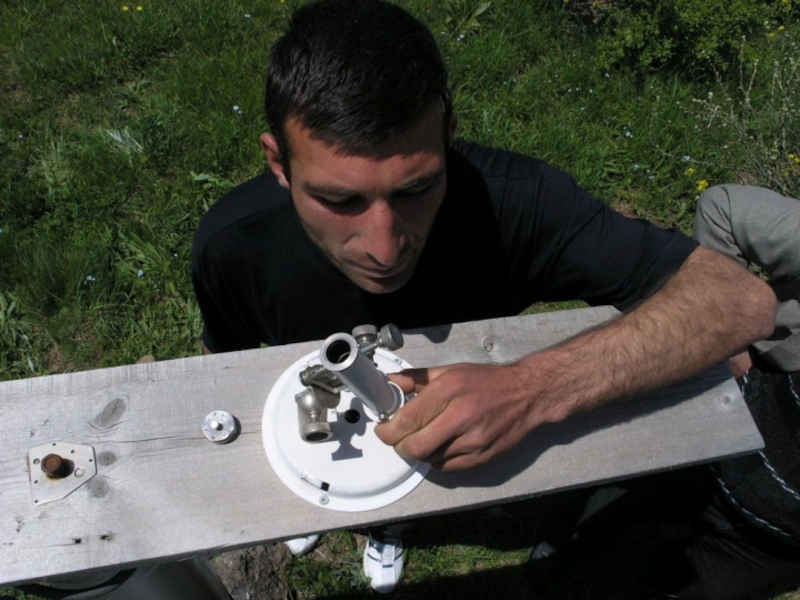
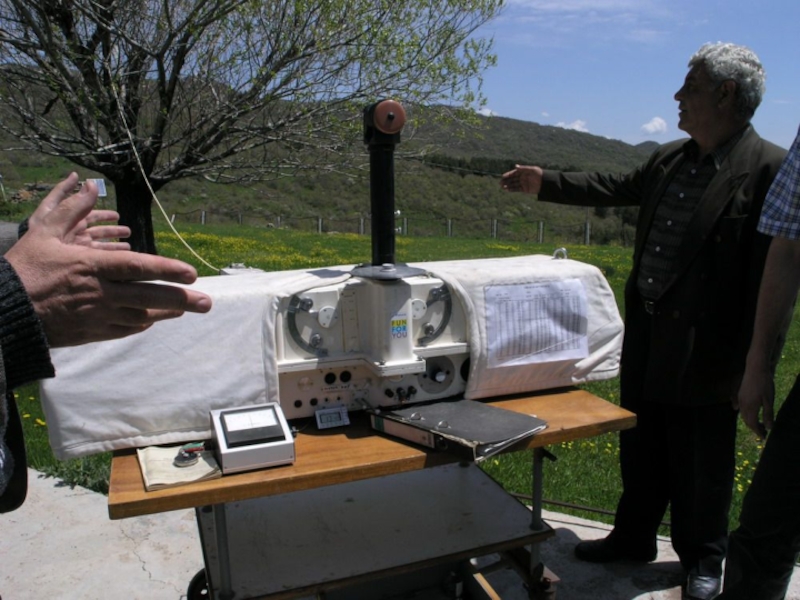
- 7. Lecture # 5 - Energy Resources Solar Monitoring in Armenia – Amberd Meteo Station
- 8. Lecture # 5 - Energy Resources Solar Monitoring in Armenia – Amberd Meteo Station
- 9. Lecture # 5 - Energy Resources Solar Monitoring in Armenia – Amberd Meteo Station
- 10. Lecture # 5 - Energy Resources Solar Monitoring in Armenia – Amberd Meteo Station
- 11. Lecture # 5 - Energy Resources Solar Monitoring in Armenia – Amberd Meteo Station
- 12. Solar position Calculator http://www.spectralcalc.com/solar_calculator/solar_position.php Lecture # 5 - Energy Resources
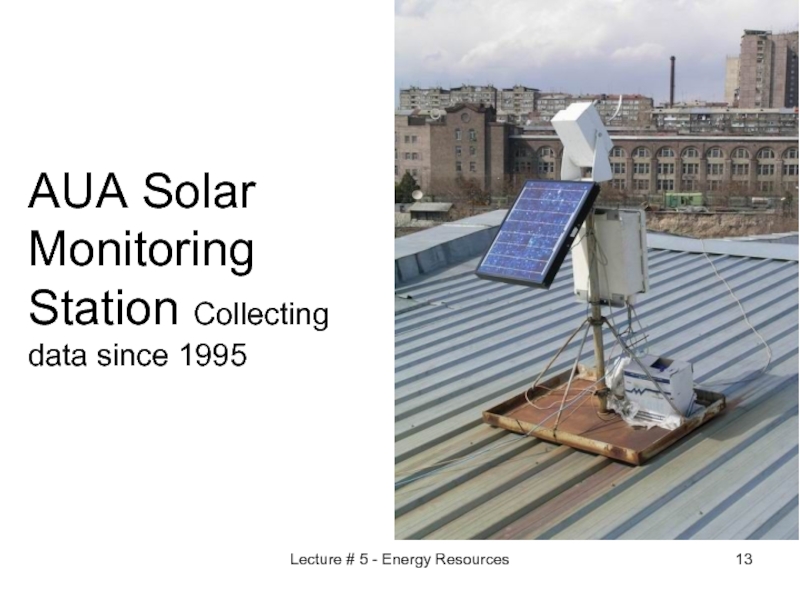
- 13. Lecture # 5 - Energy Resources AUA Solar Monitoring Station Collecting data since 1995
- 14. Lecture # 5 - Energy Resources
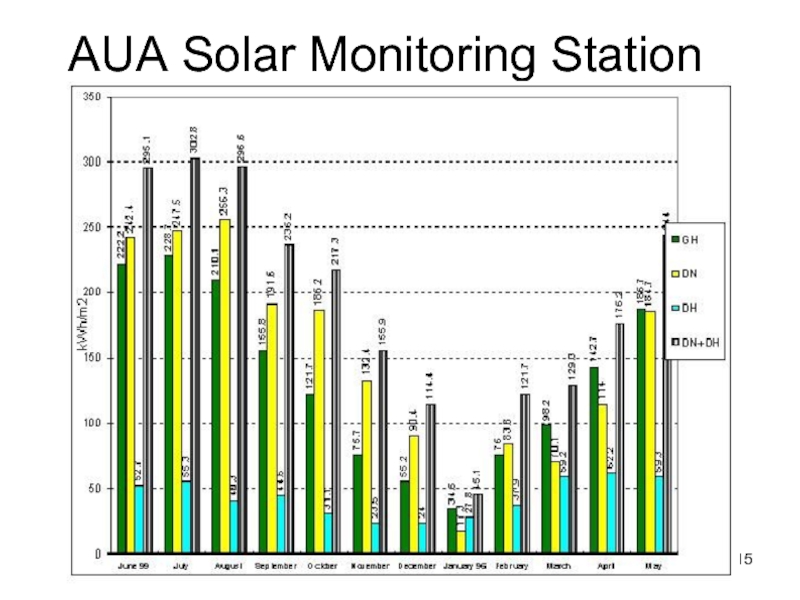
- 15. Lecture # 5 - Energy Resources AUA Solar Monitoring Station
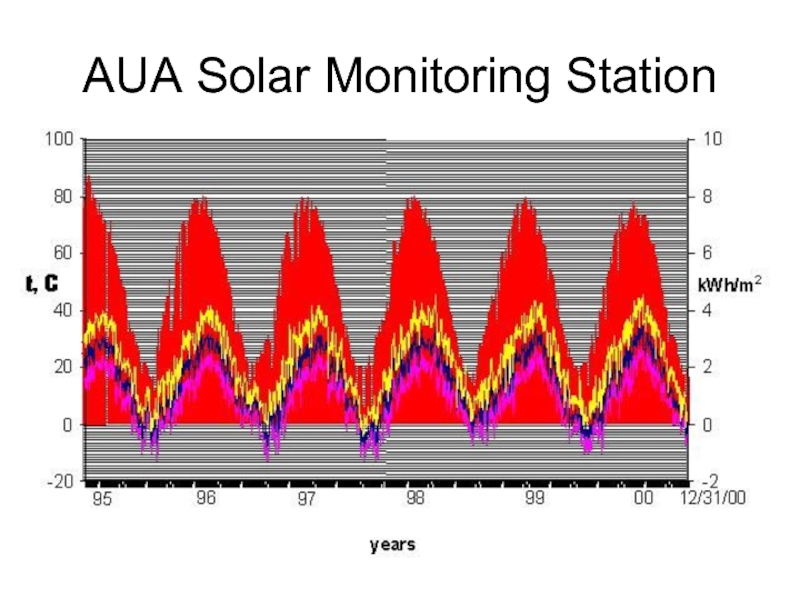
- 16. Lecture # 5 - Energy Resources AUA Solar Monitoring Station
- 17. Lecture # 5 - Energy Resources AUA
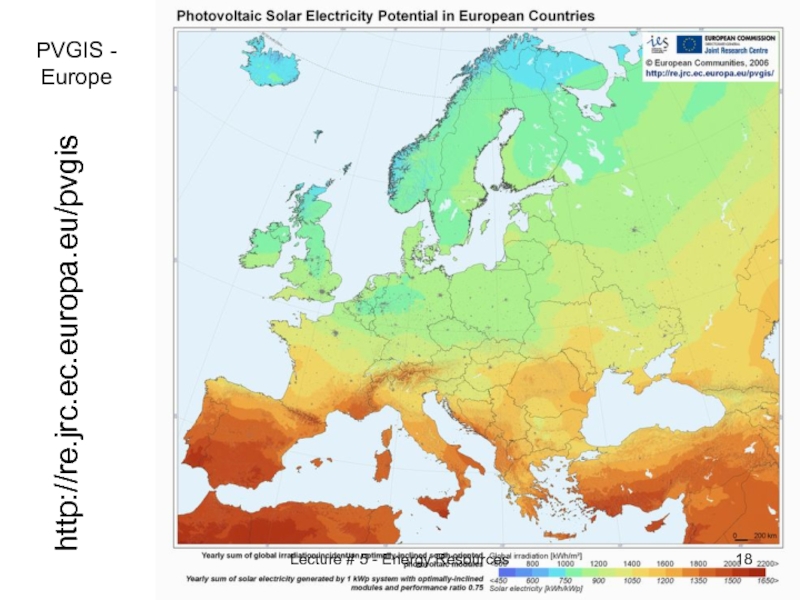
- 18. PVGIS - Europe http://re.jrc.ec.europa.eu/pvgis Lecture # 5 - Energy Resources
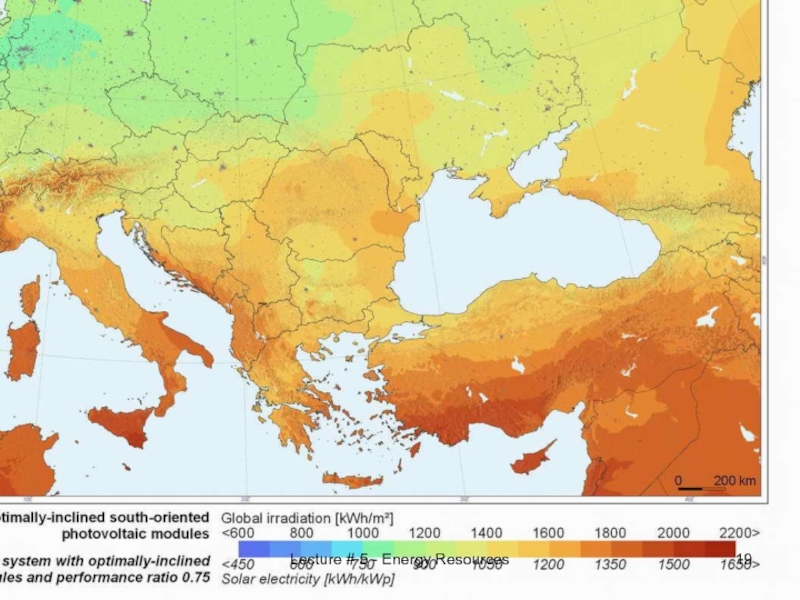
- 19. Lecture # 5 - Energy Resources
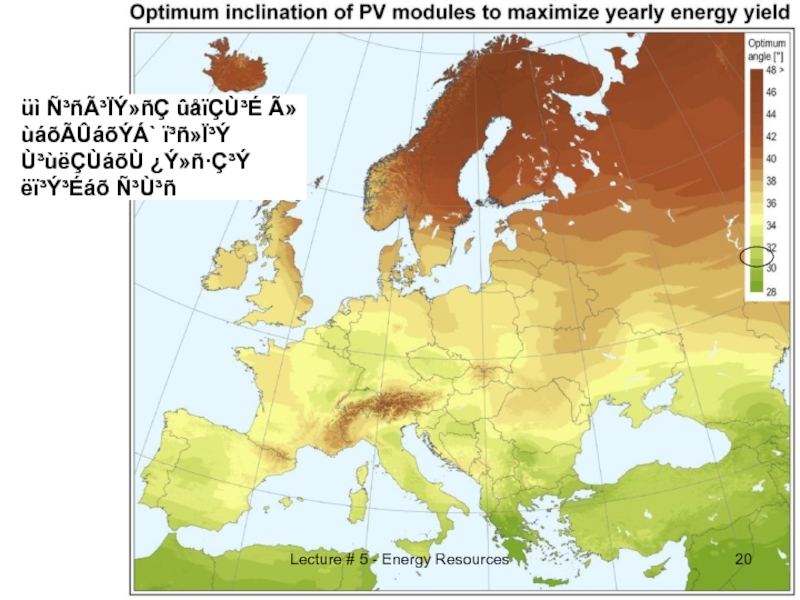
- 20. üì ѳñóÏÝ»ñÇ ûåïÇÙ³É Ã»ùáõÃÛáõÝÁ` ï³ñ»Ï³Ý Ù³ùëÇÙáõÙ ¿Ý»ñ·Ç³Ý
- 21. Lecture # 5 - Energy Resources AUA Solar Monitoring Station Collecting data since 1995
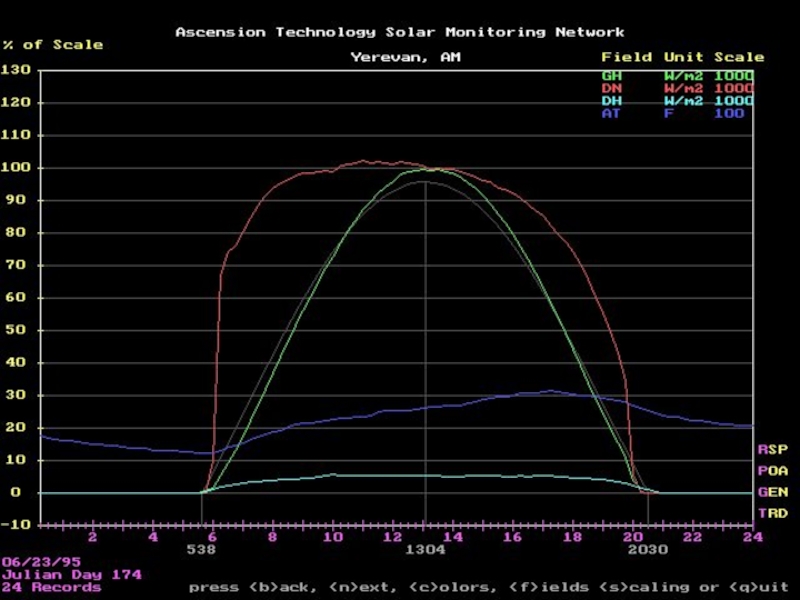
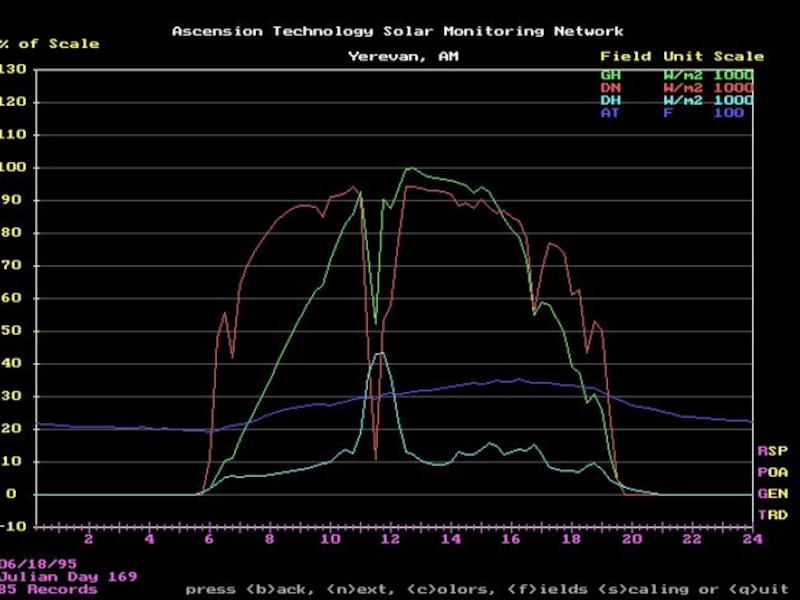
- 22. Lecture # 5 - Energy Resources Best day of June
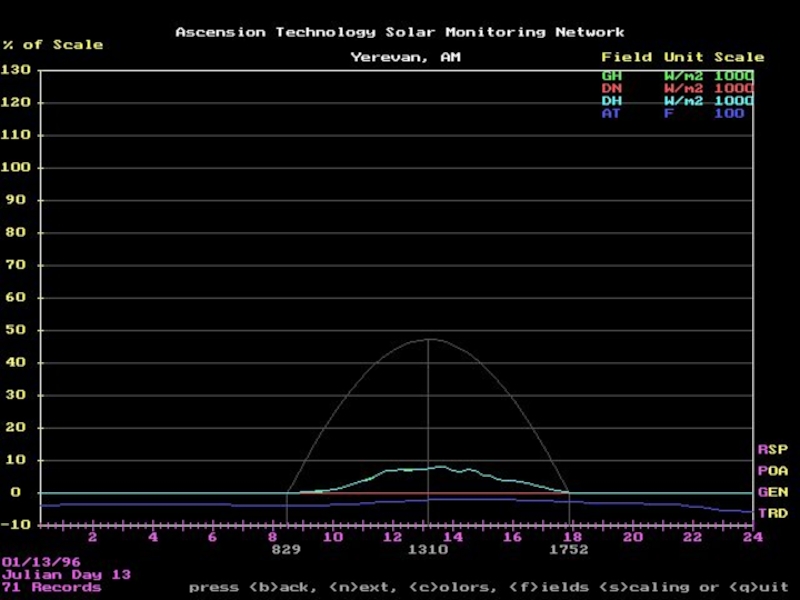
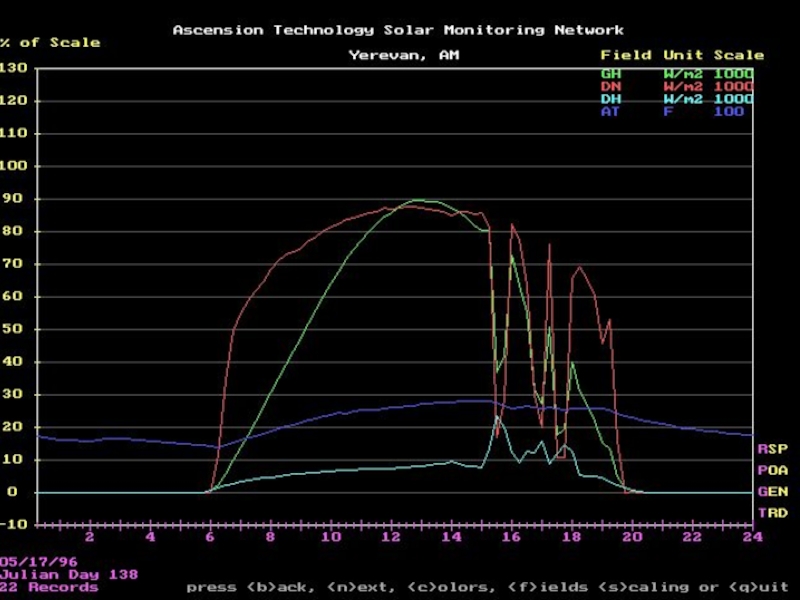
- 23. Lecture # 5 - Energy Resources Worst Day in January
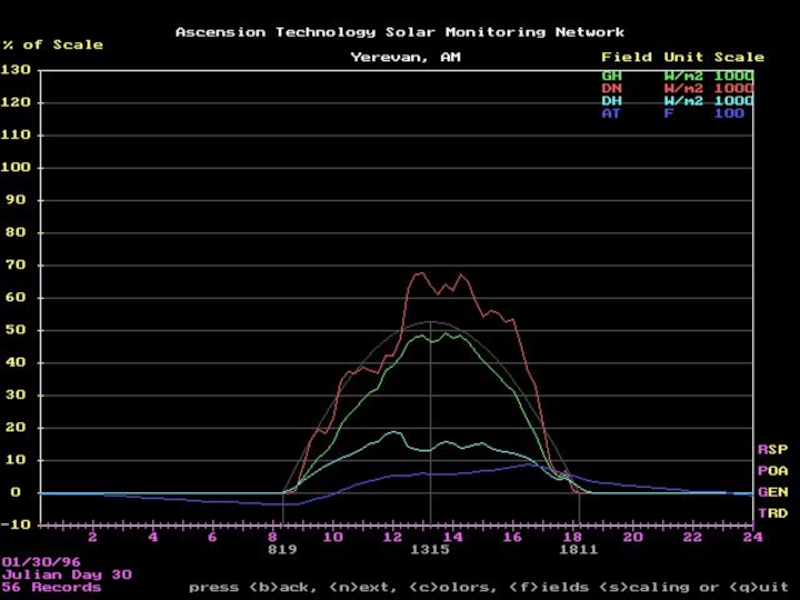
- 24. Lecture # 5 - Energy Resources Best day of January
- 25. Lecture # 5 - Energy Resources More SMS graphs
- 26. Lecture # 5 - Energy Resources More SMS graphs
- 27. Lecture # 5 - Energy Resources
- 28. Lecture # 5 - Energy Resources
- 29. Lecture # 5 - Energy Resources
- 30. Lecture # 5 - Energy Resources
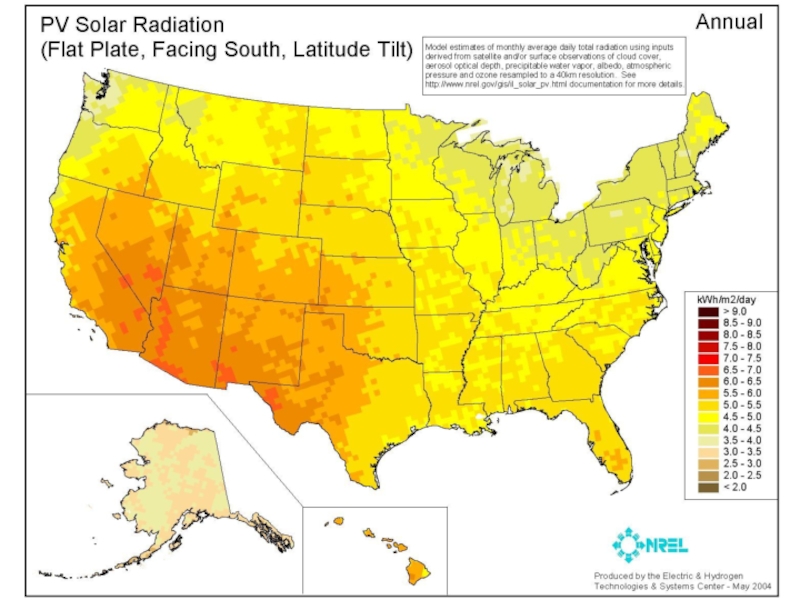
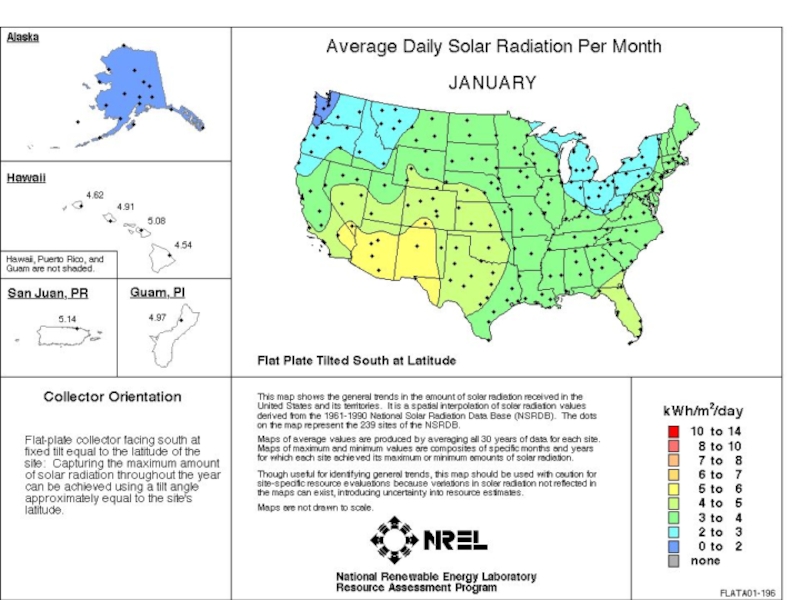
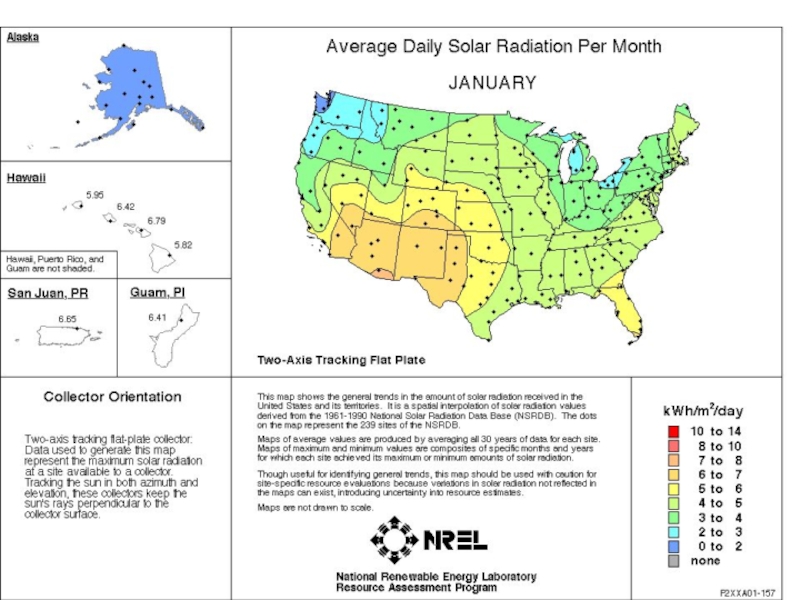
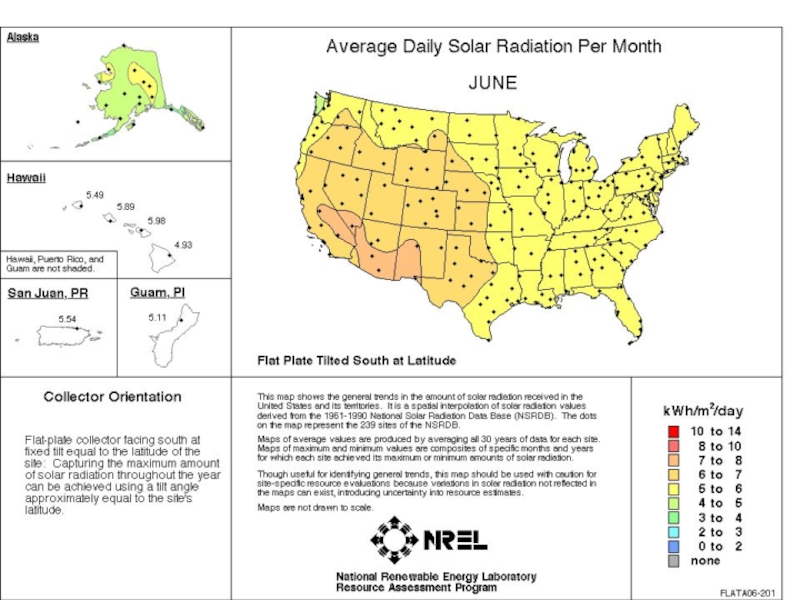
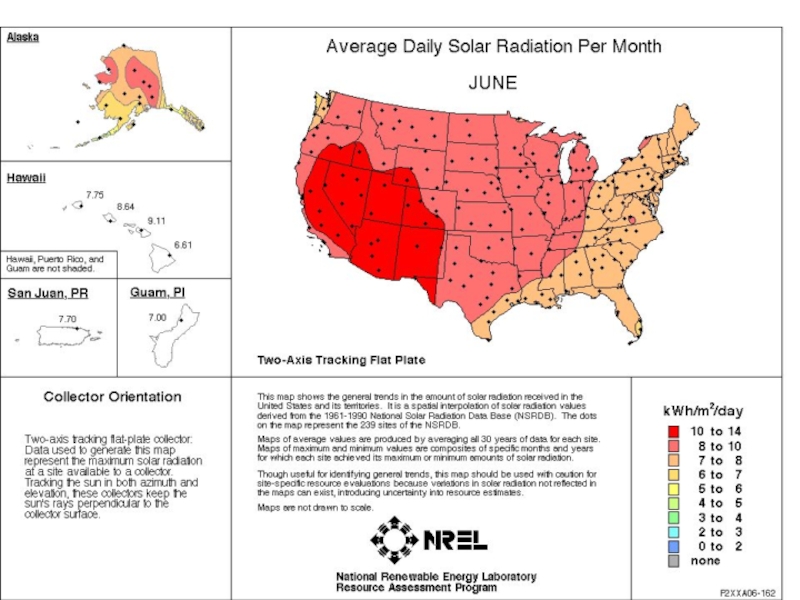
- 31. This info is available @: http://rredc.nrel.gov/solar/old_data/nsrdb/1961-1990/redbook/atlas/ Lecture # 5 - Energy Resources
- 32. European Global Horizontal ØÇçÇÝ »íñáå³Ï³ÝÁ` ßáõñç 1000 ÏìïÅ/(Ù2.ï³ñÇ) Lecture # 5 - Energy Resources
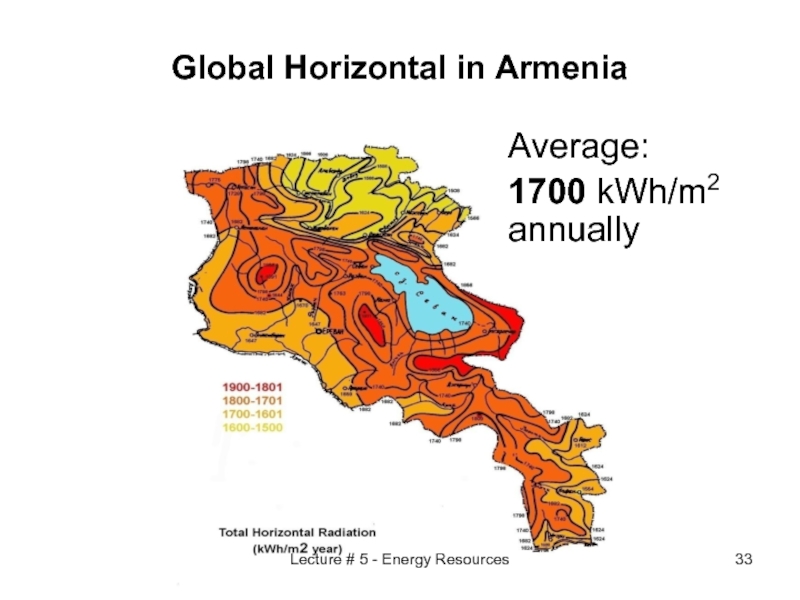
- 33. Global Horizontal in Armenia Average: 1700 kWh/m2 annually Lecture # 5 - Energy Resources
- 34. Solar Radiation in Armenia ÐáñǽáÝ³Ï³Ý Ù³Ï»ñևáõÛÃÇ ³é³í»É³·áõÛÝ
- 35. Solar Radiation in Armenia ºñև³ÝáõÙ ÑáõÉÇëÇÝ ÑáñǽáݳϳÝ
- 36. Lecture # 5 - Energy Resources Homework
Слайд 2Notion of the Cost per peak watt installed
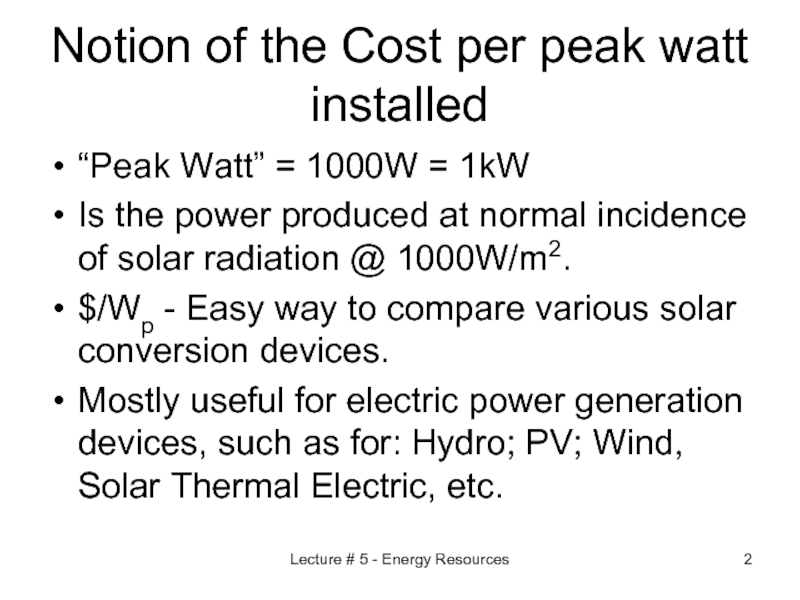
“Peak Watt” = 1000W
= 1kW
Is the power produced at normal incidence of solar radiation @ 1000W/m2.
$/Wp - Easy way to compare various solar conversion devices.
Mostly useful for electric power generation devices, such as for: Hydro; PV; Wind, Solar Thermal Electric, etc.
Is the power produced at normal incidence of solar radiation @ 1000W/m2.
$/Wp - Easy way to compare various solar conversion devices.
Mostly useful for electric power generation devices, such as for: Hydro; PV; Wind, Solar Thermal Electric, etc.
Lecture # 5 - Energy Resources
Слайд 3Lecture # 5 - Energy Resources
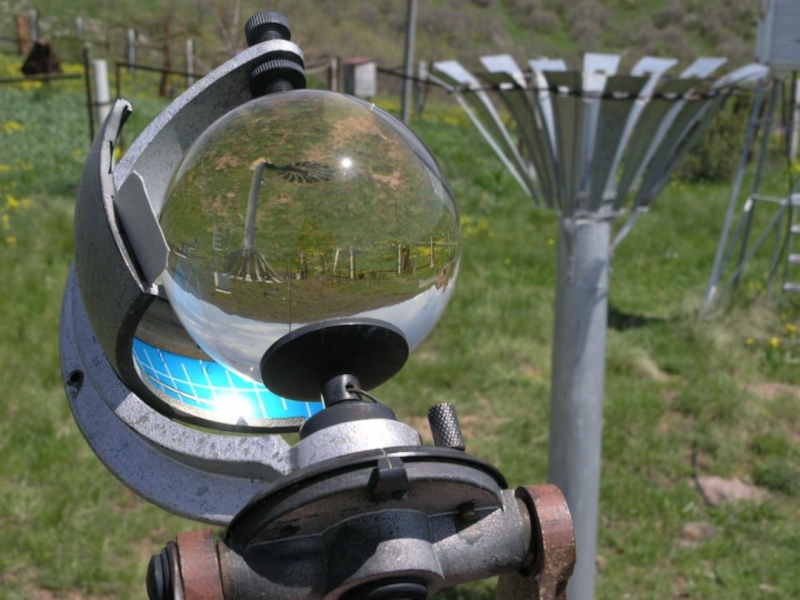
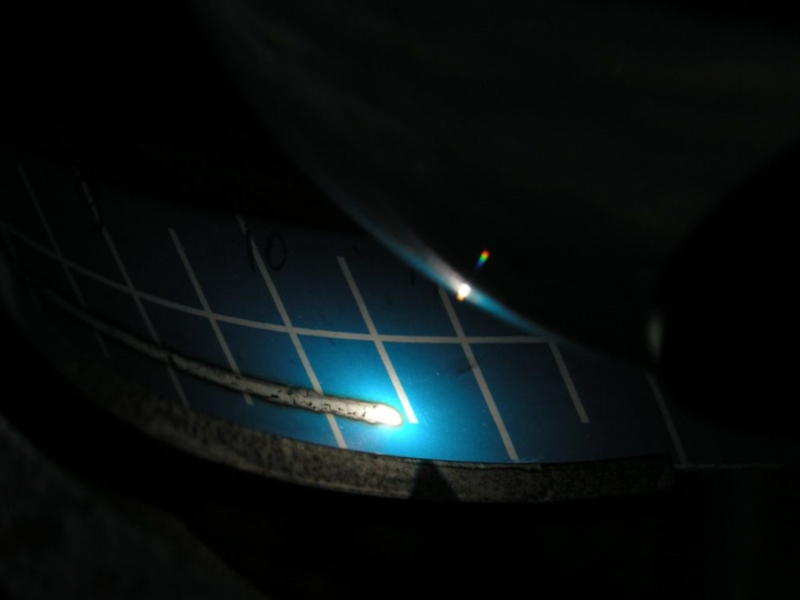
Solar Monitoring
However, each geographical location has
its characteristic insolation.
For that purpose we need to have a number of solar monitoring stations
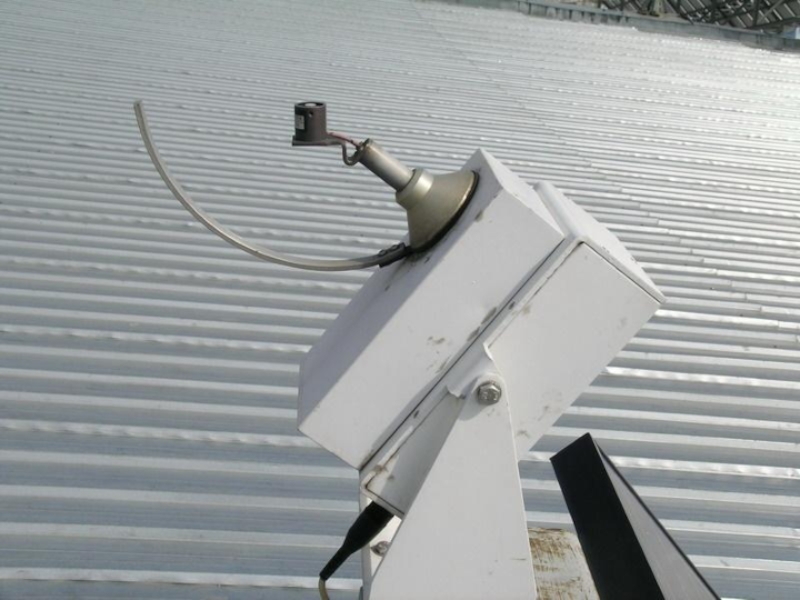
AUA has the first automated solar monitoring station in Armenia.
There are >24 SMS-s in San Francisco
For that purpose we need to have a number of solar monitoring stations
AUA has the first automated solar monitoring station in Armenia.
There are >24 SMS-s in San Francisco
Слайд 4Lecture # 5 - Energy Resources
Components of Solar Radiation
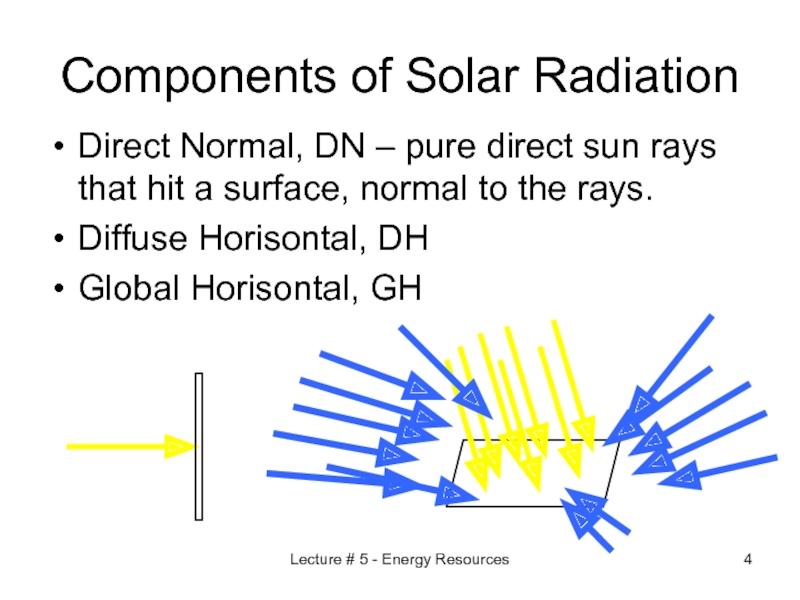
Direct Normal, DN
– pure direct sun rays that hit a surface, normal to the rays.
Diffuse Horisontal, DH
Global Horisontal, GH
Diffuse Horisontal, DH
Global Horisontal, GH
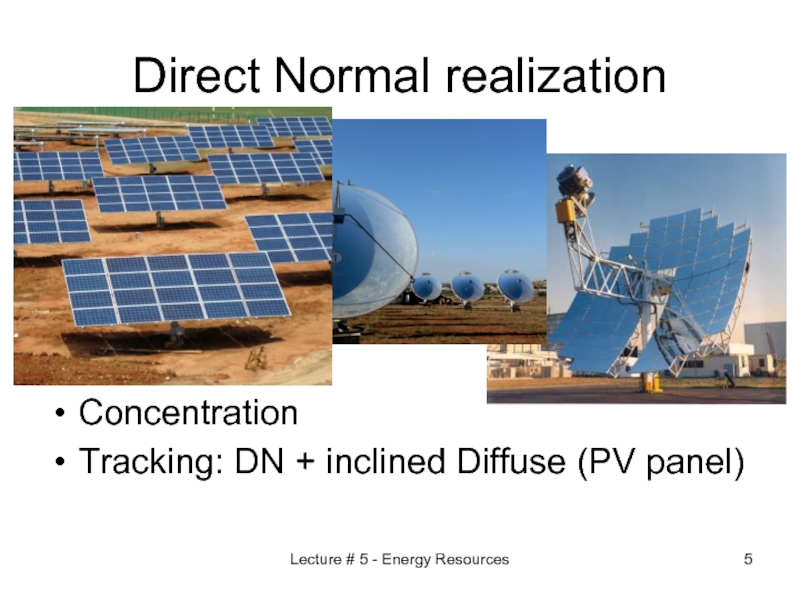
Слайд 5Direct Normal realization
Concentration
Tracking: DN + inclined Diffuse (PV panel)
Lecture # 5
- Energy Resources
Слайд 12Solar position Calculator
http://www.spectralcalc.com/solar_calculator/solar_position.php
Lecture # 5 - Energy Resources
Слайд 17Lecture # 5 - Energy Resources
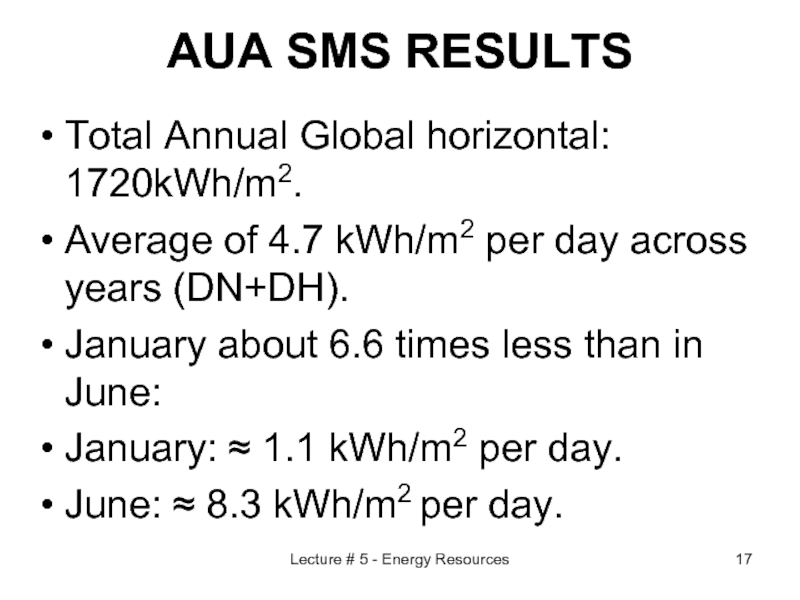
AUA SMS RESULTS
Total Annual Global horizontal:
1720kWh/m2.
Average of 4.7 kWh/m2 per day across years (DN+DH).
January about 6.6 times less than in June:
January: ≈ 1.1 kWh/m2 per day.
June: ≈ 8.3 kWh/m2 per day.
Average of 4.7 kWh/m2 per day across years (DN+DH).
January about 6.6 times less than in June:
January: ≈ 1.1 kWh/m2 per day.
June: ≈ 8.3 kWh/m2 per day.
Слайд 20üì ѳñóÏÝ»ñÇ ûåïÇÙ³É Ã»ùáõÃÛáõÝÁ` ï³ñ»Ï³Ý Ù³ùëÇÙáõÙ ¿Ý»ñ·Ç³Ý ëï³Ý³Éáõ ѳٳñ
Lecture #
5 - Energy Resources
Слайд 31This info is available @:
http://rredc.nrel.gov/solar/old_data/nsrdb/1961-1990/redbook/atlas/
Lecture # 5 - Energy Resources
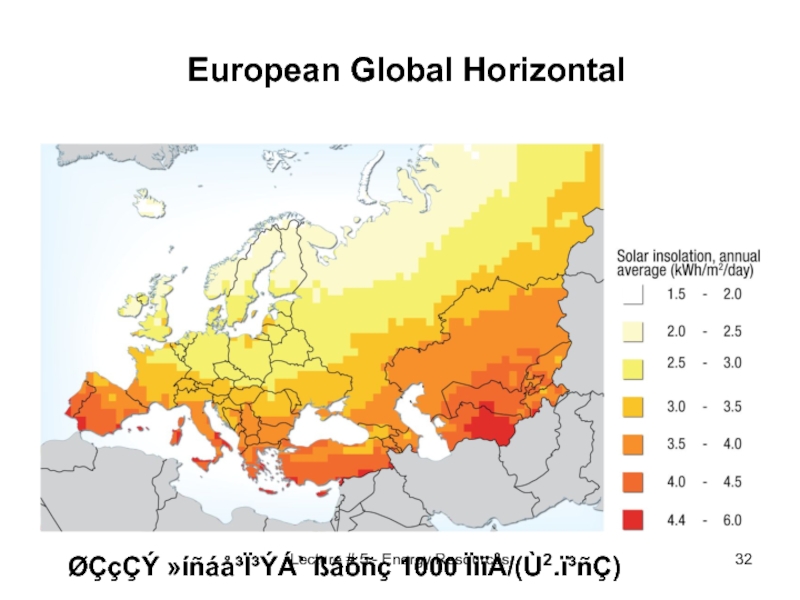
Слайд 32European Global Horizontal
ØÇçÇÝ »íñáå³Ï³ÝÁ` ßáõñç 1000 ÏìïÅ/(Ù2.ï³ñÇ)
Lecture # 5 - Energy
Resources
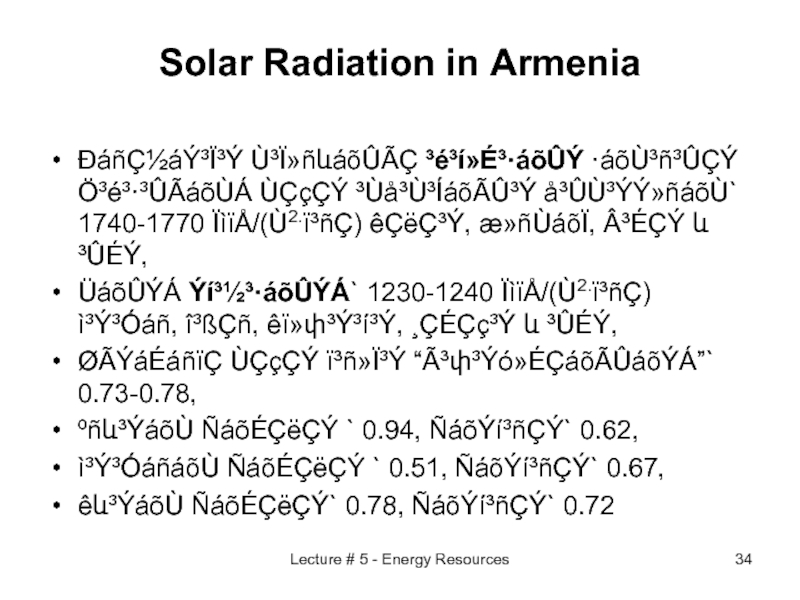
Слайд 34Solar Radiation in Armenia
ÐáñǽáÝ³Ï³Ý Ù³Ï»ñևáõÛÃÇ ³é³í»É³·áõÛÝ ·áõÙ³ñ³ÛÇÝ Ö³é³·³ÛÃáõÙÁ ÙÇçÇÝ ³Ùå³Ù³ÍáõÃÛ³Ý å³ÛÙ³ÝÝ»ñáõÙ`
1740-1770 ÏìïÅ/(Ù2.ï³ñÇ) êÇëdzÝ, æ»ñÙáõÏ, ³ÉÇÝ և ³ÛÉÝ,
ÜáõÛÝÁ Ýí³½³·áõÛÝÁ` 1230-1240 ÏìïÅ/(Ù2.ï³ñÇ) ì³Ý³Óáñ, î³ßÇñ, êï»փ³Ý³í³Ý, ¸ÇÉÇç³Ý և ³ÛÉÝ,
ØÃÝáÉáñïÇ ÙÇçÇÝ ï³ñ»Ï³Ý “óփ³Ýó»ÉÇáõÃÛáõÝÁ”` 0.73-0.78,
ºñև³ÝáõÙ ÑáõÉÇëÇÝ ` 0.94, ÑáõÝí³ñÇÝ` 0.62,
ì³Ý³ÓáñáõÙ ÑáõÉÇëÇÝ ` 0.51, ÑáõÝí³ñÇÝ` 0.67,
êև³ÝáõÙ ÑáõÉÇëÇÝ` 0.78, ÑáõÝí³ñÇÝ` 0.72
ÜáõÛÝÁ Ýí³½³·áõÛÝÁ` 1230-1240 ÏìïÅ/(Ù2.ï³ñÇ) ì³Ý³Óáñ, î³ßÇñ, êï»փ³Ý³í³Ý, ¸ÇÉÇç³Ý և ³ÛÉÝ,
ØÃÝáÉáñïÇ ÙÇçÇÝ ï³ñ»Ï³Ý “óփ³Ýó»ÉÇáõÃÛáõÝÁ”` 0.73-0.78,
ºñև³ÝáõÙ ÑáõÉÇëÇÝ ` 0.94, ÑáõÝí³ñÇÝ` 0.62,
ì³Ý³ÓáñáõÙ ÑáõÉÇëÇÝ ` 0.51, ÑáõÝí³ñÇÝ` 0.67,
êև³ÝáõÙ ÑáõÉÇëÇÝ` 0.78, ÑáõÝí³ñÇÝ` 0.72
Lecture # 5 - Energy Resources
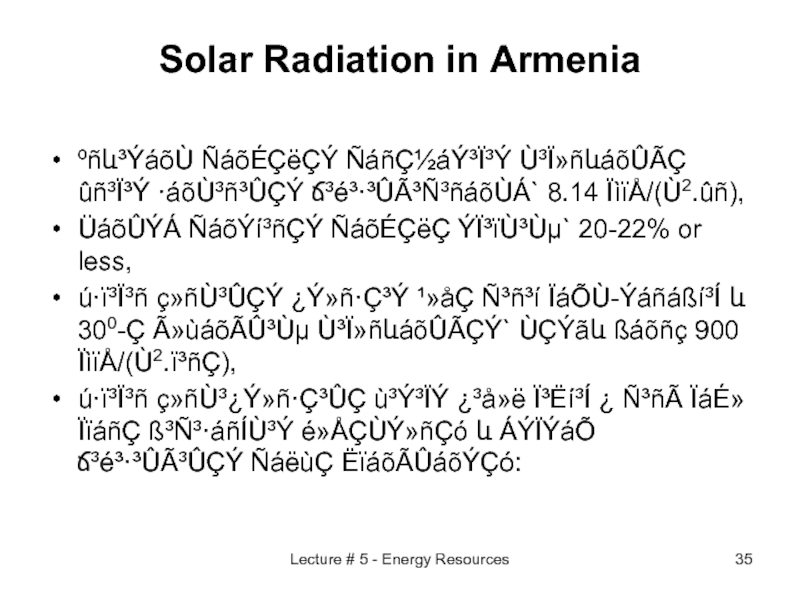
Слайд 35Solar Radiation in Armenia
ºñև³ÝáõÙ ÑáõÉÇëÇÝ ÑáñǽáÝ³Ï³Ý Ù³Ï»ñևáõÛÃÇ ûñ³Ï³Ý ·áõÙ³ñ³ÛÇÝ ճ³é³·³ÛóѳñáõÙÁ` 8.14
ÏìïÅ/(Ù2.ûñ),
ÜáõÛÝÁ ÑáõÝí³ñÇÝ ÑáõÉÇëÇ Ýϳïٳٵ` 20-22% or less,
ú·ï³Ï³ñ ç»ñÙ³ÛÇÝ ¿Ý»ñ·Ç³Ý ¹»åÇ Ñ³ñ³í ÏáÕÙ-Ýáñáßí³Í և 300-Ç Ã»ùáõÃÛ³Ùµ ٳϻñևáõÛÃÇÝ` ÙÇÝãև ßáõñç 900 ÏìïÅ/(Ù2.ï³ñÇ),
ú·ï³Ï³ñ ç»ñÙ³¿Ý»ñ·Ç³ÛÇ ù³Ý³ÏÝ ¿³å»ë ϳËí³Í ¿ ѳñà ÏáÉ»ÏïáñÇ ß³Ñ³·áñÍÙ³Ý é»ÅÇÙÝ»ñÇó և ÁÝÏÝáÕ ճ³é³·³ÛóÛÇÝ ÑáëùÇ ËïáõÃÛáõÝÇó:
ÜáõÛÝÁ ÑáõÝí³ñÇÝ ÑáõÉÇëÇ Ýϳïٳٵ` 20-22% or less,
ú·ï³Ï³ñ ç»ñÙ³ÛÇÝ ¿Ý»ñ·Ç³Ý ¹»åÇ Ñ³ñ³í ÏáÕÙ-Ýáñáßí³Í և 300-Ç Ã»ùáõÃÛ³Ùµ ٳϻñևáõÛÃÇÝ` ÙÇÝãև ßáõñç 900 ÏìïÅ/(Ù2.ï³ñÇ),
ú·ï³Ï³ñ ç»ñÙ³¿Ý»ñ·Ç³ÛÇ ù³Ý³ÏÝ ¿³å»ë ϳËí³Í ¿ ѳñà ÏáÉ»ÏïáñÇ ß³Ñ³·áñÍÙ³Ý é»ÅÇÙÝ»ñÇó և ÁÝÏÝáÕ ճ³é³·³ÛóÛÇÝ ÑáëùÇ ËïáõÃÛáõÝÇó:
Lecture # 5 - Energy Resources
Слайд 36Lecture # 5 - Energy Resources
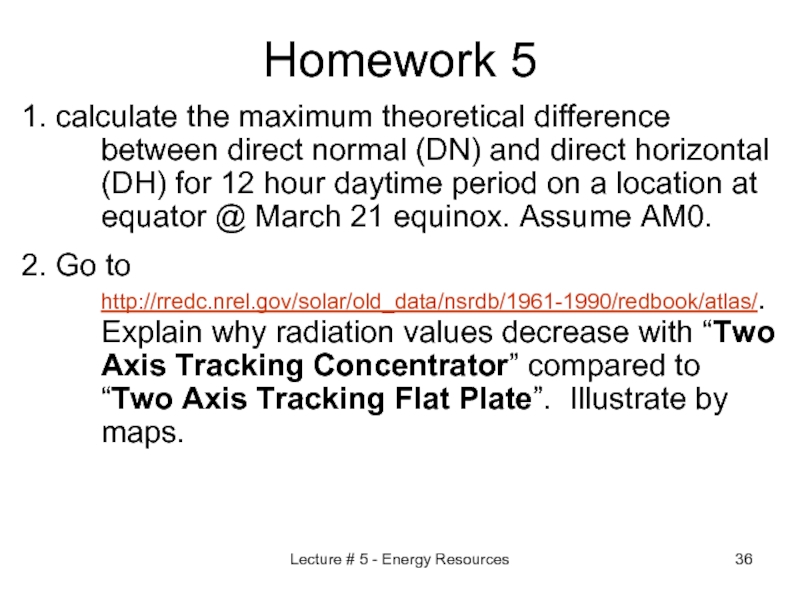
Homework 5
1. calculate the maximum theoretical
difference between direct normal (DN) and direct horizontal (DH) for 12 hour daytime period on a location at equator @ March 21 equinox. Assume AM0.
2. Go to http://rredc.nrel.gov/solar/old_data/nsrdb/1961-1990/redbook/atlas/. Explain why radiation values decrease with “Two Axis Tracking Concentrator” compared to “Two Axis Tracking Flat Plate”. Illustrate by maps.
2. Go to http://rredc.nrel.gov/solar/old_data/nsrdb/1961-1990/redbook/atlas/. Explain why radiation values decrease with “Two Axis Tracking Concentrator” compared to “Two Axis Tracking Flat Plate”. Illustrate by maps.
