- Главная
- Разное
- Дизайн
- Бизнес и предпринимательство
- Аналитика
- Образование
- Развлечения
- Красота и здоровье
- Финансы
- Государство
- Путешествия
- Спорт
- Недвижимость
- Армия
- Графика
- Культурология
- Еда и кулинария
- Лингвистика
- Английский язык
- Астрономия
- Алгебра
- Биология
- География
- Детские презентации
- Информатика
- История
- Литература
- Маркетинг
- Математика
- Медицина
- Менеджмент
- Музыка
- МХК
- Немецкий язык
- ОБЖ
- Обществознание
- Окружающий мир
- Педагогика
- Русский язык
- Технология
- Физика
- Философия
- Химия
- Шаблоны, картинки для презентаций
- Экология
- Экономика
- Юриспруденция
Job Market UpdateU.S. Economic Data презентация
Содержание
- 1. Job Market UpdateU.S. Economic Data
- 2. Overview of “The Employment Situation” The October
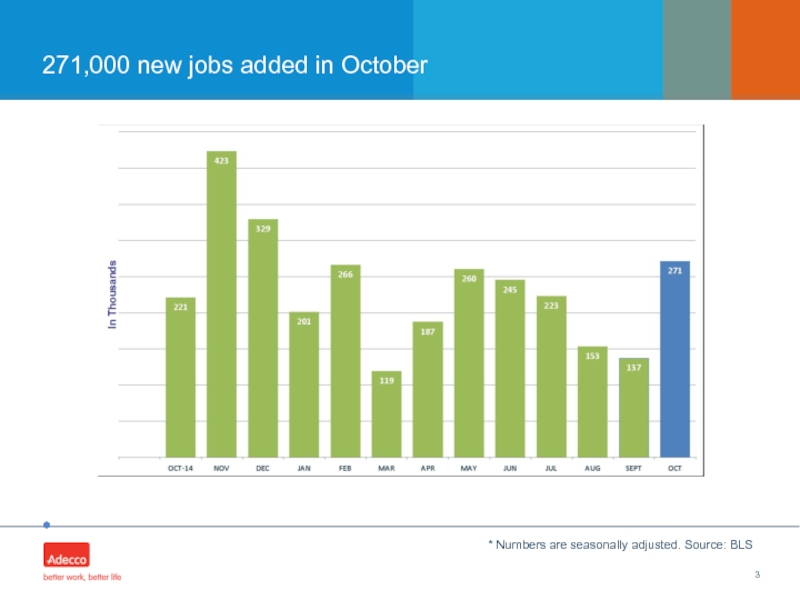
- 3. 271,000 new jobs added in October * Numbers are seasonally adjusted. Source: BLS
- 4. Employment in October Number of unemployed persons
- 5. Industry Breakdown Professional & Business Services Increase
- 6. Industry Breakdown Temporary Help Services Added
- 7. Employment in total nonfarm * Numbers are
- 8. State & Regional Report – September 2015
- 9. Northeast Division – September 2015 The unemployment
- 10. South Division – September 2015 Unemployment remained
- 11. Midwest Division – September 2015 The Midwest
- 12. West Division – September 2015 The West
Слайд 1Job Market Update
U.S. Economic Data
Reflective of the Bureau of Labor Statistics
As of November 2015
Слайд 2Overview of “The Employment Situation”
The October report showed an overall monthly
The unemployment rate dropped slightly to 5.0%
Revisions to prior months:
The August number was revised from +136,000 to +153,000
The September number was revised from +142,000 to +137,000
That’s a total of 12,000 more jobs than was previously reported
Слайд 4Employment in October
Number of unemployed persons is down by 1.1 million,
Unemployment dropped to 5.0%, the lowest since April, 2008.
The number of long-term unemployed was little changed at 2.1 million.
The number of involuntary part-time workers decreased by 269,000 in October.
Discouraged workers in October increased by 11,000
Average hourly payrolls increased by 9 cents, to $25.20
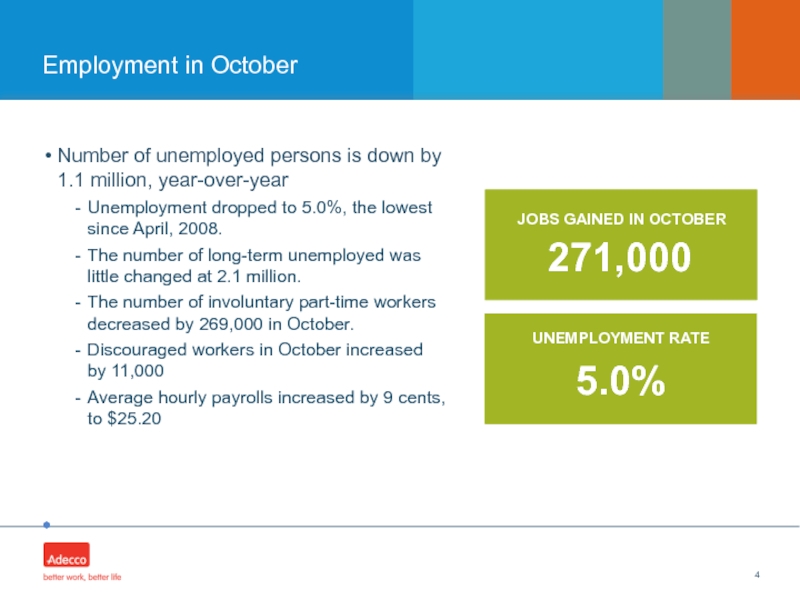
JOBS GAINED IN OCTOBER
UNEMPLOYMENT RATE
271,000
5.0%
Слайд 5Industry Breakdown
Professional & Business Services
Increase of 78,000 jobs
Administrative and support
Computer systems design and related services added 9,900 jobs
Architectural and engineering services added 8,300 jobs
Total Americans employed in this sector during September: 19.93 million
Manufacturing
No net change in October, following a loss of 9,000 in September
Modest job gains seen in furniture and related products (+2,600) and nonmetallic mineral products (+1,800)
Leisure & Hospitality
Increase of 41,000 jobs in October
Food services and drinking places added 42,000 jobs
Healthcare
Added 44,900 jobs during October
Hospitals subsector added 17,800 jobs
Ambulatory health care services increased the most at 26,900 jobs
Year-over-year the healthcare industry has added nearly half a million jobs
Source: BLS
Слайд 6Industry Breakdown
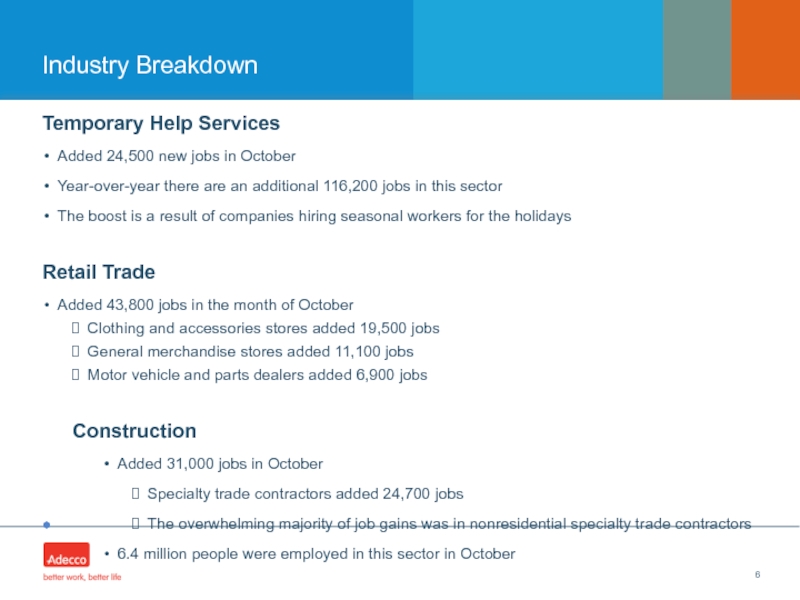
Temporary Help Services
Added 24,500 new jobs in October
Year-over-year there
The boost is a result of companies hiring seasonal workers for the holidays
Retail Trade
Added 43,800 jobs in the month of October
Clothing and accessories stores added 19,500 jobs
General merchandise stores added 11,100 jobs
Motor vehicle and parts dealers added 6,900 jobs
Construction
Added 31,000 jobs in October
Specialty trade contractors added 24,700 jobs
The overwhelming majority of job gains was in nonresidential specialty trade contractors
6.4 million people were employed in this sector in October
Other Services
Membership associations and organizations lost 4,600 jobs
Repair and maintenance added 8,900 jobs
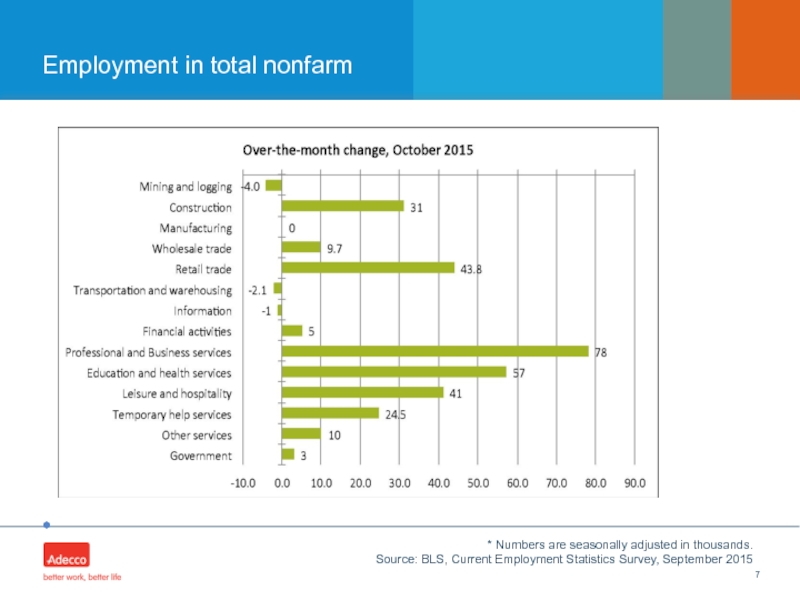
Слайд 7Employment in total nonfarm
* Numbers are seasonally adjusted in thousands.
Source:
Слайд 8State & Regional Report – September 2015
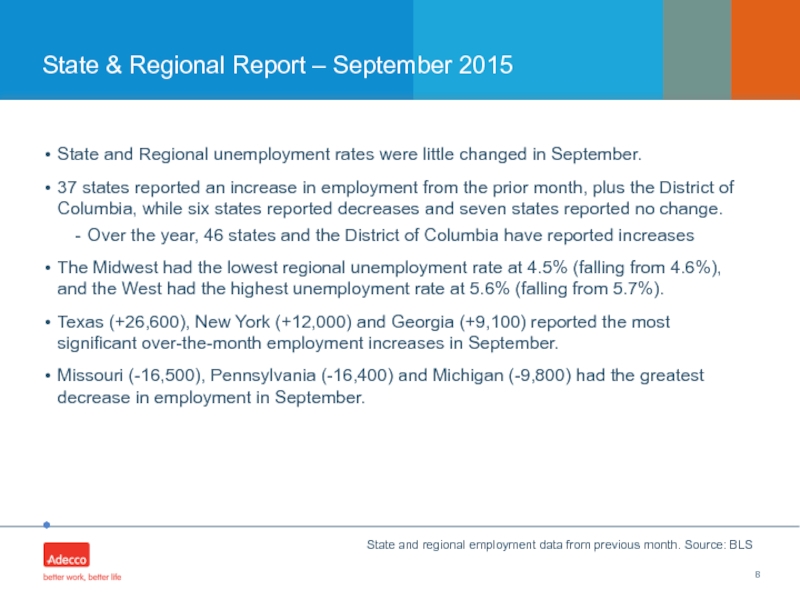
State and Regional unemployment rates
37 states reported an increase in employment from the prior month, plus the District of Columbia, while six states reported decreases and seven states reported no change.
Over the year, 46 states and the District of Columbia have reported increases
The Midwest had the lowest regional unemployment rate at 4.5% (falling from 4.6%), and the West had the highest unemployment rate at 5.6% (falling from 5.7%).
Texas (+26,600), New York (+12,000) and Georgia (+9,100) reported the most significant over-the-month employment increases in September.
Missouri (-16,500), Pennsylvania (-16,400) and Michigan (-9,800) had the greatest decrease in employment in September.
State and regional employment data from previous month. Source: BLS
Слайд 9Northeast Division – September 2015
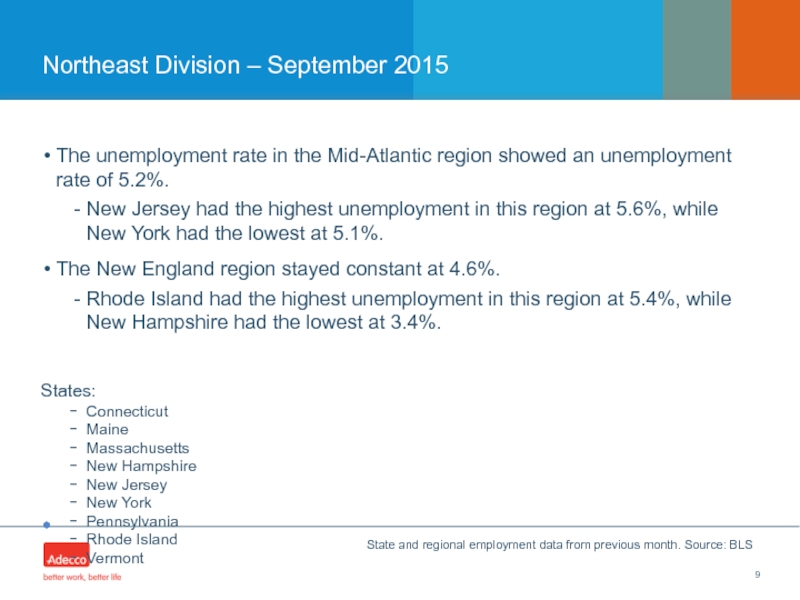
The unemployment rate in the Mid-Atlantic region
New Jersey had the highest unemployment in this region at 5.6%, while New York had the lowest at 5.1%.
The New England region stayed constant at 4.6%.
Rhode Island had the highest unemployment in this region at 5.4%, while New Hampshire had the lowest at 3.4%.
States:
Connecticut
Maine
Massachusetts
New Hampshire
New Jersey
New York
Pennsylvania
Rhode Island
Vermont
State and regional employment data from previous month. Source: BLS
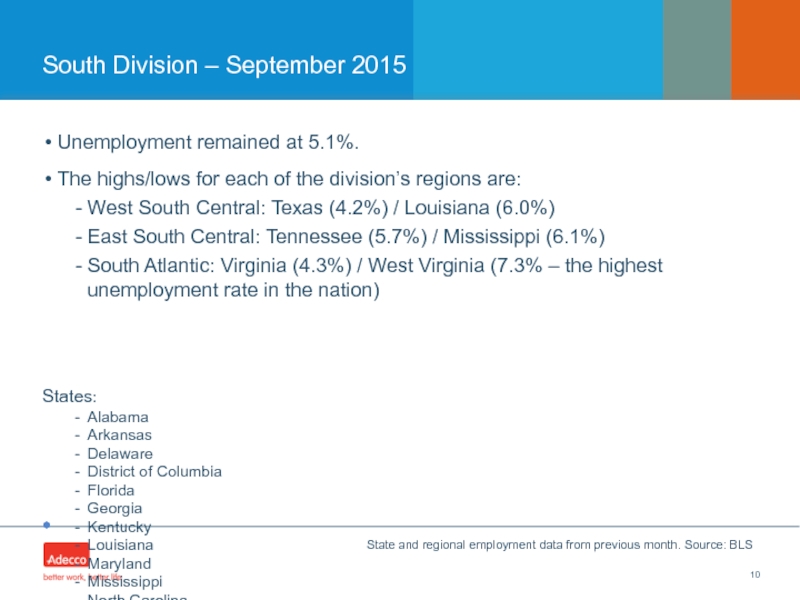
Слайд 10South Division – September 2015
Unemployment remained at 5.1%.
The highs/lows for each
West South Central: Texas (4.2%) / Louisiana (6.0%)
East South Central: Tennessee (5.7%) / Mississippi (6.1%)
South Atlantic: Virginia (4.3%) / West Virginia (7.3% – the highest unemployment rate in the nation)
States:
Alabama
Arkansas
Delaware
District of Columbia
Florida
Georgia
Kentucky
Louisiana
Maryland
Mississippi
North Carolina
Oklahoma
South Carolina
Tennessee
Texas
Virginia
West Virginia
State and regional employment data from previous month. Source: BLS
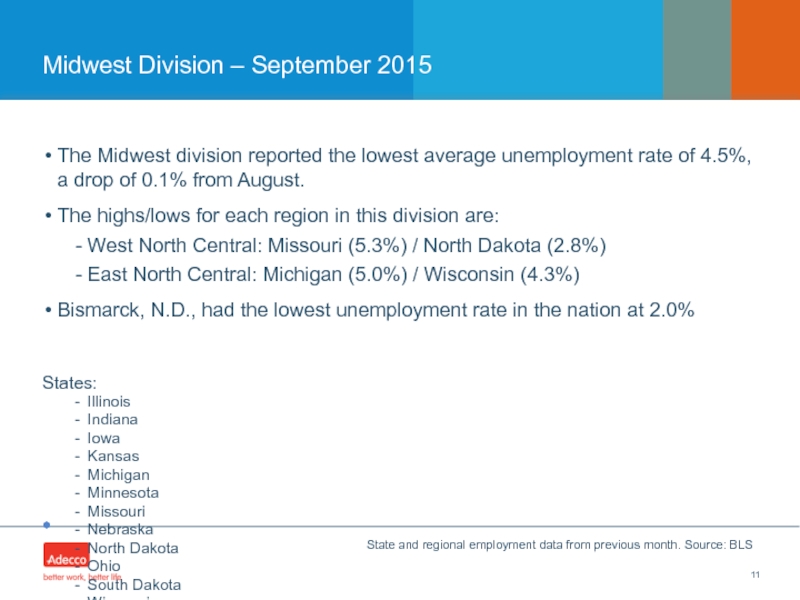
Слайд 11Midwest Division – September 2015
The Midwest division reported the lowest average
The highs/lows for each region in this division are:
West North Central: Missouri (5.3%) / North Dakota (2.8%)
East North Central: Michigan (5.0%) / Wisconsin (4.3%)
Bismarck, N.D., had the lowest unemployment rate in the nation at 2.0%
States:
Illinois
Indiana
Iowa
Kansas
Michigan
Minnesota
Missouri
Nebraska
North Dakota
Ohio
South Dakota
Wisconsin
State and regional employment data from previous month. Source: BLS
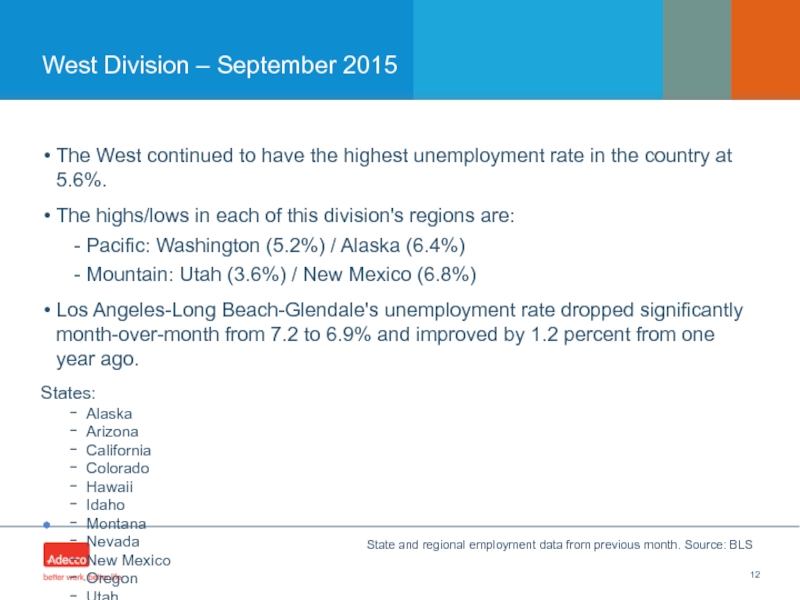
Слайд 12West Division – September 2015
The West continued to have the highest
The highs/lows in each of this division's regions are:
Pacific: Washington (5.2%) / Alaska (6.4%)
Mountain: Utah (3.6%) / New Mexico (6.8%)
Los Angeles-Long Beach-Glendale's unemployment rate dropped significantly month-over-month from 7.2 to 6.9% and improved by 1.2 percent from one year ago.
States:
Alaska
Arizona
California
Colorado
Hawaii
Idaho
Montana
Nevada
New Mexico
Oregon
Utah
Washington
Wyoming
State and regional employment data from previous month. Source: BLS

