- Главная
- Разное
- Дизайн
- Бизнес и предпринимательство
- Аналитика
- Образование
- Развлечения
- Красота и здоровье
- Финансы
- Государство
- Путешествия
- Спорт
- Недвижимость
- Армия
- Графика
- Культурология
- Еда и кулинария
- Лингвистика
- Английский язык
- Астрономия
- Алгебра
- Биология
- География
- Детские презентации
- Информатика
- История
- Литература
- Маркетинг
- Математика
- Медицина
- Менеджмент
- Музыка
- МХК
- Немецкий язык
- ОБЖ
- Обществознание
- Окружающий мир
- Педагогика
- Русский язык
- Технология
- Физика
- Философия
- Химия
- Шаблоны, картинки для презентаций
- Экология
- Экономика
- Юриспруденция
Introduction to finance презентация
Содержание
- 1. Introduction to finance
- 2. Examination paper format Answer FOUR
- 3. Question 1 (a) Calculation (10 marks)
- 4. Question 3 Theory : Explain
- 5. Question 5 Theory and show
- 6. The Goal of the Firm The goal
- 7. 3 Roles of Finance in Business What
- 8. Role of the Financial Manager
- 9. Legal Forms of Business Organization
- 10. Sole Proprietorship Business owned by an individual
- 11. Partnership Two or more persons come together
- 12. Corporation Legally functions separate and apart from
- 13. Hybrid Organizations: S-Corporation Benefits Limited liability Taxed
- 14. Hybrid Organizations: Limited Liability Companies (LLCs)
- 15. Finance and The Multinational Firm: The New
- 16. Why Do Companies Go Abroad? To increase
- 17. Risks/Challenges of Going Abroad Country risk (changes
- 18. What Is Liquidity? Liquidity is the
- 19. How Liquid Is the Firm? A liquid
- 20. Measuring Liquidity: Perspective 1 Compare a
- 21. Table 4-1
- 22. Table 4-2
- 23. Current Ratio Current ratio compares a firm’s
- 24. Acid Test or Quick Ratio Quick ratio
- 25. Measuring Liquidity: Perspective 2 Measures a firm’s
- 26. Days in Receivables (Average Collection Period)
- 27. Days in Inventory
- 28. Certificates of deposit are slightly less liquid,
- 29. Each of the above can be
- 30. Other examples are items like coins,
- 31. Cash is a company's lifeblood. In
- 32. Depending on the industry, companies with
- 33. A more stringent measure is the quick
- 34. One last ratio of note is
- 35. Are the Firm’s Managers Generating Adequate
- 36. Operating Return on Assets (ORA)
- 37. Managing Operations: Operating Profit Margin (OPM)
- 38. Managing Assets: Total Asset Turnover
- 39. Managing Assets: Fixed Asset Turnover
- 40. How Is the Firm Financing Its Assets?
- 41. Debt Ratio
- 42. Times Interest Earned This ratio indicates the
- 43. Are the Firm’s Managers Providing a Good
- 44. ROE Home Depot = $3,338M ÷ $18,889M
- 45. Price/Earnings Ratio
- 46. Limitations of Financial Ratio Analysis It
- 48. Introduction to Finance Chapter 5 – Stock valuation
- 49. Learning Objectives Identify the basic characteristics of
- 50. Preferred Stock Preferred stock is often referred
- 51. Characteristics of Preferred Stocks Multiple series of
- 52. Multiple Series If a company desires, it
- 53. Claim on Assets and Income Claim on
- 54. Cumulative Dividends Cumulative feature (if it exists)
- 55. Protective Provisions Protective provisions generally allow for
- 56. Convertibility Convertible preferred stock can, at the
- 57. Retirement Provisions Although preferred stock has no
- 58. The economic or intrinsic value of a
- 59. Common Stock Common stock is a certificate
- 60. Claim on Income Common shareholders have the
- 61. Claim on Assets Common stock has a
- 62. Limited Liability The liability of shareholders is
- 63. Voting Rights Most often, common stockholders are
- 64. Preemptive Rights Preemptive right entitles the common
- 65. Valuing Common Stock Like bonds and preferred
- 66. Dividend Model Unlike preferred stock, common stock
- 67. How Can a Company Grow? Through
- 68. Plowback ratio pr Internal Growth g =
- 69. Dividend Valuation Model Value of Common stock
- 70. The Expected Rate of Return of Preferred
- 71. V=D1/(r-g) r-g= D1/P
- 72. Price versus Expected Return Typically, an investor
- 73. Bonds Meaning: A bond is a type
- 74. Debentures Debentures are unsecured long-term debt. For
- 75. Subordinated Debentures There is a hierarchy of
- 76. Mortgage Bonds Mortgage bond is secured by
- 77. Eurobonds Securities (bonds) issued in a country
- 78. TERMINOLOGY AND CHARACTERISTICS OF BONDS Claims on
- 79. TERMINOLOGY AND CHARACTERISTICS OF BONDS Par Value
- 80. TERMINOLOGY AND CHARACTERISTICS OF BONDS Coupon Interest
- 81. TERMINOLOGY AND CHARACTERISTICS OF BONDS Zero Coupon
- 82. TERMINOLOGY AND CHARACTERISTICS OF BONDS Maturity
- 83. TERMINOLOGY AND CHARACTERISTICS OF BONDS Call Provision
- 84. TERMINOLOGY AND CHARACTERISTICS OF BONDS Indenture
- 85. TERMINOLOGY AND CHARACTERISTICS OF BONDS Bond Ratings
- 86. TERMINOLOGY AND CHARACTERISTICS OF BONDS Bond Ratings
- 87. TERMINOLOGY AND CHARACTERISTICS OF BONDS Factors Having
- 88. TERMINOLOGY AND CHARACTERISTICS OF BONDS Junk Bonds
- 89. Capital Capital represents the funds used to
- 90. Cost of Capital The firm’s
- 91. Investor’s Required Rate of Return Investor’s Required
- 92. Financial Policy A firm’s financial policy indicates
- 93. The Cost of Debt
- 94. The Cost of Debt See Example 9.1
- 95. The Cost of Preferred Stock If flotation
- 96. The Cost of Common Equity Cost of
- 97. Cost Estimation Techniques Two commonly used methods
- 98. The Dividend Growth Model Investors’ required rate
- 99. The Dividend Growth Model Example: A company
- 100. The Capital Asset Pricing Model
- 101. Capital Asset Pricing Model Variable Estimates CAPM
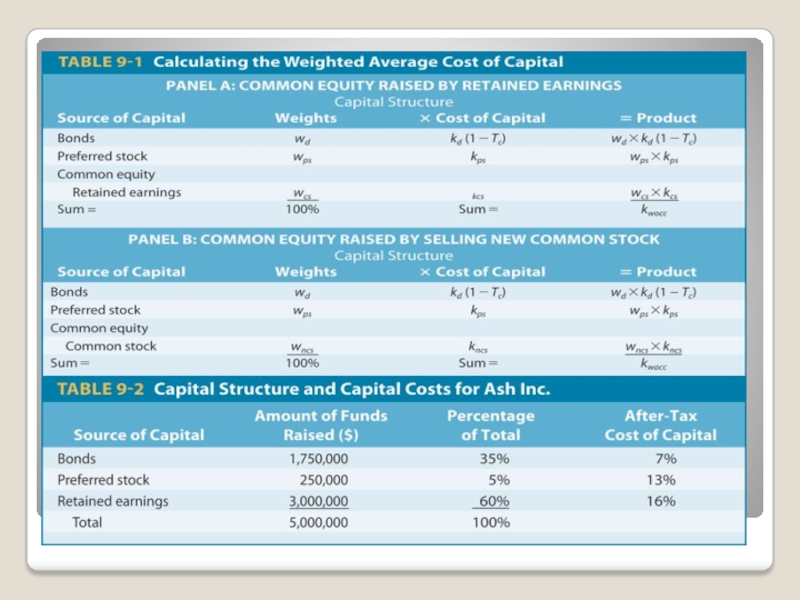
- 102. The Weighted Average Cost of Capital
- 103. The Weighted Average Cost of Capital
- 104. Business World Cost of capital In practice,
- 107. Divisional Costs of Capital Firms with multiple
- 108. Advantages of Divisional WACC Different discount rates
- 109. Using Pure Play Firms to Estimate Divisional
- 110. Divisional WACC Example Table 9-4 contains hypothetical
- 111. Divisional WACC – Estimation Issues and Limitations
- 112. Cost of Capital to Evaluate New
- 113. Figure 9-1
- 114. Capital Budgeting Meaning: The process of decision
- 115. Capital-Budgeting Decision Criteria The Payback Period Net Present Value Profitability Index Internal Rate of Return
- 116. The Payback Period Meaning: Number of years
- 117. Payback Period Example
- 118. The Payback Period - Trade-Offs Benefits:
- 119. Discounted Payback Period The discounted payback period
- 120. Discounted Payback Period Table 10-2 shows the
- 121. Discounted Payback Period
- 122. Net Present Value (NPV) NPV is equal
- 123. NPV Example Example: Project with an initial
- 124. NPV Trade-Offs Benefits Considers all cash flows
- 125. The Profitability Index (PI) (Benefit-Cost Ratio)
- 126. Profitability Index
- 127. Profitability Index Example A firm with a
- 128. Profitability Index Example PI = ($13,636 +
- 129. NPV and PI When the present value
- 130. Internal Rate of Return (IRR)
- 131. Figure 10-1
- 132. IRR and NPV If NPV is positive,
- 133. IRR Example Initial Outlay: $3,817 Cash flows:
- 134. Guidelines for Capital Budgeting To evaluate investment
- 135. Guidelines for Capital Budgeting Use Free Cash
- 136. CALCULATING A PROJECT’S FREE CASH FLOWS Three
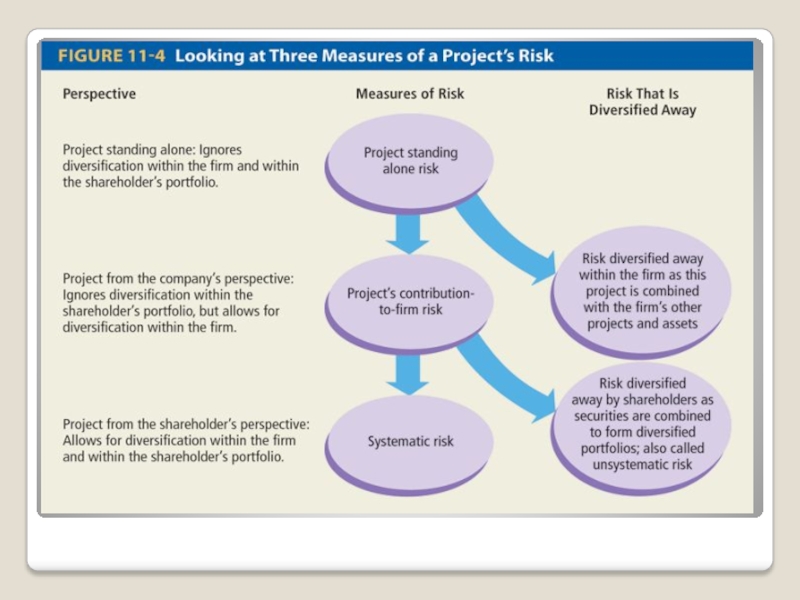
- 137. Three Perspectives on Risk Project standing alone risk Project’s contribution-to-firm risk Systematic risk
- 138. Project Standing Alone Risk This is a
- 139. Contribution-to-Firm Risk This is the amount of
- 140. Systematic Risk Risk of the project from
- 142. Relevant Risk Theoretically, the only risk of
- 143. Incorporating Risk into Capital Budgeting Investors
- 144. Risk Risk is variability associated with expected
- 145. Business Risk Business risk is the variation
- 146. Operating Risk Operating risk is the variation
- 147. Financial Risk Financial risk is the variation
- 148. Capital Structure Theory Theory focuses on the
- 149. Capital Structure Theory Figure 12-5 shows that
- 152. Capital Structure Theory The implication of these
- 153. Extensions to Independence Hypothesis: The Moderate Position
- 154. Impact of Taxes on Capital Structure Interest
- 155. Impact of Taxes on Capital Structure Since
- 156. Impact of Bankruptcy on Capital Structure The
- 158. Firm Value and Agency Costs
- 159. Managerial Implications Determining the firm’s financing mix
- 160. Dividends Dividends are distribution from the firm’s
- 161. Dividend Policy A firm’s dividend policy includes
- 162. Dividend-versus-Retention Trade-Offs
- 163. DOES DIVIDEND POLICY MATTER TO STOCKHOLDERS? There
- 164. View #1 Dividend policy is irrelevant
- 165. View #2 High dividends increase stock value
- 166. View #3 Low dividend increases stock values
- 167. Some Other Explanations The Residual Dividend Theory
- 168. Residual Dividend Theory Determine the optimal capital
- 169. The Clientele Effect Different groups of investors
- 170. The Information Effect Evidence shows that large,
- 171. Agency Costs Dividend policy may be perceived
- 172. The Expectations Theory Expectation theory suggests that
- 173. Conclusions on Dividend Policy Here are some
- 174. The Dividend Decision in Practice Legal Restrictions
- 175. The Dividend Decision in Practice - Alternative
- 176. The Dividend Decision in Practice - Alternative
- 177. Dividend Payment Procedures Generally, companies pay dividend
- 178. Important Dates Declaration date – The date
- 179. Stock Dividends A stock dividend entails the
- 180. Stock Splits A stock split involves exchanging
- 181. Stock Repurchases A stock repurchase (stock buyback)
- 182. Stock Repurchase -- Benefits A means of
- 183. A Share Repurchase as a Dividend, Financing,
- 184. Unsecured Sources: Trade Credit Trade credit arises
- 186. Effective Cost of Passing Up a
- 187. Unsecured Sources: Bank Credit Commercial banks
- 188. Line of Credit Informal agreement between a
- 189. Revolving Credit Revolving credit is a variant
- 190. Transaction Loans A transaction loan is made
- 191. Unsecured Sources: Commercial Paper The largest
- 192. Commercial Paper: Advantages Interest rates Rates are
- 193. Secured Sources of Loans Secured loans have
- 194. Pledging Accounts Receivable Borrower pledges accounts receivable
- 195. Pledging Accounts Receivable Credit Terms: Interest rate
- 196. Pledging Accounts Receivable Factoring accounts receivable involves
- 197. Secured Sources: Inventory Loans These are
- 198. Types of Inventory Loans Floating or Blanket
- 199. Working Capital Working capital - The firm’s
- 200. Managing Net Working Capital Managing net working
- 201. How Much Short-Term Financing Should a Firm
- 202. The Appropriate Level of Working Capital Managing
- 203. The Hedging Principle The hedging principle involves
- 205. Permanent and Temporary Assets Permanent investments
- 206. Temporary and Permanent Sources of Financing Temporary
- 208. The Cash Conversion Cycle A firm can
- 211. Cost of Short-Term Credit
- 212. APR example A company plans to borrow
- 213. Annual Percentage Yield (APY) APR does not
- 214. APY example In the previous example, #
- 215. APR or APY ? Because the differences

Слайд 2Examination paper format
Answer FOUR (4) out of SIX (6) questions
Each question
has a weighting of 25 marks.
 out of SIX (6) questionsEach question has a weighting")
Слайд 3
Question 1
(a) Calculation (10 marks)
(b) Theory : Discuss (15 marks)
(25 marks)
Question 2
(a) Calculation (13
marks)
(b) Theory : Discuss (12 marks)
(25 marks)
(b) Theory : Discuss (12 marks)
(25 marks)
 Calculation (10 marks)(b) Theory : Discuss (15 marks) (25 marks)Question 2 (a) Calculation (13 marks)(b) Theory : Discuss (12")
 Question 4Theory : Discuss (25 marks)")
Слайд 5
Question 5
Theory and show calculations to support theory:
Evaluate and analyze
and discuss (25 marks)
Question 6
a) Calculations (12 marks)
b) Calculations (5 marks)
c) Theory : Discuss (8 marks)
(25 marks)
Question 6
a) Calculations (12 marks)
b) Calculations (5 marks)
c) Theory : Discuss (8 marks)
(25 marks)

Слайд 6The Goal of the Firm
The goal of the firm is to
create value for the firm’s legal owners (that is, its shareholders). Thus the goal of the firm is to “maximize shareholder wealth” by maximizing the price of the existing common stock.
Good financial decisions will increase stock price and poor financial decisions will lead to a decline in stock price.
Good financial decisions will increase stock price and poor financial decisions will lead to a decline in stock price.

Слайд 73 Roles of Finance in Business
What long-term investments should the firm
undertake? (Capital budgeting decision)
How should the firm raise money to fund these investments? (Capital structure decision)
How to manage cash flows arising from day-to-day operations? (Working capital decision)
How should the firm raise money to fund these investments? (Capital structure decision)
How to manage cash flows arising from day-to-day operations? (Working capital decision)
How")


Слайд 10Sole Proprietorship
Business owned by an individual
Owner maintains title to assets and
profits
Unlimited liability
Termination occurs on owner’s death or by the owner’s choice
Unlimited liability
Termination occurs on owner’s death or by the owner’s choice

Слайд 11Partnership
Two or more persons come together as co-owners
General Partnership: All partners
are fully responsible for liabilities incurred by the partnership.
Limited Partnerships: One or more partners can have limited liability, restricted to the amount of capital invested in the partnership. There must be at least one general partner with unlimited liability. Limited partners cannot participate in the management of the business and their names cannot appear in the name of the firm.
Limited Partnerships: One or more partners can have limited liability, restricted to the amount of capital invested in the partnership. There must be at least one general partner with unlimited liability. Limited partners cannot participate in the management of the business and their names cannot appear in the name of the firm.

Слайд 12Corporation
Legally functions separate and apart from its owners
Corporation can sue, be
sued, purchase, sell, and own property
Owners (shareholders) dictate direction and policies of the corporation, oftentimes through elected board of directors.
Shareholder’s liability is restricted to amount of investment in company.
Life of corporation does not depend on the owners … corporation continues to be run by managers after transfer of ownership through sale or inheritance.

Слайд 13Hybrid Organizations: S-Corporation
Benefits
Limited liability
Taxed as partnership (no double taxation like corporations)
Limitations
Owners
must be people so cannot be used for a joint ventures between two corporations
LimitationsOwners must be people so")
Слайд 14Hybrid Organizations:
Limited Liability Companies (LLCs)
Benefits
Limited liability
Taxed like a partnership
Limitations
Qualifications
vary from state to state
Cannot appear like a corporation otherwise it will be taxed like one
Cannot appear like a corporation otherwise it will be taxed like one
BenefitsLimited liabilityTaxed like a partnership LimitationsQualifications vary from state to")
Слайд 15Finance and The Multinational Firm: The New Role
U.S. firms are looking
to international expansion to discover profits. For example, Coca-Cola earns over 80% of its profits from overseas sales.
In addition to US firms going abroad, we have also witnessed many foreign firms making their mark in the United States. For example, domination of auto industry by Honda, Toyota, and Nissan.
In addition to US firms going abroad, we have also witnessed many foreign firms making their mark in the United States. For example, domination of auto industry by Honda, Toyota, and Nissan.

Слайд 16Why Do Companies Go Abroad?
To increase revenues
To reduce expenses (land, labor,
capital, raw material, taxes)
To lower governmental regulation standards (ex. environmental, labor)
To increase global exposure
To lower governmental regulation standards (ex. environmental, labor)
To increase global exposure
To")
Слайд 17Risks/Challenges of Going Abroad
Country risk (changes in government regulations, unstable government,
economic changes in foreign country)
Currency risk (fluctuations in exchange rates)
Cultural risk (differences in language, traditions, ethical standards, etc.)
Currency risk (fluctuations in exchange rates)
Cultural risk (differences in language, traditions, ethical standards, etc.)

Слайд 18
What Is Liquidity?
Liquidity is the term used to describe how easy
it is to convert assets to cash. The most liquid asset, and what everything else is compared to, is cash. This is because it can always be used easily and immediately.

Слайд 19How Liquid Is the Firm?
A liquid asset is one that can
be converted quickly and routinely into cash at the current market price.
Liquidity measures the firm’s ability to pay its bills on time. It indicates the ease with which non-cash assets can be converted to cash to meet the financial obligations.
Liquidity is measured by two approaches:
Comparing the firm’s current assets and current liabilities
Examining the firm’s ability to convert accounts receivables and inventory into cash on a timely basis

Слайд 20Measuring Liquidity:
Perspective 1
Compare a firm’s current assets with current liabilities
using:
Current Ratio
Acid Test or Quick Ratio
Current Ratio
Acid Test or Quick Ratio


Слайд 23Current Ratio
Current ratio compares a firm’s current assets to its current
liabilities.
Equation:
Home Depot = $13,479M ÷ $10,122M = 1.33
Home Depot has $1.33 in current assets for every $1 in current liabilities. Home Depot’s liquidity is marginally lower than that of Lowe’s, which has a current ratio of 1.40.
Equation:
Home Depot = $13,479M ÷ $10,122M = 1.33
Home Depot has $1.33 in current assets for every $1 in current liabilities. Home Depot’s liquidity is marginally lower than that of Lowe’s, which has a current ratio of 1.40.

Слайд 24Acid Test or Quick Ratio
Quick ratio compares cash and current assets
(minus inventory) that can be converted into cash during the year with the liabilities that should be paid within the year.
Equation:
Home Depot = ($545M + $1,085M) ÷ ( $10,122M) = 0.16
Home Depot has 16 cents in quick assets for every $1 in current debt. Home Depot is more liquid than Lowe’s, which has 12 cents for every $1 in current debt.
Equation:
Home Depot = ($545M + $1,085M) ÷ ( $10,122M) = 0.16
Home Depot has 16 cents in quick assets for every $1 in current debt. Home Depot is more liquid than Lowe’s, which has 12 cents for every $1 in current debt.
 that can")
Слайд 25Measuring Liquidity:
Perspective 2
Measures a firm’s ability to convert accounts receivable and
inventory into cash:
Average Collection Period
Inventory Turnover
Average Collection Period
Inventory Turnover

")

Слайд 28
Certificates of deposit are slightly less liquid, because there is usually a
penalty for converting them to cash before their maturity date. Savings bonds are also quite liquid, since they can be sold at a bank fairly easily. Finally, shares of stock, bonds, options and commodities are considered fairly liquid, because they can usually be sold readily and you can receive the cash within a few days.

Слайд 29
Each of the above can be considered as cash or cash
equivalents because they can be converted to cash with little effort, although sometimes with a slight penalty. (For related reading, see The Money Market.)
Moving down the scale, we run into assets that take a bit more effort or time before they can be realized as cash. One example would be preferred orrestricted shares, which usually have covenants dictating how and when they might be sold.
Moving down the scale, we run into assets that take a bit more effort or time before they can be realized as cash. One example would be preferred orrestricted shares, which usually have covenants dictating how and when they might be sold.

Слайд 30
Other examples are items like coins, stamps, art and other collectibles.
If you were to sell to another collector, you might get full value but it could take a while, even with the internet easing the way. If you go to a dealer instead, you could get cash more quickly, but you may receive less of it.

Слайд 31
Cash is a company's lifeblood. In other words, a company can
sell lots of widgets and have good net earnings, but if it can't collect the actual cash from its customers on a timely basis, it will soon fold up, unable to pay its own obligations.
Several ratios look at how easily a company can meet its current obligations. One of these is the current ratio, which compares the level of current assets to current liabilities. Remember that in this context, "current" means collectible or payable within one year.
Several ratios look at how easily a company can meet its current obligations. One of these is the current ratio, which compares the level of current assets to current liabilities. Remember that in this context, "current" means collectible or payable within one year.

Слайд 32
Depending on the industry, companies with good liquidity will usually have
a current ratio of more than two. This shows that a company has the resources on hand to meet its obligations and is less likely to borrow money or enter bankruptcy.

Слайд 33
A more stringent measure is the quick ratio, sometimes called the acid
test ratio. This uses current assets (excluding inventory) and compares them to current liabilities. Inventory is removed because, of the various current assets such as cash, short-term investments or accounts receivable, this is the most difficult to convert into cash. A value of greater than one is usually considered good from a liquidity viewpoint, but this is industry dependent.

Слайд 34
One last ratio of note is the debt/equity ratio, usually defined as
total liabilities divided by stockholders' equity. While this does not measure a company's liquidity directly, it is related. Generally, companies with a higher debt/equity ratio will be less liquid, as more of their available cash must be used to service and reduce the debt. This leaves less cash for other purposes.

Слайд 35Are the Firm’s Managers Generating Adequate Operating Profits from the Company’s
Assets?
The focus is on the profitability of the assets in which the firm has invested. The following ratios are considered:
Operating Return on Assets
Operating Profit Margin
Total Asset Turnover
Fixed Assets Turnover

")
")


Слайд 40How Is the Firm Financing Its Assets?
Does the firm finance its
assets by debt or equity or both?
The following two ratios are considered:
Debt Ratio
Times Interest Earned
The following two ratios are considered:
Debt Ratio
Times Interest Earned


Слайд 42Times Interest Earned
This ratio indicates the amount of operating income available
to service interest payments.
Equation: Times Interest Earned = Operating Profits ÷ Interest Expense
Home Depot = $5,803M ÷ $530M = 10.9X
Home Depot’s operating income is nearly 11 times the annual interest expense and higher than Lowe’s (9X) due to its relatively higher operating profits.
Note:
Interest is not paid with income but with cash.
Oftentimes, firms are required to repay part of the principal annually.
Thus, times interest earned is only a crude measure of the firm’s capacity to service its debt.

Слайд 43Are the Firm’s Managers Providing a Good Return on the Capital
Provided by the Company’s Shareholders?

Слайд 44ROE
Home Depot = $3,338M ÷ $18,889M
= 0.177 or 17.7%
Owners of
Home Depot are receiving a higher return (17.7%) compared to Lowe’s (11.1%).
One of the reasons for higher ROE is the higher return on assets generated by Home Depot.
Also, Home Depot uses more debt. Higher debt translates to higher ROE under favorable business conditions.
One of the reasons for higher ROE is the higher return on assets generated by Home Depot.
Also, Home Depot uses more debt. Higher debt translates to higher ROE under favorable business conditions.


Слайд 46Limitations of
Financial Ratio Analysis
It is sometimes difficult to identify industry
categories or comparable peers.
The published peer group or industry averages are only approximations.
Industry averages may not provide a desirable target ratio.
Accounting practices differ widely among firms.
A high or low ratio does not automatically lead to a specific conclusion.
Seasons may bias the numbers in the financial statements.


Слайд 49Learning Objectives
Identify the basic characteristics of preferred stock.
Value preferred stock.
Identify the
basic characteristics of common stock.
Value common stock.
Calculate a stock’s expected rate of return.
Value common stock.
Calculate a stock’s expected rate of return.

Слайд 50Preferred Stock
Preferred stock is often referred to as a hybrid security
because it has many characteristics of both common stock and bonds.
Hybrid Nature of Preferred Stocks
Like common stocks, preferred stocks
have no fixed maturity date
failure to pay dividends does not lead to bankruptcy
dividends are not a tax-deductible expense
Like Bonds
dividends are fixed in amount (either as a $ amount or as a % of par value)
Hybrid Nature of Preferred Stocks
Like common stocks, preferred stocks
have no fixed maturity date
failure to pay dividends does not lead to bankruptcy
dividends are not a tax-deductible expense
Like Bonds
dividends are fixed in amount (either as a $ amount or as a % of par value)

Слайд 51Characteristics of Preferred Stocks
Multiple series of preferred stock
Preferred stock’s claim on
assets and income
Cumulative dividends
Protective provisions
Convertibility
Retirement provisions
Cumulative dividends
Protective provisions
Convertibility
Retirement provisions

Слайд 52Multiple Series
If a company desires, it can issue more than one
series of preferred stock, and each series can have different characteristics (such as different protective provisions and convertibility rights).

Слайд 53Claim on Assets and Income
Claim on Assets: Preferred stock has priority
over common stock with regard to claim on assets in the case of bankruptcy.
Preferred stockholders claims are honored before common stockholders, but after bonds.
Claim on Income: Preferred stock also has priority over common stock with regard to dividend payments.
Thus preferred stocks are safer than common stock but riskier than bonds.
Preferred stockholders claims are honored before common stockholders, but after bonds.
Claim on Income: Preferred stock also has priority over common stock with regard to dividend payments.
Thus preferred stocks are safer than common stock but riskier than bonds.

Слайд 54Cumulative Dividends
Cumulative feature (if it exists) requires that all past, unpaid
preferred stock dividends be paid before any common stock dividends are declared.
 requires that all past, unpaid preferred stock dividends be")
Слайд 55Protective Provisions
Protective provisions generally allow for voting rights in the event
of nonpayment of dividends, or they restrict the payment of common stock dividends if sinking-funds payments are not met or if the firm is in financial difficulty.
These protective provisions reduce the risk and consequently, expected return.
These protective provisions reduce the risk and consequently, expected return.

Слайд 56Convertibility
Convertible preferred stock can, at the discretion of the holder, be
converted into a predetermined number of shares of common stock.
Almost one-third of preferred stock issued today is convertible preferred.
Almost one-third of preferred stock issued today is convertible preferred.

Слайд 57Retirement Provisions
Although preferred stock has no set maturity associated with it,
issuing firms generally provide for some method of retiring the stock such as a call provision or sinking fund provision.
Call provision entitles the corporation to repurchase its preferred stock at stated prices over a given time period.
Sinking fund provision requires the firm to set aside an amount of money for the retirement of its preferred stock.
Call provision entitles the corporation to repurchase its preferred stock at stated prices over a given time period.
Sinking fund provision requires the firm to set aside an amount of money for the retirement of its preferred stock.

Слайд 58The economic or intrinsic value of a preferred stock is equal
to the present value of all future dividends.
Value of preferred stock: = Annual dividend/required rate of return
Value of preferred stock: = Annual dividend/required rate of return
V=3.75(1+0.03)/(0.06-0.03)=128.75

Слайд 59Common Stock
Common stock is a certificate that indicates ownership in a
corporation. When you buy a share, you buy a “part/share” of the company and attain ownership rights in proportion to your “share” of the company.
Common stockholders are the true owners of the firm. Bondholders and preferred stock holders can be viewed as creditors.
Common stockholders are the true owners of the firm. Bondholders and preferred stock holders can be viewed as creditors.

Слайд 60Claim on Income
Common shareholders have the right to residual income after
bondholders and preferred stockholders have been paid.
Residual income can be paid in the form of dividends or retained within the firm and reinvested in the business.
Claim on residual income implies there is no upper limit on income, but it also means that, on the downside, shareholders are not guaranteed anything and may have to settle for zero income in some years.

Слайд 61Claim on Assets
Common stock has a residual claim on assets in
the case of liquidation.
Residual claim implies that the claims of debt holders and preferred stockholders have to be met prior to common stockholders.
Generally, if bankruptcy occurs, claims of the common shareholders are typically not satisfied.
Residual claim implies that the claims of debt holders and preferred stockholders have to be met prior to common stockholders.
Generally, if bankruptcy occurs, claims of the common shareholders are typically not satisfied.

Слайд 62Limited Liability
The liability of shareholders is limited to the amount of
their investment.
The limited liability helps the firm in raising funds.
The limited liability helps the firm in raising funds.

Слайд 63Voting Rights
Most often, common stockholders are the only security holders with
a vote.
Majority of shareholders generally vote by proxy. Proxy fights are battles between rival groups for proxy votes.
Common shareholders are entitled to:
elect the board of directors
approve any change in the corporate charter
Voting for directors and charter changes occur at the corporation’s annual meeting.
With majority voting – each share of stock allows the shareholder one vote. Each position on the board is voted on separately.
With cumulative voting - each share of stock allows the stockholder a number of votes equal to the number of directors being elected.

Слайд 64Preemptive Rights
Preemptive right entitles the common shareholder to maintain a proportionate
share of ownership in the firm.
Thus, if a shareholder currently owns 5% of the shares, s/he has the right to purchase 5% of the shares when new shares are issued.
These rights are issued in the form of certificates that give shareholders the option to buy new shares at a specific price during a 2- to 10- week period. These rights can be exercised, sold in the open market, or allowed to expire.

Слайд 65Valuing Common Stock
Like bonds and preferred stock, the value of common
stock is equal to the present value of all future expected cash flows (i.e., dividends).
However, dividends are neither fixed nor guaranteed, which makes it harder to value common stocks compared to bonds and preferred stocks.
However, dividends are neither fixed nor guaranteed, which makes it harder to value common stocks compared to bonds and preferred stocks.

Слайд 66Dividend Model
Unlike preferred stock, common stock dividend is not fixed.
Dividend
pattern varies among firms, but dividends generally tend to increase with the growth in corporate earnings.
V=D1/(r-g)
V(ex-div)
V=D1/(r-g)
V(ex-div)

Слайд 67How Can a Company Grow?
Through Infusion of capital by borrowing
or issuing new common stock.
Through Internal growth. Management retains some or all of the firm’s profits for reinvestment in the firm, resulting in future earnings growth and value of stock.
Internal growth directly affects the existing stockholders and is the only growth factor used for valuation purposes.
Through Internal growth. Management retains some or all of the firm’s profits for reinvestment in the firm, resulting in future earnings growth and value of stock.
Internal growth directly affects the existing stockholders and is the only growth factor used for valuation purposes.

Слайд 68Plowback ratio pr
Internal Growth
g = ROE × pr
where:
g = the
growth rate of future earnings and the growth in the common stockholders’ investment in the firm
ROE = the return on equity (net income/common book value)
pr = % of profits retained (profit retention rate)
ROE = the return on equity (net income/common book value)
pr = % of profits retained (profit retention rate)

Слайд 69Dividend Valuation Model
Value of Common stock
= PV of future dividends
Vcs
= D1/(rcs– g)
Vcs = Common stock value
D1 = dividend in year 1
rcs = required rate of return
g = growth rate
Consider the valuation of a common stock that paid $1.00 dividend at the end of the last year and is expected to pay a cash dividend in the future. Dividends are expected to grow at 10% and the investors required rate of return is 17%.
The dividend last year was $1. Compute the new dividend (D1 ) by: D1 = D0(1 + g) = $1(1 + .10) = $1.10
2. Vcs = D1/(rcs – g) = $1.10/(.17 – .10) = $15.71
 Vcs =")
Слайд 70The Expected Rate of Return of Preferred Stockholders
The expected rate of
return on a security is the required rate of return of investors who are willing to pay the market price for the security.
Preferred Stock Expected Return: = Annual dividend/preferred stock market price
Example: If the current market price of preferred stock is $75, and the stock pays $5 dividend, the expected rate of return = $5/$75 = 6.67%
Preferred Stock Expected Return: = Annual dividend/preferred stock market price
Example: If the current market price of preferred stock is $75, and the stock pays $5 dividend, the expected rate of return = $5/$75 = 6.67%

 r-g= D1/P r=(D1/P)+g")
Слайд 72Price versus Expected Return
Typically, an investor is not concerned with the
value of a stock. Rather, investor would like to know the expected rate of return if the stock is bought at its current market price.
Given the price and expected rate of return, investor has to decide if the expected return compensates for the risk.
Given the price and expected rate of return, investor has to decide if the expected return compensates for the risk.

Слайд 73Bonds
Meaning: A bond is a type of debt or long-term promissory
note, issued by a borrower, promising to its holder a predetermined and fixed amount of interest per year and repayment of principal at maturity.
Bonds are issued by Corporations, Government, State and Local Municipalities
Bonds are issued by Corporations, Government, State and Local Municipalities

Слайд 74Debentures
Debentures are unsecured long-term debt.
For an issuing firm, debentures provide the
benefit of not tying up property as collateral.
For bondholders, debentures are more risky than secured bonds and provide a higher yield than secured bonds.
For bondholders, debentures are more risky than secured bonds and provide a higher yield than secured bonds.

Слайд 75Subordinated Debentures
There is a hierarchy of payout in case of insolvency.
The
claims of subordinated debentures are honored only after the claims of secured debt and unsubordinated debentures have been satisfied.

Слайд 76Mortgage Bonds
Mortgage bond is secured by a lien on real property.
Typically,
the value of the real property is greater than that of the bonds issued, providing bondholders a margin of safety.

Слайд 77Eurobonds
Securities (bonds) issued in a country different from the one in
whose currency the bond is denominated.
For example, a bond issued by an American corporation in Japan that pays interest and principal in dollars.
For example, a bond issued by an American corporation in Japan that pays interest and principal in dollars.
 issued in a country different from the one in whose currency the bond")
Слайд 78TERMINOLOGY AND CHARACTERISTICS OF BONDS
Claims on Assets and Income
Seniority in claims
In the case of insolvency, claims of debt, including bonds, are generally honored before those of common or preferred stock.

Слайд 79TERMINOLOGY AND CHARACTERISTICS OF BONDS
Par Value
Par value is the face value
of the bond, returned to the bondholder at maturity.
In general, corporate bonds are issued at denominations or par value of $1,000.
Prices are represented as a % of face value. Thus, a bond quoted at 112 can be bought at 112% of its par value in the market. Bonds will return the par value at maturity, regardless of the price paid at the time of purchase.

Слайд 80TERMINOLOGY AND CHARACTERISTICS OF BONDS
Coupon Interest Rate
The percentage of the par
value of the bond that will be paid periodically in the form of interest.
Example: A bond with a $1,000 par value and 5% annual coupon rate will pay $50 annually (=0.05*1000) or $25 (if interest is paid semiannually).
Example: A bond with a $1,000 par value and 5% annual coupon rate will pay $50 annually (=0.05*1000) or $25 (if interest is paid semiannually).

Слайд 81TERMINOLOGY AND CHARACTERISTICS OF BONDS
Zero Coupon Bonds
Zero coupon bonds have zero
or very low coupon rate. Instead of paying interest, the bonds are issued at a substantial discount below the par or face value.

Слайд 82TERMINOLOGY AND CHARACTERISTICS OF BONDS
Maturity
Maturity of bond refers to the length
of time until the bond issuer returns the par value to the bondholder and terminates or redeems the bond.

Слайд 83TERMINOLOGY AND CHARACTERISTICS OF BONDS
Call Provision
Call provision (if it exists on
a bond) gives a corporation the option to redeem the bonds before the maturity date. For example, if the prevailing interest rate declines, the firm may want to pay off the bonds early and reissue at a more favorable interest rate.
Issuer must pay the bondholders a premium.
There is also a call protection period where the firm cannot call the bond for a specified period of time.
Issuer must pay the bondholders a premium.
There is also a call protection period where the firm cannot call the bond for a specified period of time.
 gives a")
Слайд 84TERMINOLOGY AND CHARACTERISTICS OF BONDS
Indenture
An indenture is the legal agreement between
the firm issuing the bond and the trustee who represents the bondholders.
It provides for specific terms of the loan agreement (such as rights of bondholders and issuing firm).
Many of the terms seek to protect the status of bonds from being weakened by managerial actions or by other security holders.
It provides for specific terms of the loan agreement (such as rights of bondholders and issuing firm).
Many of the terms seek to protect the status of bonds from being weakened by managerial actions or by other security holders.

Слайд 85TERMINOLOGY AND CHARACTERISTICS OF BONDS
Bond Ratings
Bond ratings reflect the future risk
potential of the bonds.
Three prominent bond rating agencies are Standard & Poor’s, Moody’s, and Fitch Investor Services.
Lower bond rating indicates higher probability of default. It also means that the rate of return demanded by the capital markets will be higher on such bonds.
Three prominent bond rating agencies are Standard & Poor’s, Moody’s, and Fitch Investor Services.
Lower bond rating indicates higher probability of default. It also means that the rate of return demanded by the capital markets will be higher on such bonds.


Слайд 87TERMINOLOGY AND CHARACTERISTICS OF BONDS
Factors Having a Favorable Effect on Bond
Rating
A greater reliance on equity as opposed to debt in financing the firm
Profitable operations
Low variability in past earnings
Large firm size
Minimal use of subordinated debt
A greater reliance on equity as opposed to debt in financing the firm
Profitable operations
Low variability in past earnings
Large firm size
Minimal use of subordinated debt

Слайд 88TERMINOLOGY AND CHARACTERISTICS OF BONDS
Junk Bonds
Junk bonds are high-risk bonds with
ratings of BB or below by Moody’s and Standard & Poor’s.
Junk bonds are also referred to as high-yield bonds as they pay a high interest rate, generally 3 to 5% more than AAA-rated bonds.
Junk bonds are also referred to as high-yield bonds as they pay a high interest rate, generally 3 to 5% more than AAA-rated bonds.

Слайд 89Capital
Capital represents the funds used to finance a firm's assets and
operations. Capital constitutes all items on the right hand side of balance sheet, i.e., liabilities and common equity.
Main sources: Debt, Preferred stock, Retained earnings and Common Stock
Main sources: Debt, Preferred stock, Retained earnings and Common Stock

Слайд 90
Cost of Capital
The firm’s cost of capital is also referred to
as the firm’s Opportunity cost of capital.

Слайд 91Investor’s Required Rate of Return
Investor’s Required Rate of Return – the
minimum rate of return necessary to attract an investor to purchase or hold a security.
Investor’s required rate of return is not the same as cost of capital due to taxes and transaction costs.
Impact of taxes: For example, a firm may pay 8% interest on debt but due to tax benefit on interest expense, the net cost to the firm will be lower than 8%.
Impact of transaction costs on cost of capital: For example, If a firm sells new stock for $50.00 a share and incurs $5 in flotation costs, and the investors have a required rate of return of 15%, what is the cost of capital?
The firm has only $45.00 to invest after transaction cost. 0.15 × $50.00 = $7.5 k = $7.5/($45.00) = 0.1667 or 16.67% (rather than 15%)

Слайд 92Financial Policy
A firm’s financial policy indicates the desired sources of financing
and the particular mix in which it will be used.
For example, a firm may choose to raise capital by issuing stocks and bonds in the ratio of 6:4 (60% stocks and 40% bonds). The choice of mix will impact the cost of capital.
For example, a firm may choose to raise capital by issuing stocks and bonds in the ratio of 6:4 (60% stocks and 40% bonds). The choice of mix will impact the cost of capital.


Слайд 94The Cost of Debt
See Example 9.1
Investor’s required rate of return on
a 8% 20-year bond trading for $908.32= 9%
After-tax cost of debt = Cost of debt*(1-tax rate)
At 34% tax bracket = 9.73*(1 – 0.34) = 6.422%
After-tax cost of debt = Cost of debt*(1-tax rate)
At 34% tax bracket = 9.73*(1 – 0.34) = 6.422%

Слайд 95The Cost of Preferred Stock
If flotation costs are incurred, preferred stockholder’s
required rate of return will be less than the cost of preferred capital to the firm.
Thus, in order to determine the cost of preferred stock, we adjust the price of preferred stock for flotation cost to give us the net proceeds.
Net proceeds = issue price – flotation cost
Cost of Preferred Stock:
Pn = net proceeds (i.e., Issue price – flotation costs)
Dp = preferred stock dividend per share
Example: Determine the cost for a preferred stock that pays annual dividend of $4.25, has current stock price $58.50, and incurs flotation costs of $1.375 per share.
Cost = $4.25/(58.50 – 1.375) = 0.074 or 7.44%

Слайд 96The Cost of Common Equity
Cost of equity is more challenging to
estimate than the cost of debt or the cost of preferred stock because common stockholder’s rate of return is not fixed as there is no stated coupon rate or dividend.
Furthermore, the costs will vary for two sources of equity (i.e., retained earnings and new issue).
There are no flotation costs on retained earnings but the firm incurs costs when it sells new common stock.
Note that retained earnings are not a free source of capital. There is an opportunity cost.
Furthermore, the costs will vary for two sources of equity (i.e., retained earnings and new issue).
There are no flotation costs on retained earnings but the firm incurs costs when it sells new common stock.
Note that retained earnings are not a free source of capital. There is an opportunity cost.

Слайд 97Cost Estimation Techniques
Two commonly used methods for estimating common stockholder’s required
rate of return are:
The Dividend Growth Model
The Capital Asset Pricing Model
The Dividend Growth Model
The Capital Asset Pricing Model

Слайд 98The Dividend Growth Model
Investors’ required rate of return
(For Retained Earnings):
D1
= Dividends expected one year hence
Pcs = Price of common stock
g = growth rate
Investors’ required rate of return (For new issues)
D1 = Dividends expected one year hence
Pcs = Net proceeds per share
g = growth rate
Pcs = Price of common stock
g = growth rate
Investors’ required rate of return (For new issues)
D1 = Dividends expected one year hence
Pcs = Net proceeds per share
g = growth rate
:D1 = Dividends expected one")
Слайд 99The Dividend Growth Model
Example: A company expects dividends this year to
be $1.10, based upon the fact that $1 were paid last year. The firm expects dividends to grow 10% next year and into the foreseeable future. Stock is trading at $35 a share.
Cost of retained earnings:
Kcs = D1/Pcs + g
1.1/35 + 0.10 = 0.1314 or 13.14%
Cost of new stock (with a $3 flotation cost):
Kncs = D1/NPcs + g
1.10/(35 – 3) + 0.10 = 0.1343 or 13.43%
Dividend growth model is simple to use but suffers from the following drawbacks:
It assumes a constant growth rate
It is not easy to forecast the growth rate

Слайд 100The Capital Asset Pricing Model
Example: If beta is 1.25, risk-free
rate is 1.5% and expected return on market is 10%
kc = rrf + β(rm – rf)
= 0.015 + 1.25(0.10 – 0.015)
= 12.125%
kc = rrf + β(rm – rf)
= 0.015 + 1.25(0.10 – 0.015)
= 12.125%

Слайд 101Capital Asset Pricing Model Variable Estimates
CAPM is easy to apply. Also,
the estimates for model variables are generally available from public sources.
Risk-Free Rate: Wide range of U.S. government securities on which to base risk-free rate
Beta: Estimates of beta are available from a wide range of services, or can be estimated using regression analysis of historical data.
Market Risk Premium: It can be estimated by looking at history of stock returns and premium earned over risk-free rate.

Слайд 102The Weighted Average
Cost of Capital
Bringing it all together: WACC
To estimate
WACC, we need to know the capital structure mix and the cost of each of the sources of capital.
For a firm with only two sources: debt and common equity,
For a firm with only two sources: debt and common equity,


Слайд 104Business World Cost of capital
In practice, the calculation of cost of
capital may be more complex:
If firms have multiple debt issues with different required rates of return.
If firms also use preferred stock in addition to common stock financing.
If firms have multiple debt issues with different required rates of return.
If firms also use preferred stock in addition to common stock financing.

Слайд 107Divisional Costs of Capital
Firms with multiple operating divisions often have unique
risks and different costs of capital for each division.
Consequently, the WACC used in each division is potentially unique for each division.
Consequently, the WACC used in each division is potentially unique for each division.

Слайд 108Advantages of Divisional WACC
Different discount rates reflect differences in the systematic
risk of the projects evaluated by different divisions.
It entails calculating one cost of capital for each division (rather than each project).
Divisional cost of capital limits managerial latitude and the attendant influence costs.
It entails calculating one cost of capital for each division (rather than each project).
Divisional cost of capital limits managerial latitude and the attendant influence costs.

Слайд 109Using Pure Play Firms to Estimate Divisional WACCs
Divisional cost of capital
can be estimated by identifying “pure play” comparison firms that operate in only one of the individual business areas.
For example, Valero Energy Corp. may use the WACC estimate of firms that operate in the refinery industry to estimate the WACC of its division engaged in refining crude oil.
For example, Valero Energy Corp. may use the WACC estimate of firms that operate in the refinery industry to estimate the WACC of its division engaged in refining crude oil.

Слайд 110Divisional WACC Example
Table 9-4 contains hypothetical estimates of the divisional WACC
for the refining and retail (convenience store) industries.
Panel A: Cost of debt (tax=38%)
Panel B: Cost of equity (betas differ)
Panels D & E: Divisional WACCs
Panel A: Cost of debt (tax=38%)
Panel B: Cost of equity (betas differ)
Panels D & E: Divisional WACCs

Слайд 111Divisional WACC – Estimation Issues and Limitations
Sample chosen may not be
a good match for the firm or one of its divisions due to differences in capital structure, and/or project risk.
Good comparison firms for a particular division may be difficult to find.
Good comparison firms for a particular division may be difficult to find.

Слайд 112Cost of Capital to Evaluate
New Capital Investments
Cost of capital can
serve as the discount rate in evaluating new investment when the projects offer the same risk as the firm as a whole.
If risk differs, it is better to calculate a different cost of capital for each division. Figure 9-1 illustrates the danger of not doing so.
If risk differs, it is better to calculate a different cost of capital for each division. Figure 9-1 illustrates the danger of not doing so.


Слайд 114Capital Budgeting
Meaning: The process of decision making with respect to investments
in fixed assets—that is, should a proposed project be accepted or rejected.
It is easier to“evaluate” profitable projects than to“find them”
Source of Ideas for Projects
R&D: Typically, a firm has a research & development (R&D) department that searches for ways of improving existing products or finding new projects.
Other sources: Employees, Competition, Suppliers, Customers.

Слайд 115Capital-Budgeting Decision Criteria
The Payback Period
Net Present Value
Profitability Index
Internal Rate of Return

Слайд 116The Payback Period
Meaning: Number of years needed to recover the initial
cash outlay related to an investment.
Decision Rule: Project is considered feasible or desirable if the payback period is less than or equal to the firm’s maximum desired payback period. In general, shorter payback period is preferred while comparing two projects.
Decision Rule: Project is considered feasible or desirable if the payback period is less than or equal to the firm’s maximum desired payback period. In general, shorter payback period is preferred while comparing two projects.


Слайд 118The Payback Period - Trade-Offs
Benefits:
Uses cash flows rather than accounting
profits
Easy to compute and understand
Useful for firms that have capital constraints
Drawbacks:
Ignores the time value of money
Does not consider cash flows beyond the payback period
Easy to compute and understand
Useful for firms that have capital constraints
Drawbacks:
Ignores the time value of money
Does not consider cash flows beyond the payback period

Слайд 119Discounted Payback Period
The discounted payback period is similar to the traditional
payback period except that it uses discounted free cash flows rather than actual undiscounted cash flows.
The discounted payback period is defined as the number of years needed to recover the initial cash outlay from the discounted free cash flows.
The discounted payback period is defined as the number of years needed to recover the initial cash outlay from the discounted free cash flows.

Слайд 120Discounted Payback Period
Table 10-2 shows the difference between traditional payback and
discounted payback methods.
With undiscounted free cash flows, the payback period is only 2 years, while with discounted free cash flows (at 17%), the discounted payback period is 3.07 years.
With undiscounted free cash flows, the payback period is only 2 years, while with discounted free cash flows (at 17%), the discounted payback period is 3.07 years.


Слайд 122Net Present Value (NPV)
NPV is equal to the present value of
all future free cash flows less the investment’s initial outlay. It measures the net value of a project in today’s dollars.
NPV is equal to the present value of all future free cash")
Слайд 123NPV Example
Example: Project with an initial cash outlay of $60,000 with
following free cash flows for 5 years.
Year FCF Year FCF
Initial outlay –60,000 3 13,000
1 –25,000 4 12,000
2 –24,000 5 11,000
The firm has a 15% required rate of return.
PV of FCF = $60,764
Subtracting the initial cash outlay of $60,000 leaves an NPV of $764.
Since NPV > 0, project is feasible.
Year FCF Year FCF
Initial outlay –60,000 3 13,000
1 –25,000 4 12,000
2 –24,000 5 11,000
The firm has a 15% required rate of return.
PV of FCF = $60,764
Subtracting the initial cash outlay of $60,000 leaves an NPV of $764.
Since NPV > 0, project is feasible.

Слайд 124NPV Trade-Offs
Benefits
Considers all cash flows
Recognizes time value of money
Drawbacks
Requires detailed
long-term forecast of cash flows
NPV is generally considered to be the most theoretically correct criterion for evaluating capital budgeting projects.
NPV is generally considered to be the most theoretically correct criterion for evaluating capital budgeting projects.

Слайд 125The Profitability Index (PI)
(Benefit-Cost Ratio)
The profitability index (PI) is the
ratio of the present value of the future free cash flows (FCF) to the initial outlay.
It yields the same accept/reject decision as NPV.
It yields the same accept/reject decision as NPV.
 (Benefit-Cost Ratio) The profitability index (PI) is the ratio of the")

Слайд 127Profitability Index Example
A firm with a 10% required rate of return
is considering investing in a new machine with an expected life of six years. The initial cash outlay is $50,000.

Слайд 128Profitability Index Example
PI = ($13,636 + $6,612 + $7,513 +
$8,196 + $8,693 + $9,032) / $50,000
= $53,682/$50,000
= 1.0736
Project’s PI is greater than 1. Therefore, accept.
= $53,682/$50,000
= 1.0736
Project’s PI is greater than 1. Therefore, accept.

Слайд 129NPV and PI
When the present value of a project’s free cash
inflows are greater than the initial cash outlay, the project NPV will be positive. PI will also be greater than 1.
NPV and PI will always yield the same decision.
NPV and PI will always yield the same decision.

Слайд 130Internal Rate of Return (IRR)
Decision Rule:
If IRR ≥ Required Rate
of Return, accept
If IRR < Required Rate of Return, reject
If IRR < Required Rate of Return, reject
Decision Rule: If IRR ≥ Required Rate of Return, acceptIf IRR")

Слайд 132IRR and NPV
If NPV is positive, IRR will be greater than
the required rate of return
If NPV is negative, IRR will be less than required rate of return
If NPV = 0, IRR is the required rate of return.
If NPV is negative, IRR will be less than required rate of return
If NPV = 0, IRR is the required rate of return.

Слайд 133IRR Example
Initial Outlay: $3,817
Cash flows: Yr. 1 = $1,000, Yr. 2
= $2,000, Yr. 3 = $3,000
Discount rate NPV
15% $4,356
20% $3,958
22% $3,817
IRR is 22% because the NPV equals the initial cash outlay at that rate.
Discount rate NPV
15% $4,356
20% $3,958
22% $3,817
IRR is 22% because the NPV equals the initial cash outlay at that rate.

Слайд 134Guidelines for Capital Budgeting
To evaluate investment proposals, we must first set
guidelines by which we measure the value of each proposal.
We must know what is and what isn’t relevant cash flow.
We must know what is and what isn’t relevant cash flow.

Слайд 135Guidelines for Capital Budgeting
Use Free Cash Flows Rather than Accounting Profits
Think
Incrementally
Beware of Cash Flows Diverted From Existing Products
Look for Incidental or Synergistic Effects
Work in Working-Capital Requirements
Consider Incremental Expenses
Sunk Costs Are Not Incremental Cash Flows
Account for Opportunity Costs
Decide If Overhead Costs Are Truly Incremental Cash Flows
Ignore Interest Payments and Financing Flows

Слайд 136CALCULATING A PROJECT’S FREE CASH FLOWS
Three components of free cash flows:
The
initial outlay,
The annual free cash flows over the project’s life, and
The terminal free cash flow
The annual free cash flows over the project’s life, and
The terminal free cash flow

Слайд 137Three Perspectives on Risk
Project standing alone risk
Project’s contribution-to-firm risk
Systematic risk

Слайд 138Project Standing Alone Risk
This is a project’s risk ignoring the fact
that much of the risk will be diversified away as the project is combined with other projects and assets.
This is an inappropriate measure of risk for capital-budgeting projects.
This is an inappropriate measure of risk for capital-budgeting projects.

Слайд 139Contribution-to-Firm Risk
This is the amount of risk that the project contributes
to the firm as a whole.
This measure considers the fact that some of the project’s risk will be diversified away as the project is combined with the firm’s other projects and assets but ignores the effects of the diversification of the firm’s shareholders.
This measure considers the fact that some of the project’s risk will be diversified away as the project is combined with the firm’s other projects and assets but ignores the effects of the diversification of the firm’s shareholders.

Слайд 140Systematic Risk
Risk of the project from the viewpoint of a well-diversified
shareholder.
This measure takes into account that some of the risk will be diversified away as the project is combined with the firm’s other projects and in addition, some of the remaining risk will be diversified away by the shareholders as they combine this stock with other stocks in their portfolios.
This measure takes into account that some of the risk will be diversified away as the project is combined with the firm’s other projects and in addition, some of the remaining risk will be diversified away by the shareholders as they combine this stock with other stocks in their portfolios.

Слайд 142Relevant Risk
Theoretically, the only risk of concern to shareholders is systematic
risk.
Since the project’s contribution-to-firm risk affects the probability of bankruptcy for the firm, it is a relevant risk measure.
Thus we need to consider both the project’s contribution-to-firm risk and the project’s systematic risk.
Since the project’s contribution-to-firm risk affects the probability of bankruptcy for the firm, it is a relevant risk measure.
Thus we need to consider both the project’s contribution-to-firm risk and the project’s systematic risk.

Слайд 143Incorporating Risk into
Capital Budgeting
Investors demand higher returns for more risky
projects.
As the risk of a project increases, the required rate of return is adjusted upward to compensate for the added risk.
This risk-adjusted discount rate is then used for discounting free cash flows (in NPV model) or as the benchmark required rate of return (in IRR model).
As the risk of a project increases, the required rate of return is adjusted upward to compensate for the added risk.
This risk-adjusted discount rate is then used for discounting free cash flows (in NPV model) or as the benchmark required rate of return (in IRR model).

Слайд 144Risk
Risk is variability associated with expected revenue or income streams. Such
variability may arise due to:
Choice of business line (business risk)
Choice of an operating cost structure (operating risk)
Choice of a capital structure (financial risk)
Choice of business line (business risk)
Choice of an operating cost structure (operating risk)
Choice of a capital structure (financial risk)

Слайд 145Business Risk
Business risk is the variation in the firm’s expected earnings
attributable to the industry in which the firm operates. There are four determinants of business risk:
The stability of the domestic economy
The exposure to, and stability of, foreign economies
Sensitivity to the business cycle
Competitive pressures in the firm’s industry
The stability of the domestic economy
The exposure to, and stability of, foreign economies
Sensitivity to the business cycle
Competitive pressures in the firm’s industry

Слайд 146Operating Risk
Operating risk is the variation in the firm’s operating earnings
that results from firm’s cost structure (mix of fixed and variable operating costs).
Earnings of firms with higher proportion of fixed operating costs are more vulnerable to change in revenues.
Earnings of firms with higher proportion of fixed operating costs are more vulnerable to change in revenues.

Слайд 147Financial Risk
Financial risk is the variation in earnings as a result
of firm’s financing mix or proportion of financing that requires a fixed return.

Слайд 148Capital Structure Theory
Theory focuses on the effect of financial leverage on
the overall cost of capital to the enterprise.
In other words, Can the firm affect its overall cost of funds, either favorably or unfavorably, by varying the mixture of financing used?
According to Modigliani & Miller, the total value of the firm is not influenced by the firm’s capital structure. In other words, the financing decision is irrelevant!
Their conclusions were based on restrictive assumptions (such as no taxes, capital structure consisting of only stocks and bonds, perfect or efficient markets).
Firms strive to minimize the cost of using financial capital so as to maximize shareholder’s wealth.

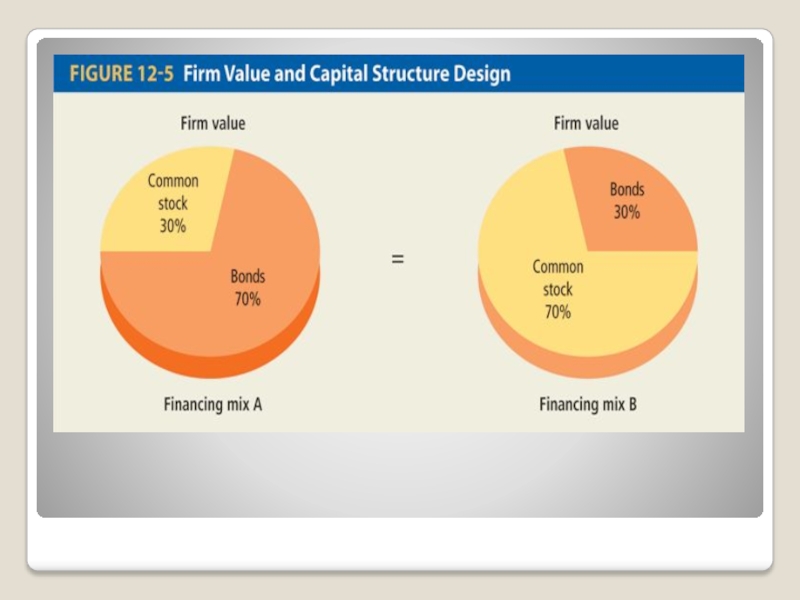
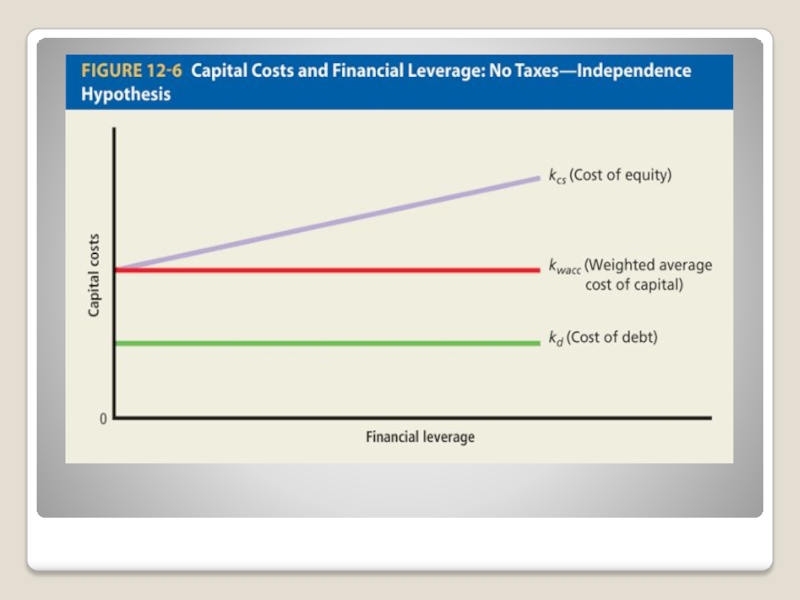
Слайд 149Capital Structure Theory
Figure 12-5 shows that the firm’s value remains the
same, despite the differences in financing mix.
Figure 12-6 shows that the firm’s cost of capital remains constant, although cost of equity rises with increased leverage.
Figure 12-6 shows that the firm’s cost of capital remains constant, although cost of equity rises with increased leverage.

Слайд 152Capital Structure Theory
The implication of these figures for financial managers is
that one capital structure is just as good as any other.
However, the above conclusion is possible only under strict assumptions.
We next turn to a market and legal environment that relaxes these restrictive assumptions.
However, the above conclusion is possible only under strict assumptions.
We next turn to a market and legal environment that relaxes these restrictive assumptions.

Слайд 153Extensions to Independence Hypothesis: The Moderate Position
The moderate position considers how
the capital structure decision is affected when we consider:
Interest expense is tax deductible (a benefit of debt)
Debt financing increases the risk of default (a disadvantage of debt)
Combining the above (benefit & drawback) provides a conceptual basis for designing a prudent capital structure.
Interest expense is tax deductible (a benefit of debt)
Debt financing increases the risk of default (a disadvantage of debt)
Combining the above (benefit & drawback) provides a conceptual basis for designing a prudent capital structure.

Слайд 154Impact of Taxes on Capital Structure
Interest expense is tax deductible.
Because interest
is deductible, the use of debt financing should result in higher total market value for firms outstanding securities.
Tax shield benefit = rd(m)(t) r = rate, m = principal, t = marginal tax rate
Tax shield benefit = rd(m)(t) r = rate, m = principal, t = marginal tax rate

Слайд 155Impact of Taxes on Capital Structure
Since interest on debt is tax
deductible, the higher the interest expense, the lower the taxes.
Thus, one could suggest that firms should maximize debt … indeed, firms should go for 100% debt to maximize tax shield benefits!!
But we generally do not see 100% debt in the real world … why not?
One possible explanation is:
Bankruptcy costs
Thus, one could suggest that firms should maximize debt … indeed, firms should go for 100% debt to maximize tax shield benefits!!
But we generally do not see 100% debt in the real world … why not?
One possible explanation is:
Bankruptcy costs

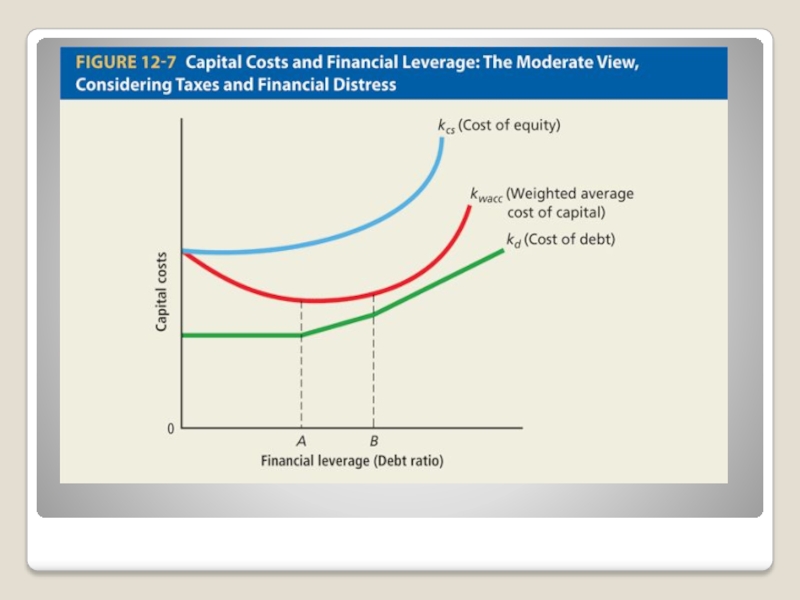
Слайд 156Impact of Bankruptcy on Capital Structure
The probability that a firm will
be unable to meet its debt obligations increases with debt. Thus probability of bankruptcy (and hence costs) increase with increased leverage. Threat of financial distress causes the cost of debt to rise.
As financial conditions weaken, expected costs of default can be large enough to outweigh the tax shield benefit of debt financing.
So, higher debt does not always lead to a higher value … after a point, debt reduces the value of the firm to shareholders.
This explains a firm’s tendency to restrain itself from maximizing the use of debt.
Debt capacity indicates the maximum proportion of debt the firm can include in its capital structure and still maintain its lowest composite cost of capital (see Figure 12-7).


Слайд 159Managerial Implications
Determining the firm’s financing mix is critically important for the
manager.
The decision to maximize the market value of leveraged firm is influenced primarily by the present value of tax shield benefits, present value of bankruptcy costs, and present value of agency costs.
The decision to maximize the market value of leveraged firm is influenced primarily by the present value of tax shield benefits, present value of bankruptcy costs, and present value of agency costs.

Слайд 160Dividends
Dividends are distribution from the firm’s assets to the shareholders.
Firms
are not obligated to pay dividends or maintain a consistent policy with regard to dividends.
Dividends could be paid in: cash or stocks
Dividends could be paid in: cash or stocks

Слайд 161Dividend Policy
A firm’s dividend policy includes two components:
Dividend Payout ratio
Indicates amount
of dividend paid relative to the company’s earnings.
Example: If dividend per share is $1 and earnings per share is $4, the payout ratio is 25% (1/4)
Stability of dividends over time
Trade-Offs:
If management has decided how much to invest and has chosen the debt-equity mix, decision to pay a large dividend means retaining less of the firm’s profits. This means the firm will have to rely more on external equity financing.
Similarly, a smaller dividend payment will lead to less reliance on external financing.


Слайд 163DOES DIVIDEND POLICY MATTER TO STOCKHOLDERS?
There are three basic views with
regard to the impact of dividend policy on share prices:
Dividend policy is irrelevant
High dividends will increase share prices
Low dividends will increase share prices
Dividend policy is irrelevant
High dividends will increase share prices
Low dividends will increase share prices

Слайд 164View #1
Dividend policy is irrelevant
Irrelevance implies shareholder wealth is not
affected by dividend policy (whether the firm pays 0% or 100% of its earnings as dividends).
This view is based on two assumptions: (a) Perfect capital markets; and (b) Firm’s investment and borrowing decisions have been made and will not be altered by dividend payment.
This view is based on two assumptions: (a) Perfect capital markets; and (b) Firm’s investment and borrowing decisions have been made and will not be altered by dividend payment.

Слайд 165View #2
High dividends increase stock value
This position in based on “bird-in-the-hand
theory,” which argues that investors may prefer “dividend today” as it is less risky compared to “uncertain future capital gains.”
This implies a higher required rate for discounting a dollar of capital gain than a dollar of dividends.
This implies a higher required rate for discounting a dollar of capital gain than a dollar of dividends.

Слайд 166View #3
Low dividend increases stock values
In 2003, the tax rates
on capital gains and dividends were made equal to 15 percent.
However, current dividends are taxed immediately while the tax on capital gains can be deferred until the stock is actually sold. Thus, using present value of money, capital gains have definite financial advantage for shareholders.
Thus stocks that allow tax deferral (i.e., low dividends and high capital gains) will possibly sell at a premium relative to stocks that require current taxation (i.e., high dividends and low capital gains).

Слайд 167Some Other Explanations
The Residual Dividend Theory
Clientele Effect
The Information Effect
Agency Costs
The Expectations
Theory

Слайд 168Residual Dividend Theory
Determine the optimal capital budget
Determine the amount of equity
needed for financing
First, use retained earnings to supply this equity
If retained earnings still available, distribute the residual as dividends.
Dividend Policy will be influenced by: (a) investment opportunities or capital budgeting needs, and (b) availability of internally generated capital.
First, use retained earnings to supply this equity
If retained earnings still available, distribute the residual as dividends.
Dividend Policy will be influenced by: (a) investment opportunities or capital budgeting needs, and (b) availability of internally generated capital.

Слайд 169The Clientele Effect
Different groups of investors have varying preferences towards dividends.
For
example, some investors may prefer a fixed income stream so would prefer firms with high dividends while some investors, such as wealthy investors, would prefer to defer taxes and will be drawn to firms that have low dividend payout. Thus there will be a clientele effect.

Слайд 170The Information Effect
Evidence shows that large, unexpected change in dividends can
have a significant impact on the stock prices.
A firm’s dividend policy may be seen as a signal about firm’s financial condition. Thus, high dividend could signal expectations of high earnings in the future and vice versa.
A firm’s dividend policy may be seen as a signal about firm’s financial condition. Thus, high dividend could signal expectations of high earnings in the future and vice versa.

Слайд 171Agency Costs
Dividend policy may be perceived as a tool to minimize
agency costs.
Dividend payment may require managers to issue stock to finance new investments. New investors will be attracted only if they are convinced that the capital will be used profitably. Thus, payment of dividends indirectly monitors management’s investment activities and helps reduce agency costs, and may enhance the value of the firm.
Dividend payment may require managers to issue stock to finance new investments. New investors will be attracted only if they are convinced that the capital will be used profitably. Thus, payment of dividends indirectly monitors management’s investment activities and helps reduce agency costs, and may enhance the value of the firm.

Слайд 172The Expectations Theory
Expectation theory suggests that the market reaction does not
only reflect response to the firms actions, it also indicates investors’ expectations about the ultimate decision to be made by management.
Thus if the amount of dividend paid is equal to the dividend expected by shareholders, the market price of stock will remain unchanged. However, market will react if dividend payment is not consistent with shareholders expectations.
Thus deviation from expectations is more important than actual dividend payment.

Слайд 173Conclusions on Dividend Policy
Here are some conclusions about the relevance of
dividend policy:
As a firm’s investment opportunities increase, its dividend payout ratio should decrease.
Investors use the dividend payment as a source of information of expected earnings.
Relationship between stock prices and dividends may exist due to implications of dividends for taxes and agency costs.
Based on expectations theory, firms should avoid surprising investors with regard to dividend policy.
The firm’s dividend policy should effectively be treated as a long-term residual.

Слайд 174The Dividend Decision in Practice
Legal Restrictions
Statutory restrictions may prevent a company
from paying dividends.
Debt and preferred stock contracts may impose constraints on dividend policy.
Liquidity Constraints
A firm may show large amount of retained earnings but it must have cash to pay dividends.
Earnings Predictability
A firms with stable and predictable earnings is more likely to pay larger dividends.
Maintaining Ownership Control
Ownership of common stock gives voting rights. If existing stockholders are unable to participate in a new offering, control of current stockholders is diluted and issuing new stock will be considered unattractive.

Слайд 175The Dividend Decision in Practice - Alternative Dividend Policies
Constant dividend payout
ratio
The percentage of earnings paid out in dividends is held constant.
Since earnings are not constant, the dollar amount of dividend will vary every year.
Stable dollar dividend per share
This policy maintains a relatively constant dollar of dividend every year.
Management will increase the dollar amount only if they are convinced that such increase can be maintained.

Слайд 176The Dividend Decision in Practice - Alternative Dividend Policies
A small regular
dividend plus a year-end extra
The company follows the policy of paying a small, regular dividend plus a year-end extra dividend in prosperous years.
The company follows the policy of paying a small, regular dividend plus a year-end extra dividend in prosperous years.

Слайд 177Dividend Payment Procedures
Generally, companies pay dividend on a quarterly basis. The
final approval of a dividend payment comes from the firm’s board of directors.
For example, on February 6, 2009, GE announced that it would pay quarterly dividend of $0.31 each to its shareholders for 2009. The annual dividend would be $0.31*4 = $1.24 per share.
For example, on February 6, 2009, GE announced that it would pay quarterly dividend of $0.31 each to its shareholders for 2009. The annual dividend would be $0.31*4 = $1.24 per share.

Слайд 178Important Dates
Declaration date – The date when the dividend is formally
declared by the board of directors
(for example, February 6)
Date of record – Investors shown to own stocks on this date receive the dividend (February 23)
Ex-dividend date – Two working days prior to date of record (for example, February 19, since Feb. 23 was a Monday). Shareholders buying stock on or after ex-dividend date will not receive dividends.
Payment date – The date when dividend checks are mailed (for example, April 27)

Слайд 179Stock Dividends
A stock dividend entails the distribution of additional shares of
stock in lieu of cash payment.
While the number of common stock outstanding increases, the firm’s investments and future earnings prospects do not change.
While the number of common stock outstanding increases, the firm’s investments and future earnings prospects do not change.

Слайд 180Stock Splits
A stock split involves exchanging more (or less in the
case of “reverse” split) shares of stock for firm’s outstanding shares.
While the number of common stock outstanding increases (or decreases in the case of reverse split), the firm’s investments and future earnings prospects do not change.
Stock splits and stock dividends are far less frequent than cash dividends.
While the number of common stock outstanding increases (or decreases in the case of reverse split), the firm’s investments and future earnings prospects do not change.
Stock splits and stock dividends are far less frequent than cash dividends.
")
Слайд 181Stock Repurchases
A stock repurchase (stock buyback) occurs when a firm repurchases
its own stock. This results in a reduction in the number of shares outstanding.
From shareholder’s perspective, a stock repurchase has potential tax advantage as opposed to cash dividends.
From shareholder’s perspective, a stock repurchase has potential tax advantage as opposed to cash dividends.
 occurs when a firm repurchases its own stock. This")
Слайд 182Stock Repurchase -- Benefits
A means of providing an internal investment opportunity
An
approach for modifying the firm’s capital structure
A favorable impact on earnings per share
The elimination of a minority ownership group of stockholders
The minimization of the dilution in earnings per share associated with mergers
The reduction in the firm’s costs associated with servicing small stockholders
A favorable impact on earnings per share
The elimination of a minority ownership group of stockholders
The minimization of the dilution in earnings per share associated with mergers
The reduction in the firm’s costs associated with servicing small stockholders

Слайд 183A Share Repurchase as a Dividend, Financing, Investment Decision
When a firm
repurchases stock when it has excess cash, it can be regarded as a dividend decision.
If a firm issues debt and then repurchases stock, it alters the debt-equity mix and thus can be regarded as a financing or capital structure decision.
If a firm repurchases stock because it feels the prices are depressed, the decision to repurchase may be seen as an investment decision. Of course, no company can survive or prosper by investing only its own stock!

Слайд 184Unsecured Sources:
Trade Credit
Trade credit arises spontaneously with the firm’s purchases. Often,
the credit terms offered with trade credit involve a cash discount for early payment.
For example, the terms “2/10 net 30” means a 2% discount is offered for payment within 10 days, or the full amount is due in 30 days.
In this case, a 2% penalty is involved for not paying within 10 days.
For example, the terms “2/10 net 30” means a 2% discount is offered for payment within 10 days, or the full amount is due in 30 days.
In this case, a 2% penalty is involved for not paying within 10 days.

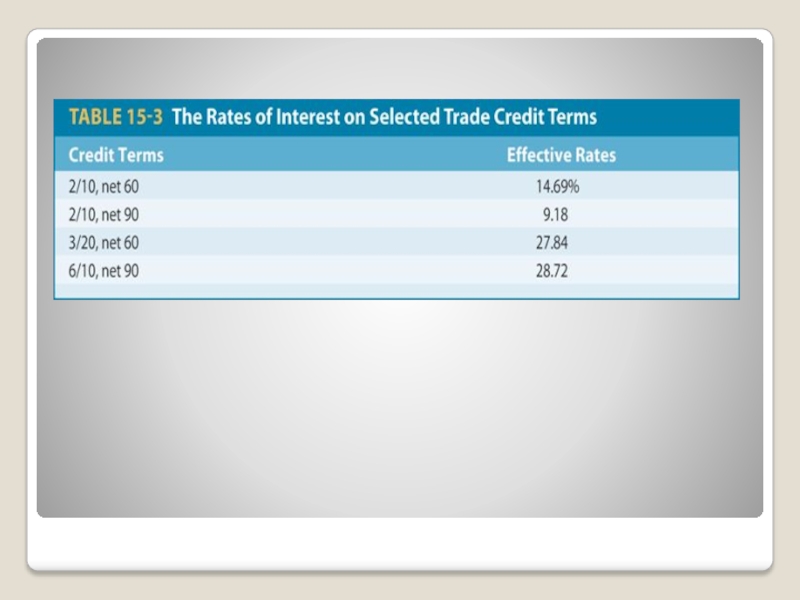
Слайд 186Effective Cost of Passing
Up a Discount
Ex.: Terms 2/10 net 30
The
equivalent APR of this discount is:
APR = $0.02/$.98 × [1/(20/360)]
= 0.3673 or 36.73%
The effective cost of delaying payment for 20 days is 36.73%.
The effective cost of delaying payment for 20 days is 36.73%.

Слайд 187Unsecured Sources:
Bank Credit
Commercial banks provide unsecured short-term credit in two
forms:
Lines of credit
Transaction loans (notes payable)
Lines of credit
Transaction loans (notes payable)

Слайд 188Line of Credit
Informal agreement between a borrower and a bank about
the maximum amount of credit the bank will provide the borrower at any one time.
There is no legal commitment on the part of the bank to provide the stated credit.
Banks usually require that the borrower maintain a minimum balance in the bank throughout the loan period (known as compensating balance).
Interest rate on a line of credit tends to be floating.
There is no legal commitment on the part of the bank to provide the stated credit.
Banks usually require that the borrower maintain a minimum balance in the bank throughout the loan period (known as compensating balance).
Interest rate on a line of credit tends to be floating.

Слайд 189Revolving Credit
Revolving credit is a variant of the line of credit
form of financing.
A legal obligation is involved.
A legal obligation is involved.

Слайд 190Transaction Loans
A transaction loan is made for a specific purpose. This
is the type of loan that most individuals associate with bank credit and is obtained by signing a promissory note.

Слайд 191Unsecured Sources:
Commercial Paper
The largest and most credit-worthy companies are able
to use commercial paper—a short-term promise to pay that is sold in the market for short-term debt securities.
Maturity: Usually 6 months or less.
Interest Rate: Slightly lower (1/2 to 1%) than the prime rate on commercial loans.
New issues of commercial paper are placed directly or dealer placed.
Maturity: Usually 6 months or less.
Interest Rate: Slightly lower (1/2 to 1%) than the prime rate on commercial loans.
New issues of commercial paper are placed directly or dealer placed.

Слайд 192Commercial Paper: Advantages
Interest rates
Rates are generally lower than rates on bank
loans
Compensating-balance requirement
No minimum balance requirements are associated with commercial paper
Amount of credit
Offers the firm with very large credit needs a single source for all its short-term financing
Prestige
Signifies credit status
Compensating-balance requirement
No minimum balance requirements are associated with commercial paper
Amount of credit
Offers the firm with very large credit needs a single source for all its short-term financing
Prestige
Signifies credit status

Слайд 193Secured Sources of Loans
Secured loans have assets of the firm pledged
as collateral. If there is a default, the lender has first claim to the pledged assets. Because of its liquidity, accounts receivable is regarded as the prime source for collateral.
Accounts Receivable Loans
Pledging Accounts Receivable
Factoring Accounts Receivable
Inventory Loans
Accounts Receivable Loans
Pledging Accounts Receivable
Factoring Accounts Receivable
Inventory Loans

Слайд 194Pledging Accounts Receivable
Borrower pledges accounts receivable as collateral for a loan
obtained from either a commercial bank or a finance company.
The amount of the loan is stated as a percentage of the face value of the receivables pledged.
If the firm pledges a general line, then all of the accounts are pledged as security (simple and inexpensive).
If the firm pledges specific invoices, each invoice must be evaluated for creditworthiness (more expensive).

Слайд 195Pledging Accounts Receivable
Credit Terms: Interest rate is 2–5% higher than the
bank’s prime rate. In addition, handling fee of 1–2% of the face value of receivables is charged.
While pledging has the attraction of offering considerable flexibility to the borrower and providing financing on a continuous basis, the cost of using pledging as a source of short-term financing is relatively higher compared to other sources.
While pledging has the attraction of offering considerable flexibility to the borrower and providing financing on a continuous basis, the cost of using pledging as a source of short-term financing is relatively higher compared to other sources.

Слайд 196Pledging Accounts Receivable
Factoring accounts receivable involves the outright sale of a
firm’s accounts to a financial institution called a factor.
A factor is a firm (such as commercial financing firm or a commercial bank) that acquires the receivables of other firms. The factor bears the risk of collection in exchange for a fee of 1–3 percent of the value of all receivables factored.
A factor is a firm (such as commercial financing firm or a commercial bank) that acquires the receivables of other firms. The factor bears the risk of collection in exchange for a fee of 1–3 percent of the value of all receivables factored.

Слайд 197Secured Sources:
Inventory Loans
These are loans secured by inventories.
The amount of
the loan that can be obtained depends on the marketability and perishability of the inventory.

Слайд 198Types of Inventory Loans
Floating or Blanket Lien Agreement
The borrower gives the
lender a lien against all its inventories.
Chattel Mortgage Agreement
The inventory is identified and the borrower retains title to the inventory but cannot sell the items without the lender’s consent.
Field Warehouse-Financing Agreement
Inventories used as collateral are physically separated from the firm’s other inventories and are placed under the control of a third-party field-warehousing firm.
Terminal Warehouse Agreement
Inventories pledged as collateral are transported to a public warehouse that is physically removed from the borrower’s premises.

Слайд 199Working Capital
Working capital - The firm’s total investment in current assets.
Net
working capital - The difference between the firm’s current assets and its current liabilities.

Слайд 200Managing Net Working Capital
Managing net working capital is concerned with managing
the firm’s liquidity. This entails managing two related aspects of the firm’s operations:
Investment in current assets
Use of short-term or current liabilities
Investment in current assets
Use of short-term or current liabilities

Слайд 201How Much Short-Term Financing Should a Firm Use?
This question is addressed
by hedging principle of working-capital management

Слайд 202The Appropriate Level of Working Capital
Managing working capital involves interrelated decisions
regarding investments in current assets and use of current liabilities.
Hedging principle or principle of self-liquidating debt provides a guide to the maintenance of appropriate level of liquidity.
Hedging principle or principle of self-liquidating debt provides a guide to the maintenance of appropriate level of liquidity.

Слайд 203The Hedging Principle
The hedging principle involves matching the cash-flow-generating characteristics of
an asset with the maturity of the source of financing used to finance its acquisition.
Thus, a seasonal need for inventories should be financed with a short-term loan or current liability.
On the other hand, investment in equipment that is expected to last for a long time should be financed with long-term debt.
Thus, a seasonal need for inventories should be financed with a short-term loan or current liability.
On the other hand, investment in equipment that is expected to last for a long time should be financed with long-term debt.

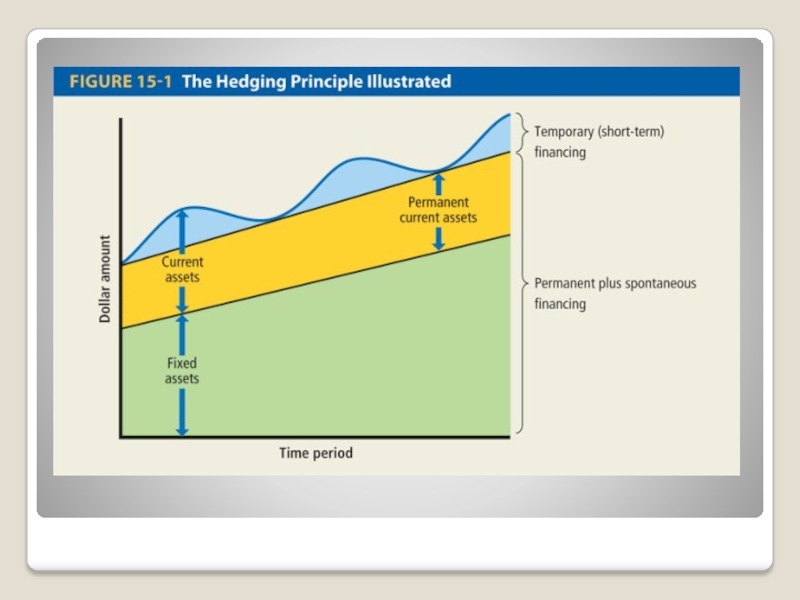
Слайд 205Permanent and Temporary Assets
Permanent investments
Investments that the firm expects to
hold for a period longer than one year
Temporary investments
Current assets that will be liquidated and not replaced within the current year
Temporary investments
Current assets that will be liquidated and not replaced within the current year

Слайд 206Temporary and Permanent Sources of Financing
Temporary sources of financing consist of
current liabilities such as short-term secured and unsecured notes payable.
Permanent sources of financing include intermediate-term loans, long-term debt, preferred stock, and common equity.
Permanent sources of financing include intermediate-term loans, long-term debt, preferred stock, and common equity.

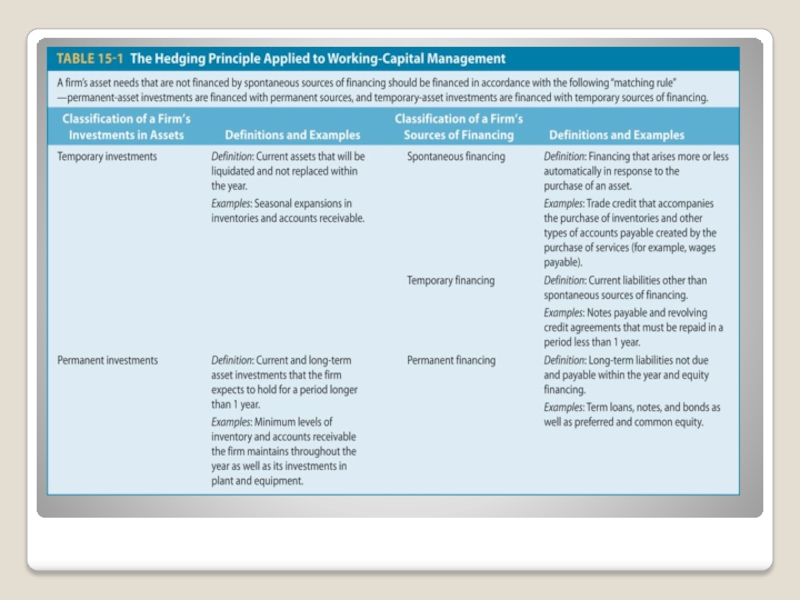
Слайд 208The Cash Conversion Cycle
A firm can minimize its working capital by
speeding up collection on sales, increasing inventory turns, and slowing down the disbursement of cash. This is captured by the cash conversion cycle (CCC).
CCC = days of sales outstanding + days of sales in inventory – days of payables outstanding.
Figure 15-2 shows that both Dell and Apple have been effective in reducing their CCC.
CCC is below zero due to effective management of inventories and being able to receive favorable credit terms.
See Table 15-2 for Dell’s CCC.

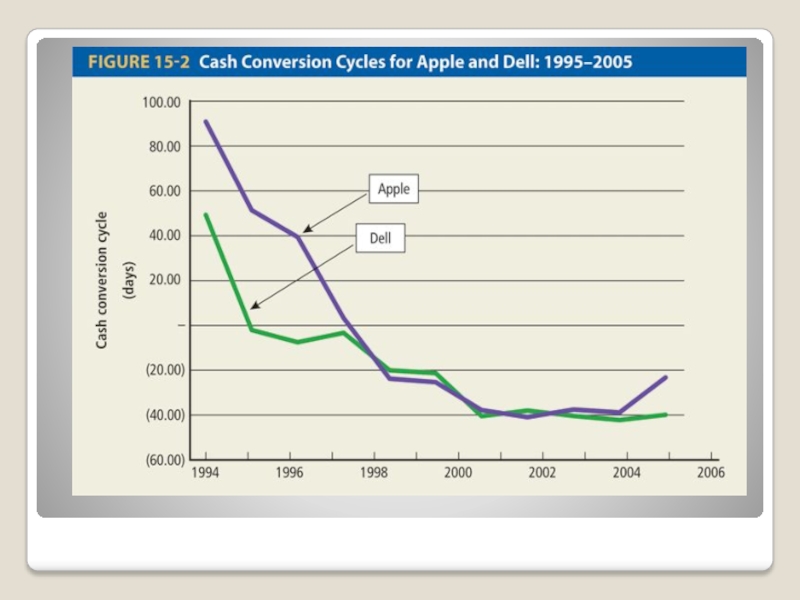
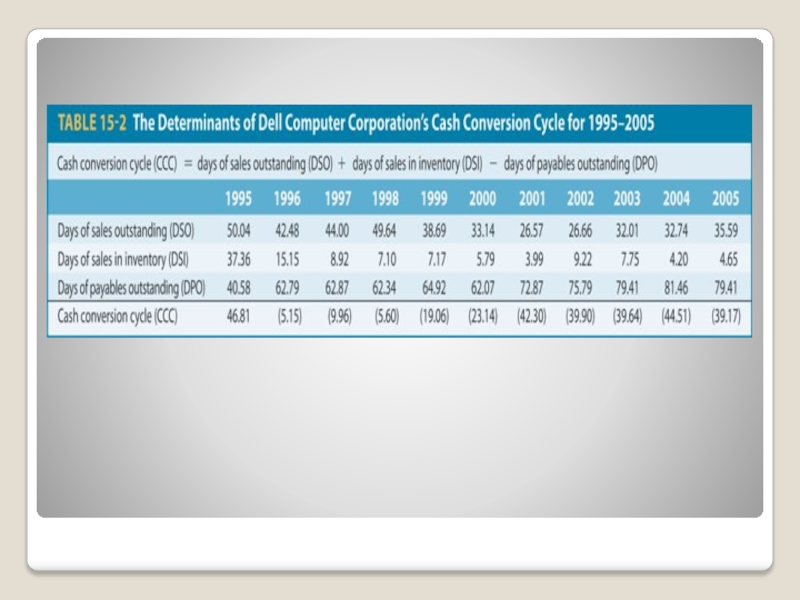

Слайд 212APR example
A company plans to borrow $1,000 for 90 days. At
maturity, the company will repay the $1,000 principal amount plus $30 interest. What is the APR?
APR = ($30/$1,000) × [1/(90/360)]
= 0.03 × (360/90)
= 0.12 or 12%

Слайд 213Annual Percentage Yield (APY)
APR does not consider compound interest. To account
for the influence of compounding, we must calculate APY or annual percentage yield.
APY = (1 + i/m)m – 1
Where:
i is the nominal rate of interest per year
m is number of compounding periods within a year
APY = (1 + i/m)m – 1
Where:
i is the nominal rate of interest per year
m is number of compounding periods within a year
APR does not consider compound interest. To account for the influence of")
Слайд 214APY example
In the previous example,
# of compounding periods 360/90 = 4
Rate
= 12%
APY = (1 + 0.12/4)4 –1 = 0.0126% or 12.6%
APY = (1 + 0.12/4)4 –1 = 0.0126% or 12.6%

Слайд 215APR or APY ?
Because the differences between APR and APY are
usually small, we can use the simple interest values of APR to compute the cost of short-term credit.